


· 19 min read
Commitment of Traders: How to Read the COT Report
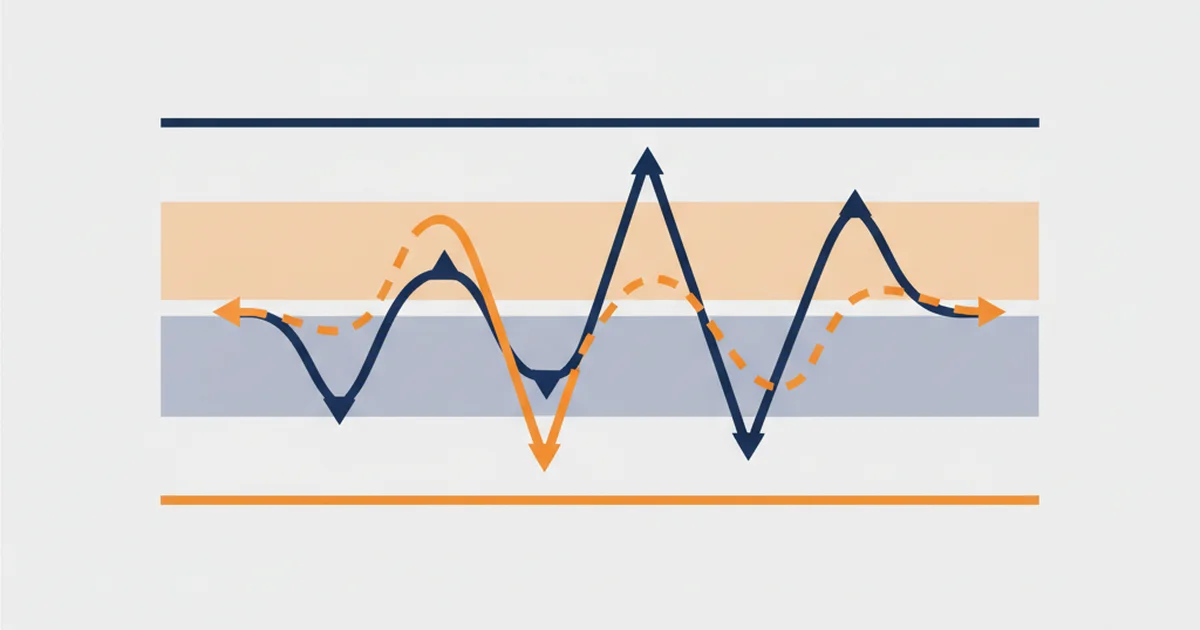
The Commitment of Traders report shows who holds what in a market. How to read the COT report and its three positioning signals across gold, EUR/USD and Bitcoin.
Reading what the chart is actually doing. Real charts, not idealised diagrams.
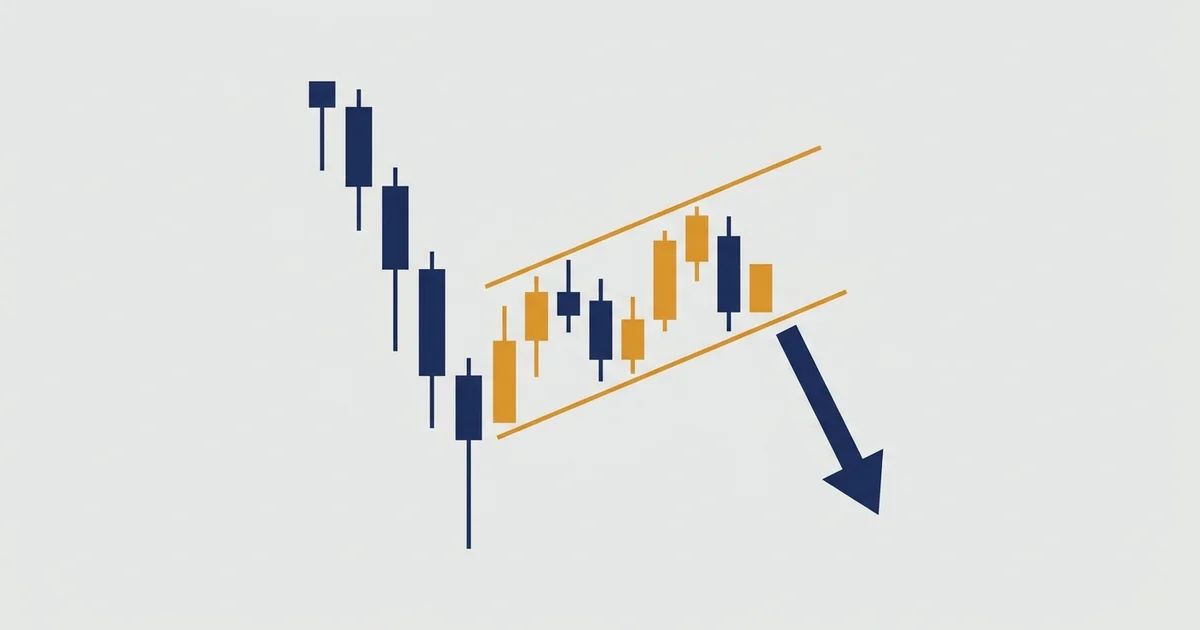
The bear flag pattern across gold, Bitcoin, and Forex: how to spot the flagpole, flag, and breakdown, and why it only pays in a real downtrend.
 alex-rivers · · 18 min read
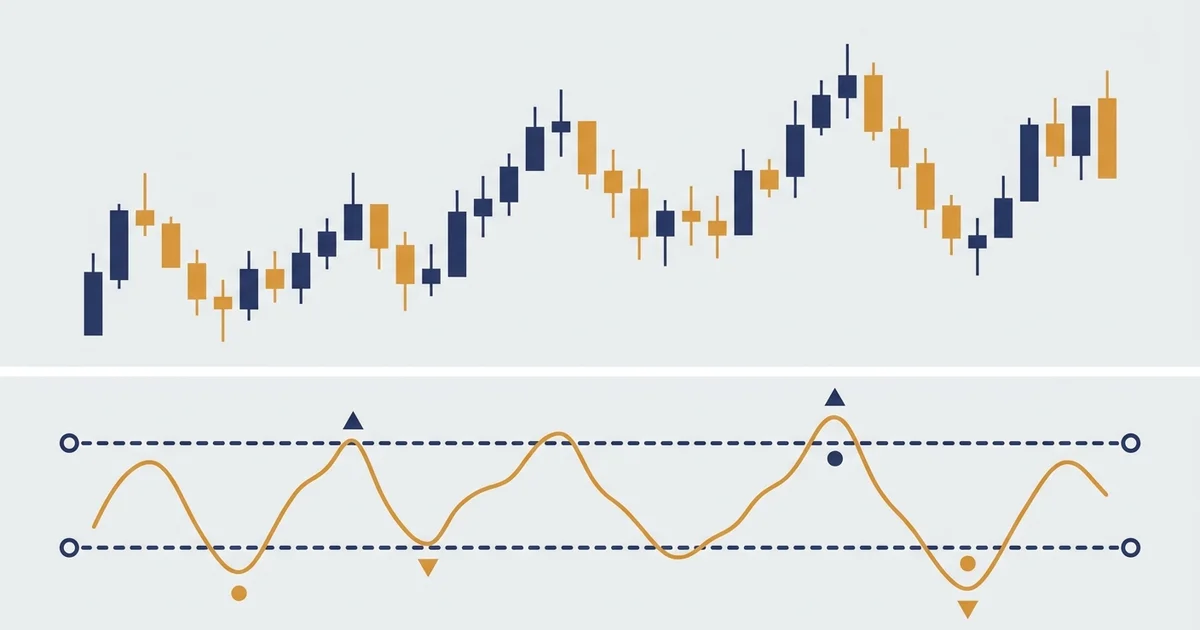
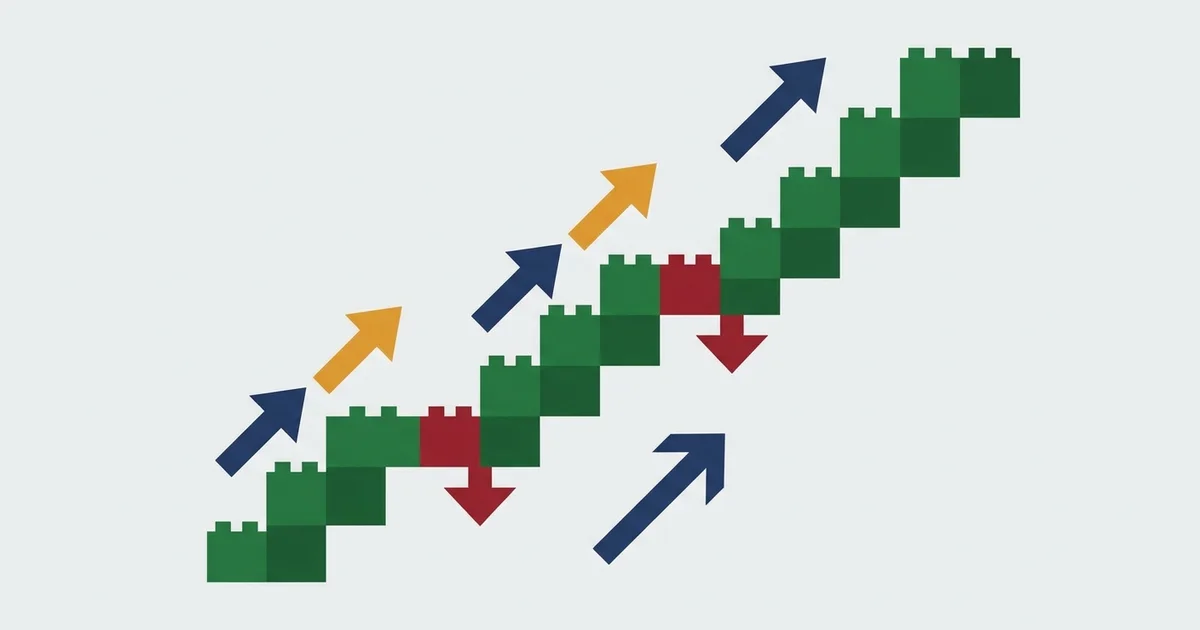
 This is about reading what the chart is actually doing. Each guide takes a pattern apart: what it represents in order flow, when it fails, how higher-timeframe context kills or confirms the read. Annotations are on real charts, not idealised diagrams. Failure modes sit next to the textbook wins because both happen. Every pattern ties back to a live trade where reading it right mattered.
 Technical Analysis
 The Commitment of Traders report shows who holds what in a market. How to read the COT report and its three positioning signals across gold, EUR/USD and Bitcoin.
 Technical Analysis
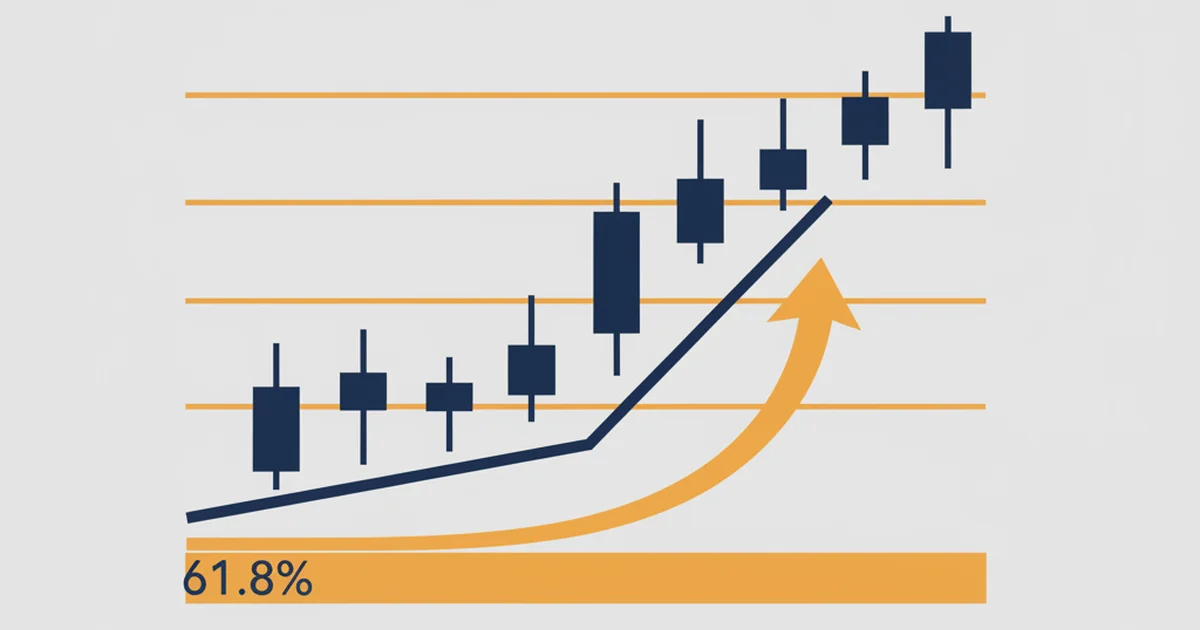
 A Fibonacci extension projects price targets past a move. We built the 161.8% target on eight years of daily gold data: where it pays, and where the target misses.
 Technical Analysis
 Heikin Ashi smooths price so trends stand out. On eight years of gold data, three setups paid, led by a doji reversal at a 3.4 profit factor.
 Technical Analysis
 The inside bar pattern is a two-candle pause you trade on the breakout of the mother bar. Unlike most single-candle setups the raw version already pays on trending markets, and one filter lifts every one of them: heavy volume on the breakout. On silver it pushed the profit factor to 4.77. Real charts, real numbers, and why the short side fails.
 Technical Analysis
 The pin bar is a single rejection candle, and on its own it is a coin flip. We ran it across eight years of gold, oil, silver and Bitcoin, and one filter changed everything: trade the pin with a trending market and it pays, fade the trend and it dies. Real charts, real numbers, the bullish and bearish pin explained.
 Technical Analysis
 We tested the CCI indicator across eight years on gold, EUR/USD and Bitcoin. The commodity channel index reversion play is a coin flip; the trend-pullback pays, and it pays most in a calm market. Real numbers, real charts.
 Technical Analysis
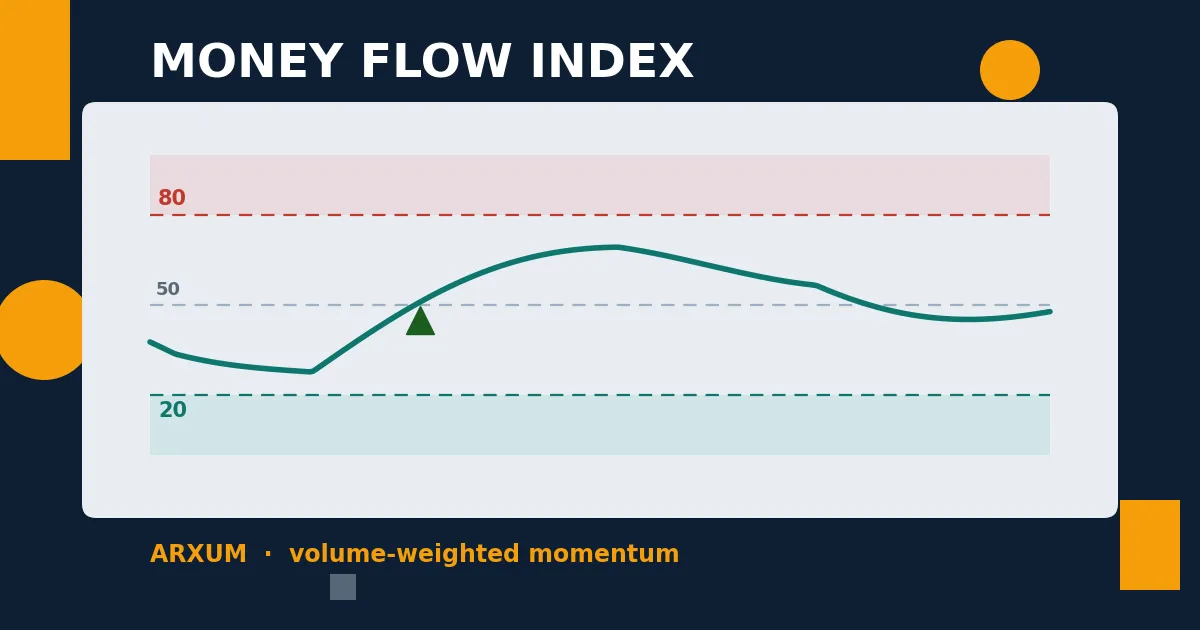
 We tested the Money Flow Index across eight years on gold, silver, Bitcoin and EUR/USD. The MFI money-flow pullback pays, and the volume edge is genuine where the volume is real. Full numbers, real charts.
 Technical Analysis
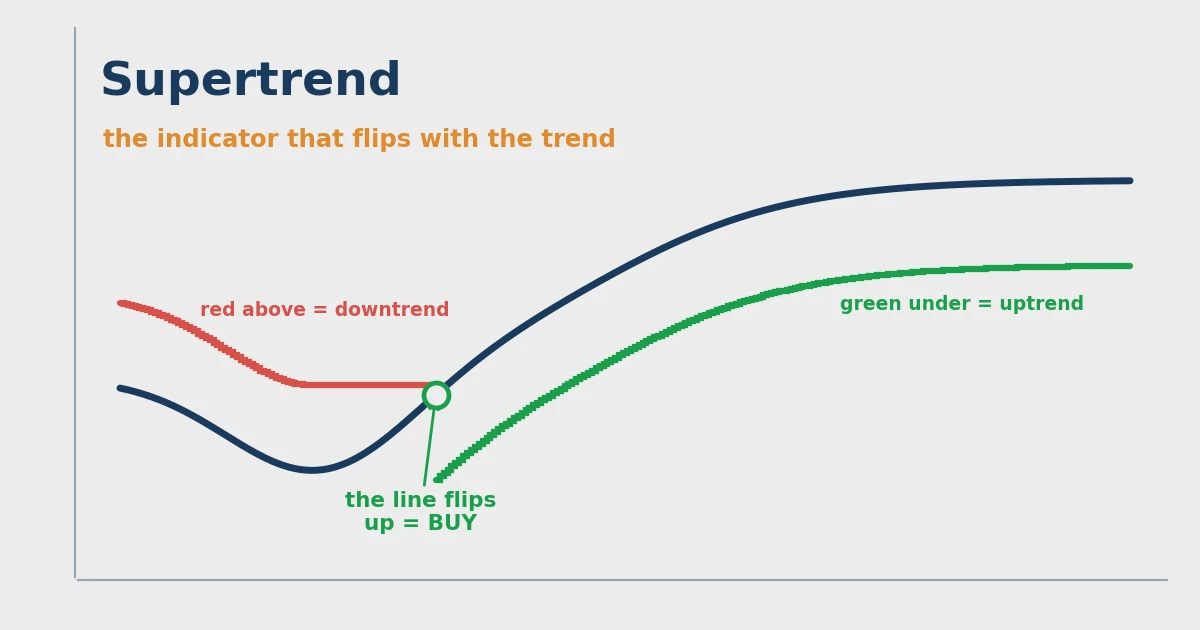
 The Supertrend indicator is a trend-riding trailing stop. Over eight years its flip earned a 2.05 to 2.87 profit factor on gold, silver and Bitcoin. The twist: volume hurts it, a calm market is the real edge.
 Technical Analysis
 Learn to identify and trade the morning star candlestick pattern with entry rules, stop placement, and real forex examples from an 8-year FX desk trader.
 Technical Analysis
 Learn how renko charts work, how to set brick size using ATR, and a backtested breakout strategy that filters out market noise.
 Technical Analysis
 How the Donchian Channel indicator works, which settings perform best, and how to build a systematic breakout strategy — with backtested results on EUR/USD and BTC.
 Technical Analysis
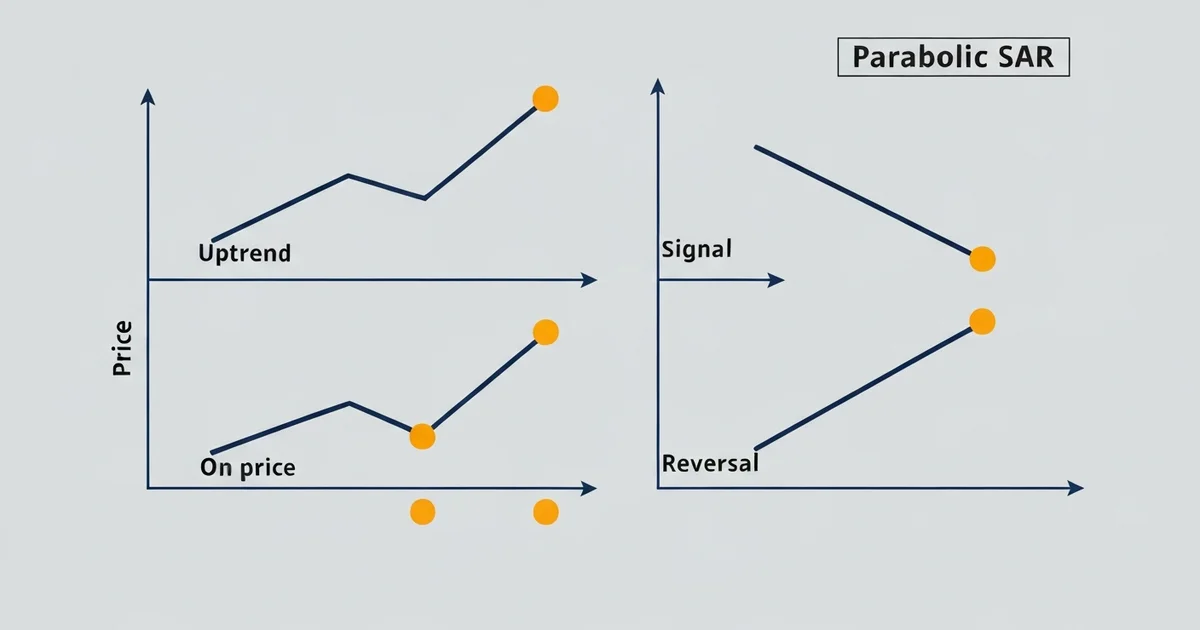
 Learn how to use Parabolic SAR for trend direction and trailing stops. Settings guide, ADX filter strategy, and backtested results on EUR/USD and XAU/USD.
 Technical Analysis
 What the Keltner Channel is, how ATR-based bands work, and how to trade breakouts, trend walks, and squeezes with this volatility indicator.
 Technical Analysis
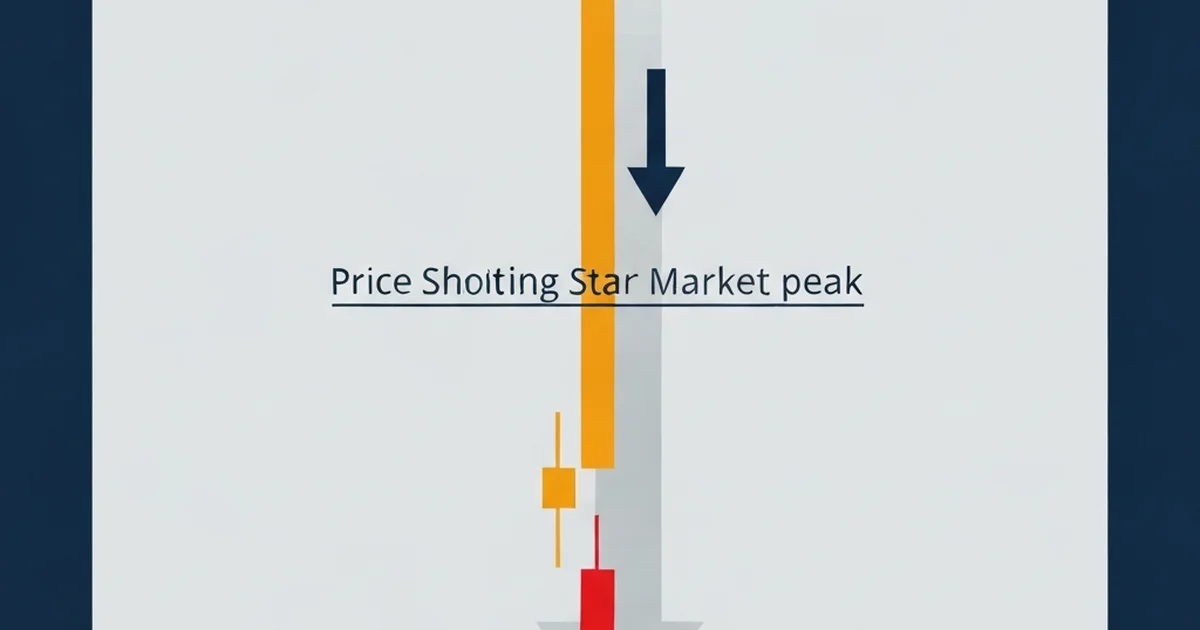
 The shooting star candlestick signals bearish reversals at market tops. Learn the exact pattern rules, confirmation method, and trade setups from an FX desk trader.
 Technical Analysis
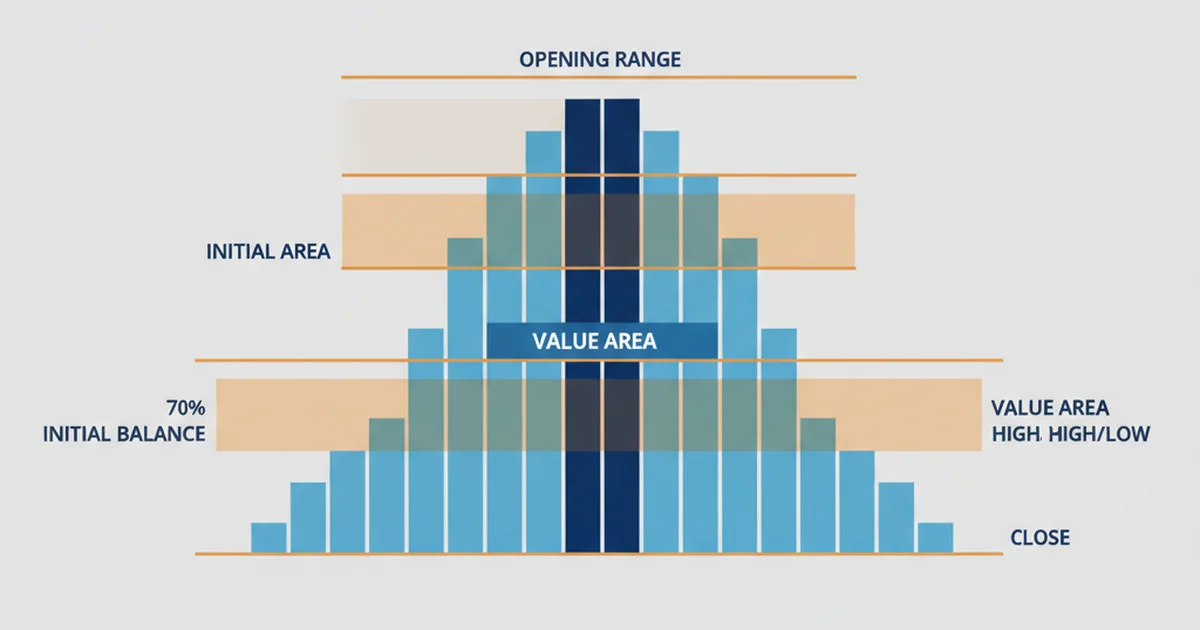
 Learn to read market profile TPO charts, identify value areas and POC, and use institutional structure to improve your day trading entry timing.
 Technical Analysis
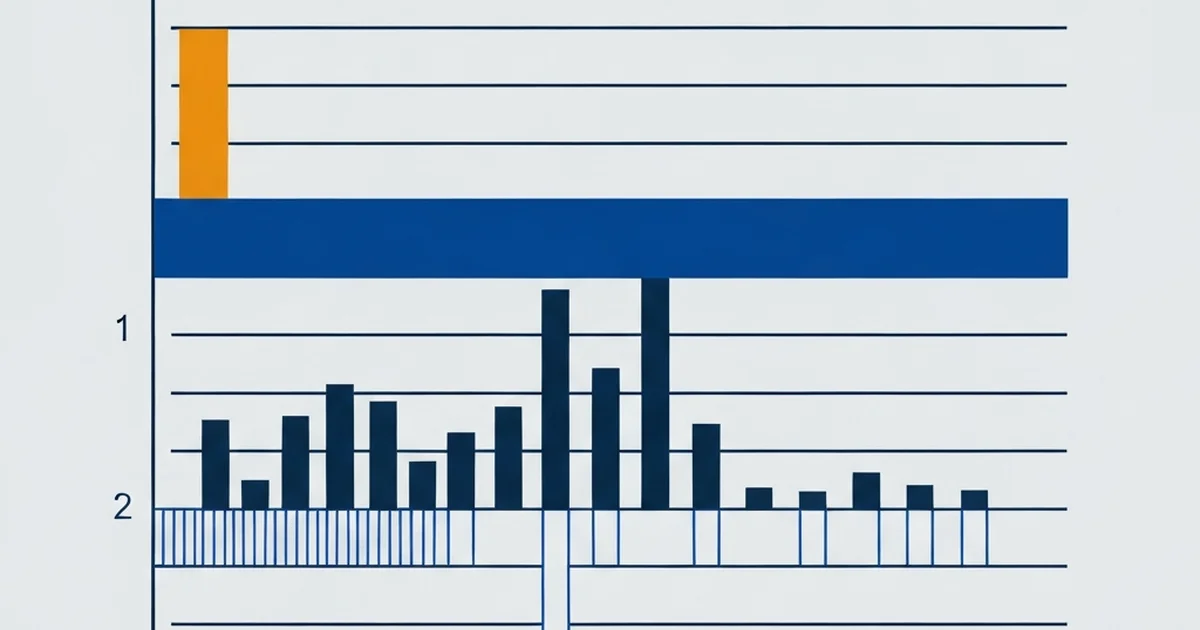
 Learn how to use volume profile in trading, read POC, value area, and high/low volume nodes to spot key price levels where institutions trade.
 Technical Analysis
 Learn harmonic patterns with exact Fibonacci ratios. Gartley, Bat, Butterfly, Crab, and Cypher patterns with real EUR/USD and GBP/USD entry examples.
 Technical Analysis
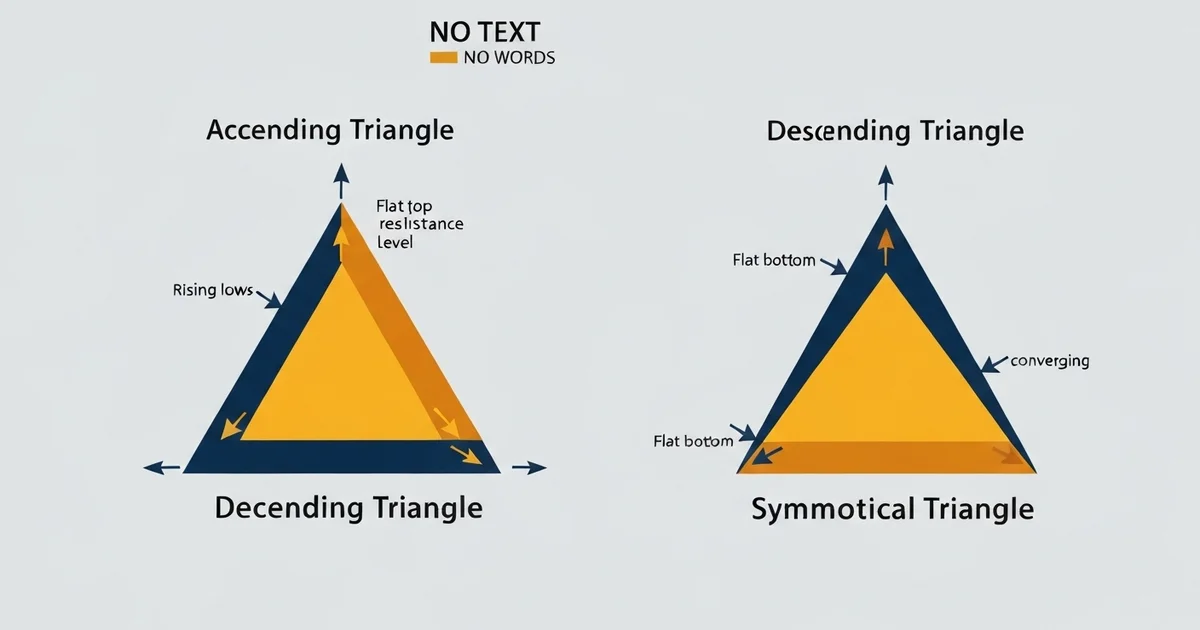
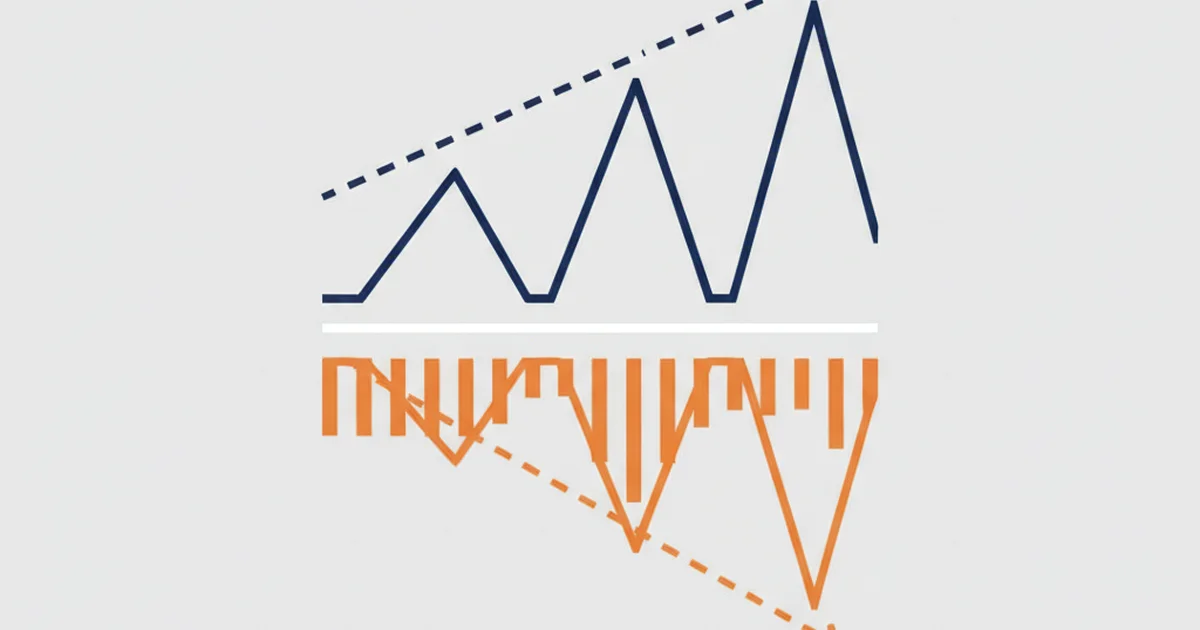
 The ascending, descending, and symmetrical triangle patterns, tested across eight years of gold, the euro, the pound, and six years of Bitcoin. The three types have very different odds: the ascending triangle led the test on gold, winning 71 percent of trades, the symmetrical triangle was the steady workhorse, and the descending triangle lost money in markets that trended up. Real trades, real numbers, and a clear rule for which break to take.
 Technical Analysis
 Heikin Ashi candles filter market noise and reveal trend direction more clearly than standard candlesticks. Learn how to read signals and trade them.
 Technical Analysis
 Learn the hammer candlestick, inverted hammer, and hanging man. Recognition rules, entry timing, stop placement, and what actually works in live trading.
 Technical Analysis
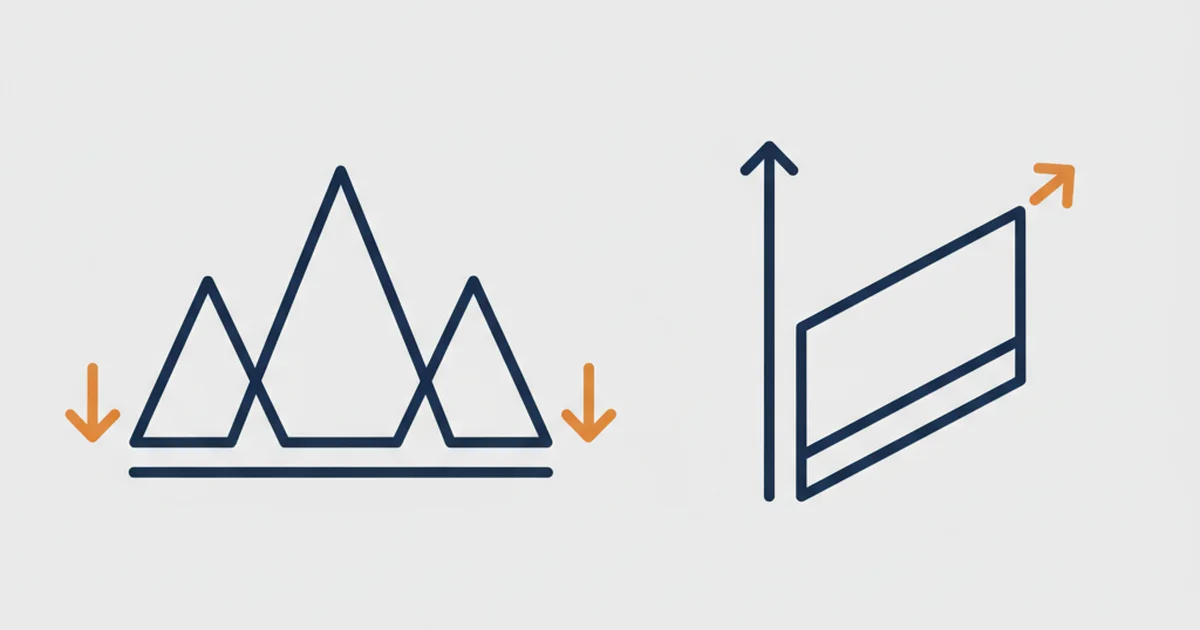
 Learn how to trade triple top and triple bottom chart patterns — formation, volume rules, entry and stop placement with real forex examples.
 Technical Analysis
 How to trade the inverse head and shoulders pattern: neckline entry rules, stop placement, and measured move targets from a forex desk trader.
 Technical Analysis
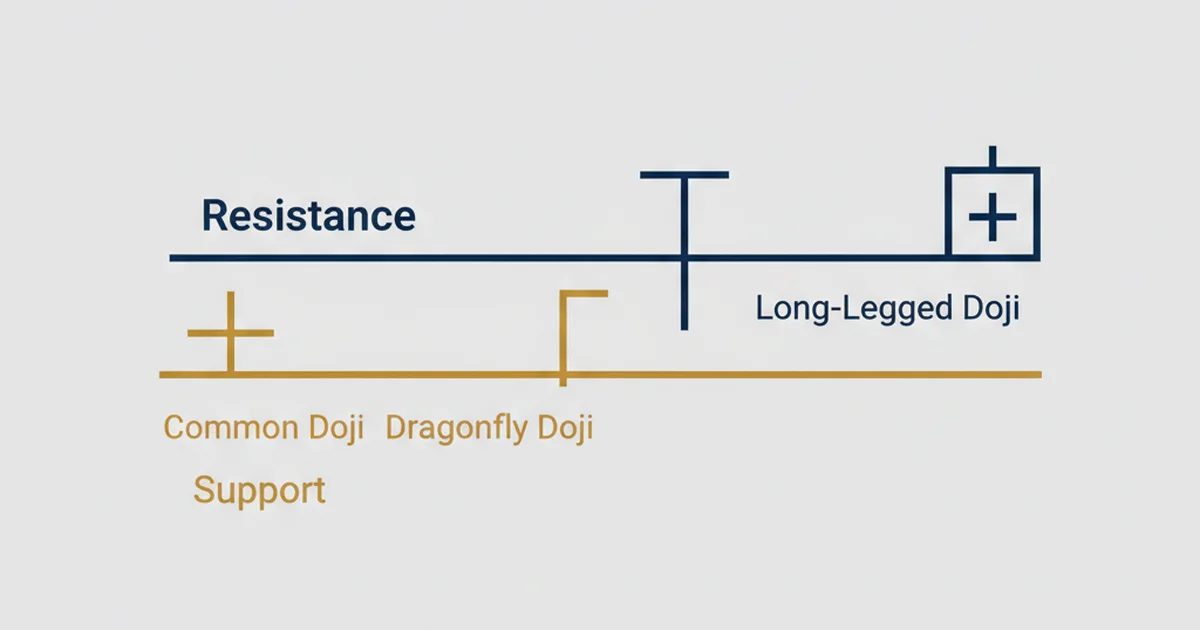
 Learn how to read doji candlestick patterns in forex and crypto. Covers all types: standard, gravestone, dragonfly, and long-legged, with entry rules.
 Technical Analysis
 How to identify regular and hidden MACD divergence with real trade results. Entry rules, stop placement, and confirmation signals from live BTC and EUR/USD setups.
 Technical Analysis
 Learn pivot point types, calculation formulas, and how to trade S/R levels with standard, Fibonacci, and Camarilla pivots. Includes entry rules and stop placement.
 Technical Analysis
 Learn what an engulfing candle is, how bullish and bearish patterns work, and how to trade them with real win rate data from 14 months of live trading.
 Technical Analysis
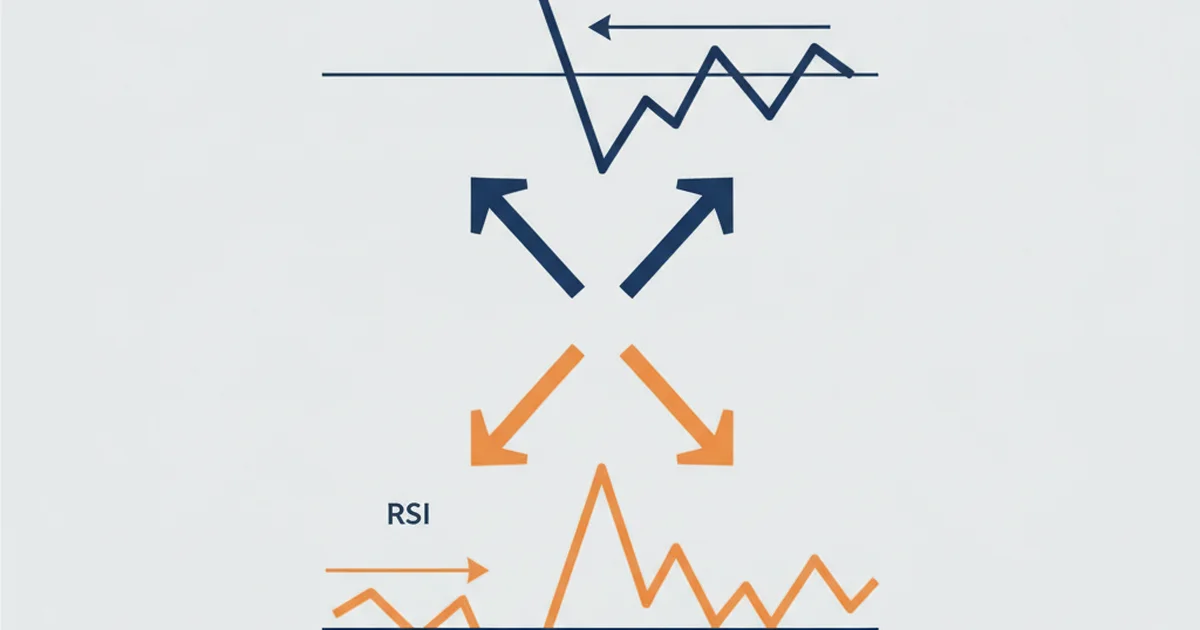
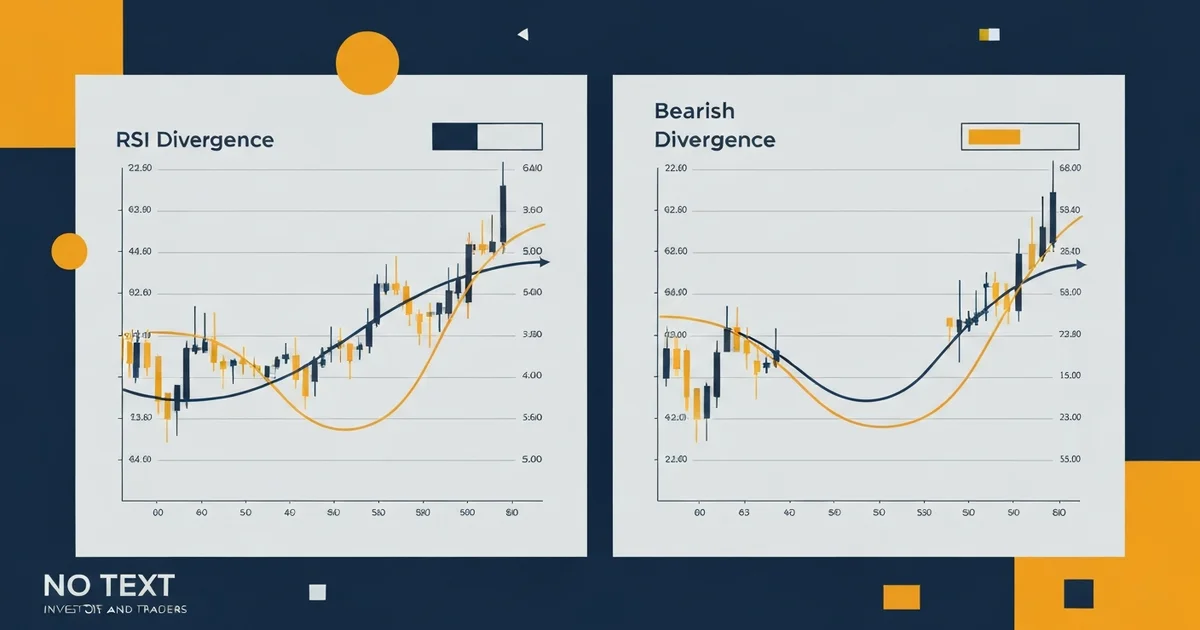
 Bullish divergence signals weakening selling pressure before price reverses. Learn to spot regular, bearish, and hidden divergence across RSI, MACD, and Stochastic.
 Technical Analysis
 The Ichimoku Cloud is a trend engine. Built and run on years of gold, EUR/USD and Bitcoin data, its longs paid and its shorts mostly didn't. The setups, the filter, real charts.
 Technical Analysis
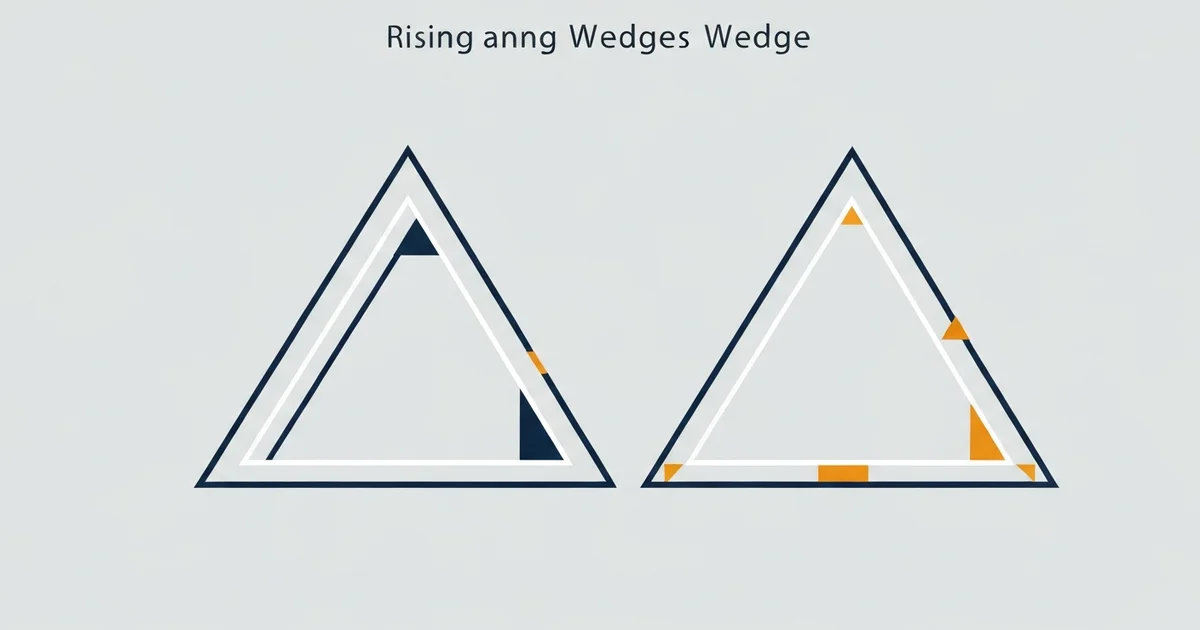
 The rising wedge pattern and the falling wedge pattern, tested across eight years of gold, the euro, the pound, and six years of Bitcoin. Wedges form on every one of those markets, but only a few breakouts actually pay: the falling wedge on gold and the rising wedge on Bitcoin led the test, the euro's wedges lost, and the pound was too thin to trust. Real trades, real numbers, and a clear rule for which breakouts to take.
 Technical Analysis
 The top day trading indicators ranked by backtested results. RSI, VWAP, MACD, ATR, and EMAs — when to use each and how to combine them.
 Technical Analysis
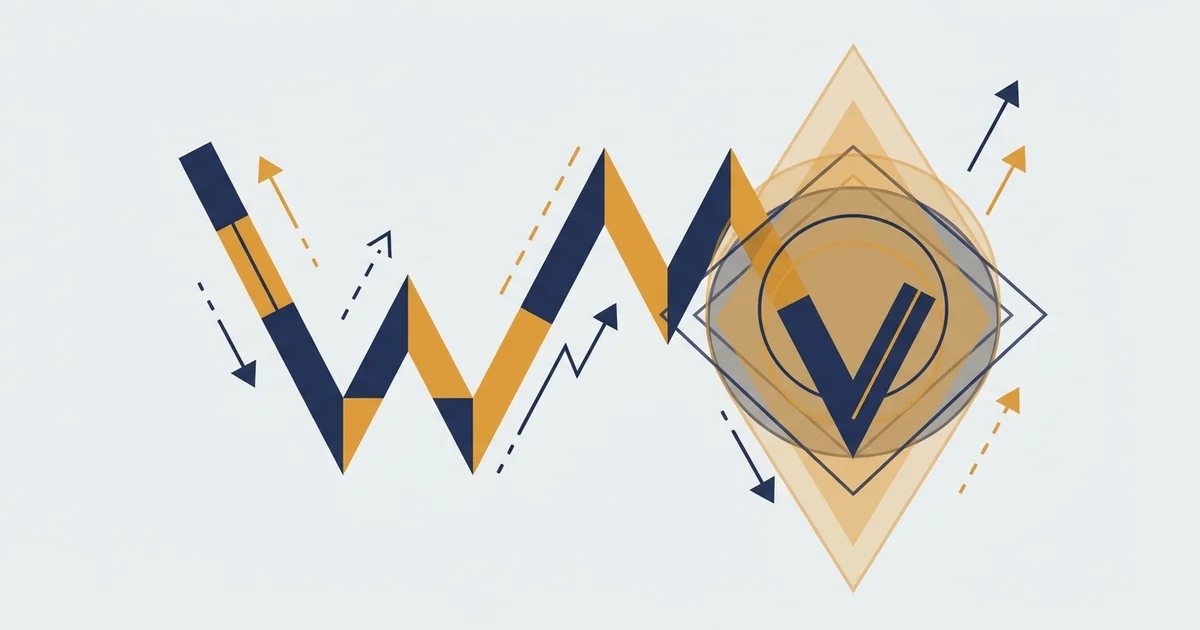
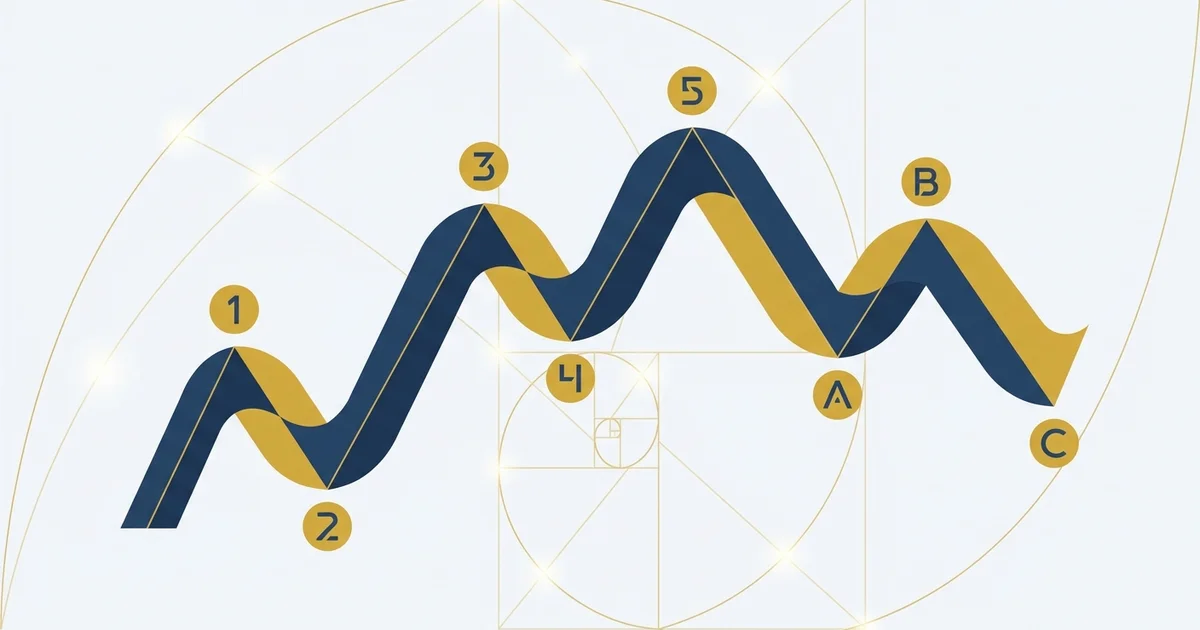
 Elliott Wave Theory explains how markets move in repeating 5-wave cycles. Learn the rules, how to count waves, and how to apply them in your trading.
 Technical Analysis
 Learn Wyckoff accumulation and distribution: spot the 5 phases and time your entry before the markup or markdown begins.
 Technical Analysis
 The cup and handle pattern, tested across eight years of gold, the pound, the euro, and Bitcoin. The finding: it pays where a market trends. On the daily chart gold returned a 3.46 profit factor and GBP/USD a 2.73, both above 50 percent wins. On the rangebound euro and on Bitcoin it lost. Real trades, real numbers, and the rules for where it actually works.
 Technical Analysis
 The bull flag and bear flag patterns, tested across eight years of gold, the euro, the pound, and Bitcoin. The daily bull flag paid on every market, but the famous advice to wait for a volume surge on the breakout helped on Bitcoin and quietly destroyed the edge on gold. Real trades, real numbers, and the rule for which confirmation to trust.
 Technical Analysis
 Best stochastic oscillator settings for scalping, day trading and swing trading, with real results from live FX account tests.
 Technical Analysis
 The death cross and golden cross explained, then backtested: which side of the 50/200 moving average crossover actually pays, on gold and forex, and the filter that fixes it.
 Technical Analysis
 EMA reacts faster to recent price moves; SMA smooths out noise. Which to use for trending markets, swing setups, and trend filters, with live results.
 Technical Analysis
 How the exponential moving average works, best EMA settings by timeframe, and a live trading strategy with 71% win rate from a real EUR/USD account.
 Technical Analysis
 Bollinger Bands explained in plain terms: the squeeze, the bands, walking the band, and the best settings. Then eight years of gold and EUR/USD data on what each read is actually worth.
 Technical Analysis
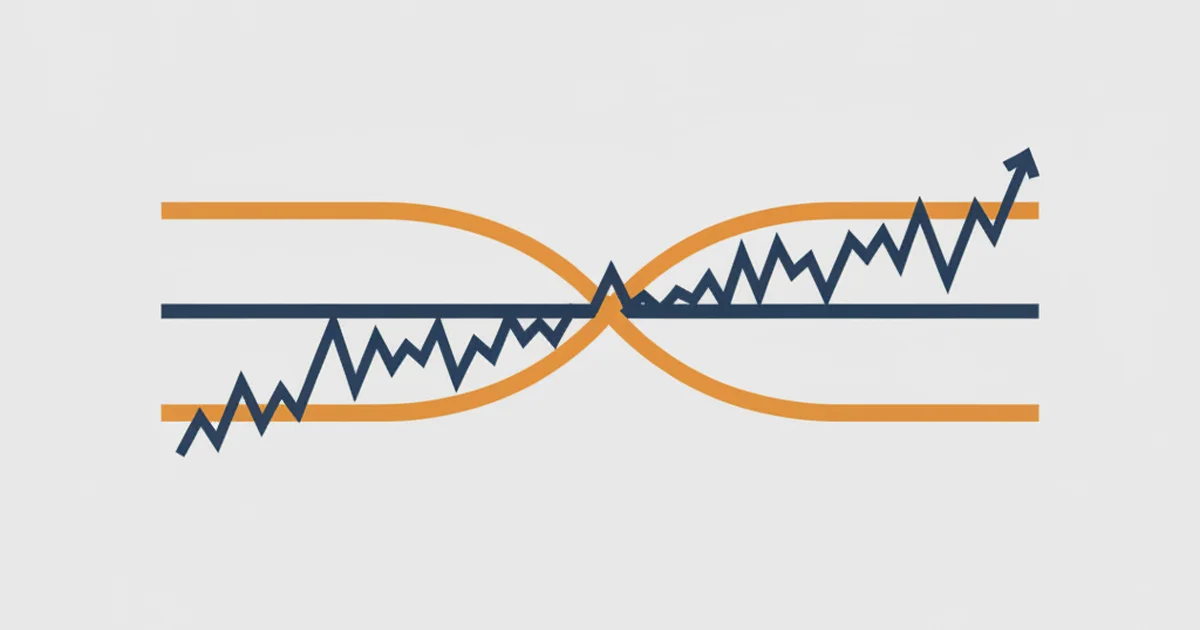
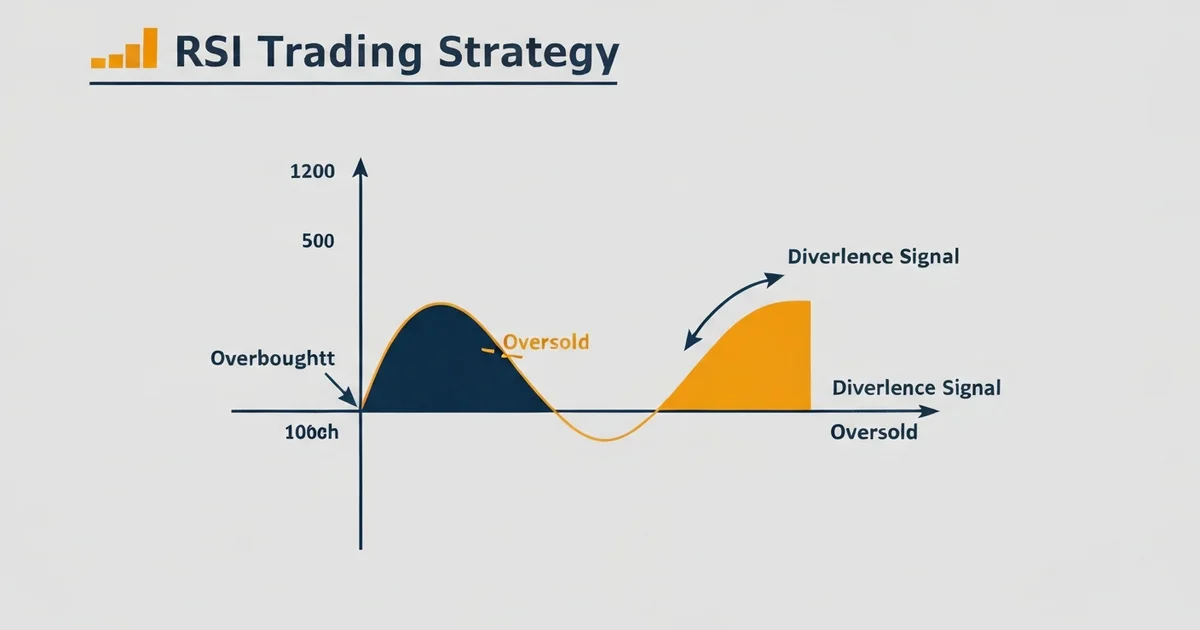
 We tested the RSI divergence strategy across eight years on gold, EUR/USD and Bitcoin. It wins often but barely breaks even, and collapses out-of-sample. The real RSI edge is the trend-pullback, with the numbers to prove it.
 Technical Analysis
 4 proven RSI trading strategies with entry rules, stop placement, and real win rates from 6 months of live testing on BTC and EUR/USD.
 Technical Analysis
 Learn how to backtest a trading strategy step by step: tools, key metrics, and the mistakes that kill 73% of strategies before they go live.
 Technical Analysis
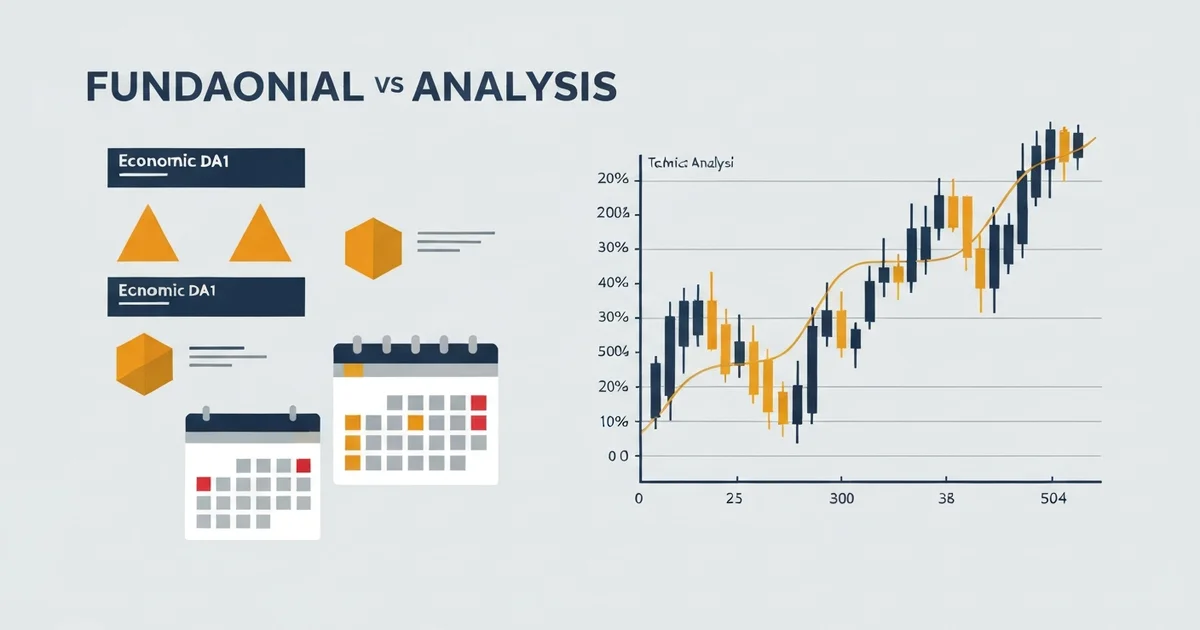
 What's the real difference? An FX desk veteran explains how fundamental and technical analysis work, and which approach actually makes money in forex and crypto.
 Technical Analysis
 Learn how Fibonacci retracement levels work in forex and crypto trading. Real EUR/USD setups, entry rules, and which levels actually matter.
 Technical Analysis
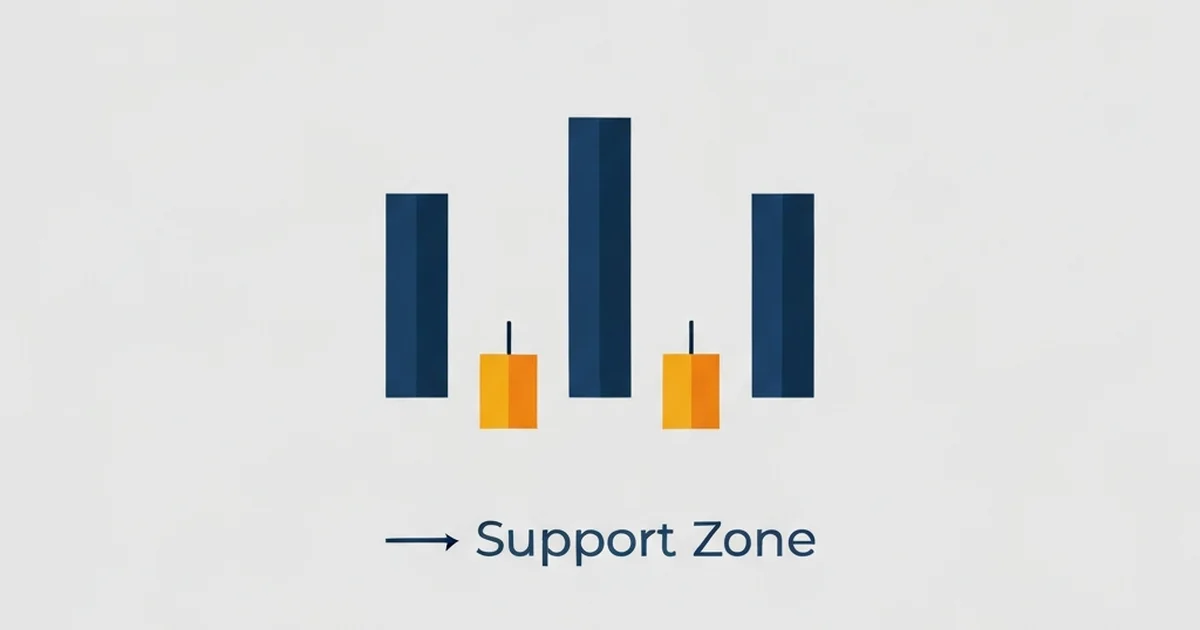
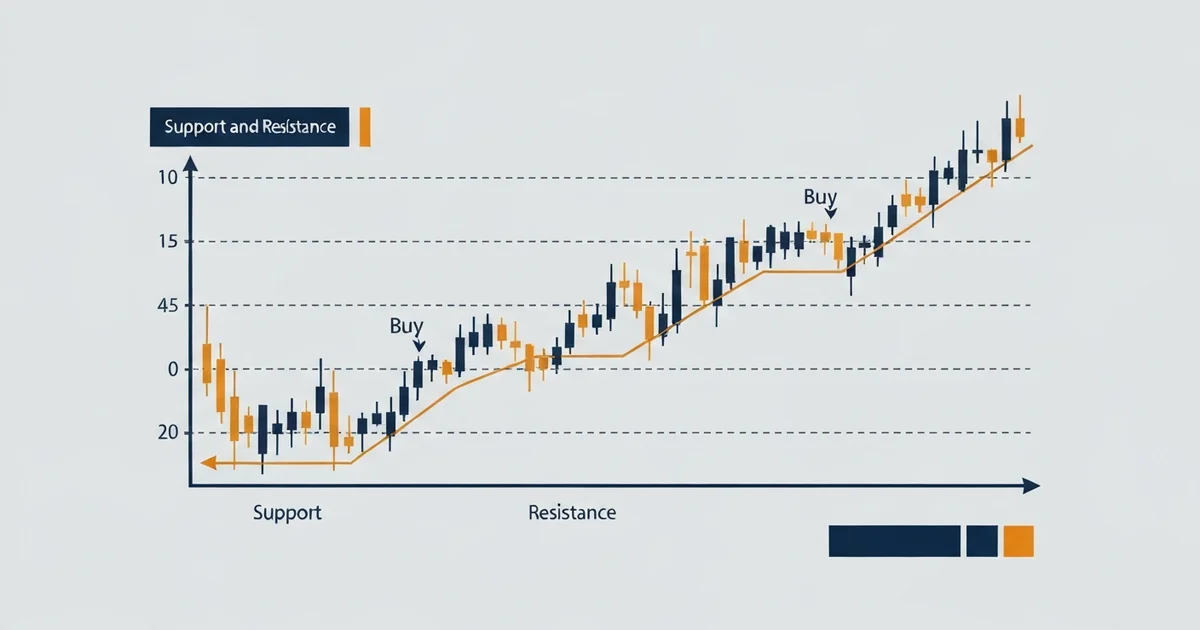
 Learn how to identify support and resistance levels and trade them. Real forex desk examples, entry signals, stop placement, and multi-timeframe tips.
 Technical Analysis
 Learn the 8 most reliable trading patterns, how to read them across timeframes, and why most pattern trades fail, tested across 4 years of EUR/USD data.
 Technical Analysis
 7 bullish chart patterns with real win rates from an 8-year FX desk: how to spot entries, set stops, and filter out the false breakouts.
 Technical Analysis
 The 12 candlestick patterns that actually produce consistent results in forex and crypto: exact entry rules, stop placement, and real chart examples for each formation.
 Technical Analysis
 Complete chart patterns cheat sheet: all major reversal and continuation patterns, entry rules, and targets in one reference. Bookmark this before your next trade.
 Technical Analysis
 Learn to trade 8 chart patterns: flags, triangles, H&S, double top/bottom, and wedges. EUR/USD entry triggers, stop placement, and measured targets. 68% backtested win rate.
 Technical Analysis
 Double top and double bottom chart patterns are reversal bets, so they pay where a market actually turns. On oil they worked both ways; on gold the double bottom paid (and survived out-of-sample at 3.67) but the double top failed against the bull run. Real charts, real numbers, and the one regime rule that decides it.
 Technical Analysis
 The head and shoulders chart pattern, tested across eight years of gold, Bitcoin and EUR/USD. The raw pattern is a coin flip. Add three confirmations, volume, the 200-EMA regime and RSI at the head, and the same pattern turns into a 70-plus percent method. Real trades, real numbers, the rules you can copy.
Apply these technical analysis on prop firm capital: $25K to $200K accounts, no personal risk. Compare the firms that actually pay out.