Market profile trading is a method of reading price action through time-price opportunity (TPO) charts, which show where price spent the most time during a session. Unlike candlestick charts, market profile reveals institutional value: the price range the market accepted and the extremes it rejected. Traders use it to identify entry zones near value area boundaries and spot potential trend days before they develop.
Most traders who first see a TPO chart assume it is complicated. It looks like a sideways histogram built out of letters. After eight years watching institutional flow on a dealing desk, I can tell you it is one of the cleaner reads of where smart money is active. Once you understand what the letters represent.
Market profile was developed by Peter Steidlmayer at the Chicago Board of Trade in the 1980s. Pit traders used it to understand where the market was building consensus or failing to. The logic transfers directly to forex, futures, and equity index trading.
How Market Profile Works
Each letter on a TPO chart represents a 30-minute time period. The first 30 minutes of a session is labeled “A”, the second is “B”, and so on through the trading day. Each time price trades at a given price level during that window, a letter is placed there.
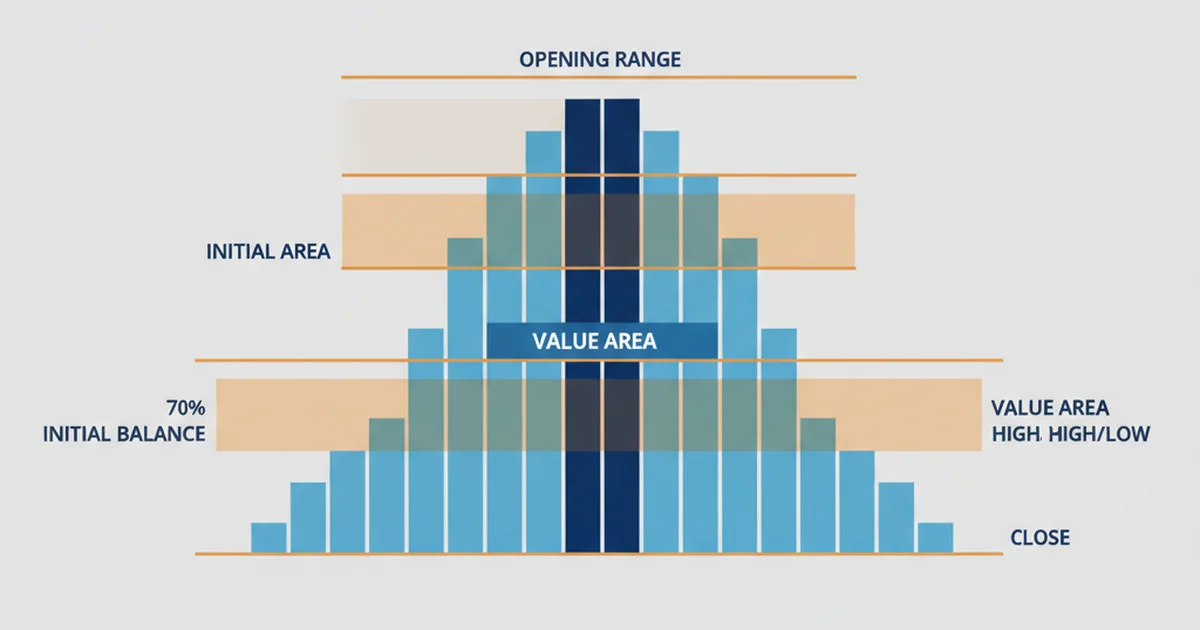
The result is a distribution. Price levels that attracted the most time appear wide. Levels visited briefly appear narrow. This creates a visual map of where the market found agreement and where it rejected price.
The distribution gives you four things to work with:
- Initial Balance (IB): the price range formed in the first hour (A and B periods). Think of this as the market establishing its opening range.
- Point of Control (POC): the price level with the most TPO letters, where price spent the most time. This is the fairest price according to the session.
- Value Area (VA): the price range containing 70% of the day’s TPOs. Roughly one standard deviation of accepted price.
- Value Area High (VAH) and Value Area Low (VAL): the upper and lower boundaries of the value area.
Reading the Distribution Shape
The shape of the TPO chart tells you what kind of session is forming before you place a trade.
A balanced day forms a classic bell curve. Price moved in both directions, found acceptance in the middle, and rejected the extremes. These days tend to resolve with range-bound trading; fades work better than breakouts.
A trend day looks like a letter D tilted sideways. TPOs stack on one side as price moves directionally all session. The initial balance is typically narrow, then extends far in one direction. I’ve watched days on EUR/USD where the IB was 12 pips and the full session range reached 80.
A non-trend day produces two or more mini-distributions separated by a gap in TPOs. Price tried two value areas and found no consensus. These days have low conviction. Reduce position sizing.
Identifying the day type by 10:00 AM sets up the entire session’s strategy.
Market Profile vs Volume Profile
These two tools are related but answer different questions.
| Market Profile | Volume Profile | |
|---|---|---|
| Measures | Time at price | Volume traded at price |
| Chart type | TPO letters | Horizontal bars |
| Key level | POC (most time) | POC (most volume) |
| Best for | Day structure, session timing | Supply and demand zones |
| Platform | TradingView (paid), Sierra Chart | TradingView (free) |
| Origin | CBOT pit trading, 1980s | CME electronic data, 1990s+ |
Both highlight POC and value areas. Volume profile is more accessible. TradingView includes it on free plans. Market profile requires a paid plan or a dedicated platform like Sierra Chart.
If you’re choosing between the two, volume profile trading is the easier starting point. The concepts overlap enough that learning volume profile first makes the TPO chart significantly easier to read.
Market Profile Trading Strategies
Value Area Fade
The most consistent market profile setup in practice: if the next day opens outside the prior day’s value area, there’s a 70–80% historical probability that price returns to the value area within that session.
If price opens below the prior day’s VAL, look for long entries targeting VAL then POC. If price opens above the prior day’s VAH, look for short entries targeting VAH then POC.
Stop goes beyond the overnight extreme (the point furthest outside the value area). Target is the opposite boundary of the prior day’s value area.
I’ve been running this on EUR/USD for the past year. When the setup triggers in low-volatility sessions (not news days, not NFP week), the win rate holds around 60% with roughly 1.5:1 reward-to-risk. On news days, the value area structure gets destroyed by the initial move, and the setup fails consistently. Most market profile tutorials do not mention this clearly enough.
Initial Balance Breakout
When price breaks above the IB high or below the IB low, it signals potential trend day conditions. The IB establishes the opening range that both buyers and sellers accepted. A sustained break means one side has taken control.
Entry: 30-minute close above the IB high (long) or below the IB low (short). Stop: back inside the IB, 5–10 pips from the breakout point. Target: 1× the IB range projected from the breakout level.
This setup works best when the initial balance is narrow. A tight IB (under 15 pips on EUR/USD or under $3 on XAU/USD) suggests indecision — when it breaks, the move tends to extend. When the IB is already wide, less energy is behind any breakout.
Single Print Levels
Single prints are TPO levels where only one letter appears. Price moved through these zones quickly without establishing value, similar to an unfilled gap on a candlestick chart.
When price returns to a single print area, it either accepts value there or rejects sharply. These zones make tight-stop entry areas. The support and resistance logic applies: single prints are imbalances not yet resolved by the market.
Setting Up Market Profile on TradingView
TradingView includes a built-in Market Profile indicator. Open the Indicators panel and search for “Market Profile” and you’ll find both official and community versions.
Recommended starting settings:
- Period: Daily (each session shown as a separate distribution)
- Value Area: 70% (industry standard)
- TPO size: 30 minutes (original Steidlmayer specification)
- Show POC line: enabled (makes the fairest price visible at a glance)
For legible TPO letters, use a 30-minute chart and zoom into individual sessions. The full distribution becomes readable at that resolution. On daily charts, the letters compress into bars and lose the detail.
Sierra Chart is the professional-grade tool used by institutional traders and provides more precise market profile analytics, but it requires a paid subscription and has a steeper learning curve. For learning the framework, TradingView’s free indicator is sufficient.
What Market Profile Cannot Do
Market profile shows where the market has been and what prices it accepted. It does not predict where price will go.
A common beginner mistake: treating the POC as a price magnet. In consolidating sessions, price does gravitate toward POC. But on trend days, price moves away from the prior POC and builds entirely new value. The day type determines whether POC acts as a magnet or a starting point left behind.
Market profile also works poorly on very short timeframes. On 1-minute charts, the distributions are too narrow to show meaningful structure. Day trading strategies built on market profile require at least 30-minute resolution (the original TPO period) with the daily structure as your reference frame.
Common Mistakes to Avoid
- Applying value area fades on trend days: the setup depends on mean reversion. True trend days don’t mean-revert. Use the day-type identification step every morning.
- Trading through news events: major economic releases destroy the initial balance structure. The IB formed during high-impact news is often not representative. Filter these or wait 30 minutes after the release.
- Acting on every single print: not all thin TPO levels are tradeable. High-probability setups occur when single prints align with prior day POC or VA boundaries.
- Changing the value area percentage: the 70% standard is universal across professional market profile implementations. Adjusting it removes the ability to compare sessions or follow institutional reference points.
FAQ
What is market profile trading?
What is the difference between market profile and volume profile?
How do you read a TPO chart?
Does market profile work for forex trading?
What is the best platform for market profile?
How accurate is the value area fade setup?
Reader Reviews
I trade EUR/USD futures on CME and had been using volume profile exclusively for two years. The value area fade setup described here is one I knew conceptually but had not backtested with the specificity this article gives. The 70-80% historical return-to-value stat is something I verified against my own trade journal, and my results over 90 sessions averaged closer to 62% after filtering news days as the article recommends. The initial balance breakout criteria, specifically the 30-minute close above IB high rather than a simple touch, is a detail most resources omit. My win rate on IB breakouts improved after adding the close confirmation.
The comparison table between market profile and volume profile is the clearest I have seen. I had been confusing the two tools for months and using them interchangeably on TradingView. Understanding that market profile measures time while volume profile measures contracts traded at each price clarified why they sometimes diverge at key levels. The note that volume profile is on TradingView free while market profile needs a paid plan also saved me from upgrading unnecessarily.
The TradingView setup section is practical. The recommendation to use 30-minute TPO size matching the original Steidlmayer specification is something I had changed without knowing the reason. Restored it and the distributions started making more sense.
I teach a day trading course for retail traders and the section on day type identification is what I reference most. The distinction between balanced, trend, and non-trend days is often taught in the abstract, but the visual description here, specifically the D-shape tilted sideways for trend days versus the bell curve for balanced sessions, gives students something concrete to look for before 10 AM. The advice to reduce position sizing on non-trend days because of split distributions is risk management that most introductory market profile content skips entirely. I assigned this article as required reading for the module.
The section on single print levels filled a gap in my understanding. I knew to mark areas where only one letter appeared but did not have a systematic way to trade them. The framing that single prints are imbalances not yet resolved, similar to an unfilled gap on a candlestick chart, gave me the conceptual model I needed. I started treating them as two-way setups rather than one-directional and stopped getting caught on the wrong side.
The warning about news events destroying the initial balance structure is the most practically useful note in the article. I spent three months getting stopped out on IB breakout setups during high-impact release windows before understanding that the IB formed during news is not representative of session structure. Filtering NFP week and ECB decision days from my IB breakout signals cut my losing streaks significantly. My monthly results over the following quarter averaged around 7.3% gain on a smaller position size, which was better than the prior approach with larger size and less filtering.
The point about the POC acting as a magnet only on consolidating sessions, not on trend days, is one I wish I had understood earlier. I was treating the POC as always relevant regardless of day type and it cost me on several trend days.
The forex-specific note about using the New York session as the reference frame is important and underemphasized in most tutorials. Because forex has no central exchange, the session definition matters more than in futures. I had been using 24-hour distributions on EUR/USD which produced value areas so wide they were useless for intraday trading. Switching to NY session only produced tighter value areas with more actionable VAH and VAL levels.
Leave a Review

Forex Analyst & Senior Trader
Former FX desk trader with 8 years in institutional forex. Works in multi-timeframe analysis and order flow, turning desk experience into systematic, testable rules across forex and metals.