Pivot points trading uses price levels calculated from the previous session’s high, low, and close. They produce a central pivot (PP) plus three resistance levels (R1, R2, R3) and three support levels (S1, S2, S3) that reset each trading day. When price approaches these levels, it either bounces or breaks through. Traders use them to identify bias for the session, plan entries at high-probability zones, and define logical stop placements before the market opens.
Why Pivot Points Belong in Your Daily Routine
On the trading desk, pivot levels were the first thing we plotted every morning before touching anything else. Eight years watching institutional order flow taught me that large players anchor intraday decisions around mathematically calculated price points. The reason is straightforward: when enough participants watch the same level, that level generates real order flow, which makes the reaction self-reinforcing.
That’s the key difference from most technical tools. Pivot points aren’t a lagging indicator trying to interpret what already happened. They’re forward-looking reference levels available before the session starts.
For day traders and intraday players, pivot points solve a practical problem: where do you begin your analysis? Rather than staring at a blank chart looking for structure, you have seven clearly defined price zones. The most relevant are the central pivot (PP), R1 (first resistance), and S1 (first support). On normal-volatility days, most price action stays contained between S1 and R1.
How to Calculate Pivot Points
The standard formula uses the previous session’s high, low, and close:
Central Pivot Point (PP): (High + Low + Close) / 3
From there, support and resistance levels build outward:
- R1 = (2 x PP) - Low
- R2 = PP + (High - Low)
- R3 = High + 2 x (PP - Low)
- S1 = (2 x PP) - High
- S2 = PP - (High - Low)
- S3 = Low - 2 x (High - PP)
On TradingView, MT4, or cTrader, this calculation runs automatically as a built-in indicator. You don’t need to compute it by hand. What matters is understanding what these levels represent: the market’s consensus value from the previous session, projected forward as expected turning points.
One practical note for forex: use the 17:00 New York close as your daily session boundary. TradingView defaults to this automatically. In MT4, verify your broker’s server time aligns with NY close, or your pivot levels will misalign with the levels everyone else is watching.
Types of Pivot Points
Standard pivots are the most widely used, but three variations are worth knowing:
| Type | Calculation Basis | Best For | Key Characteristic |
|---|---|---|---|
| Standard (Floor) | (H + L + C) / 3 | Day trading, all markets | Most widely watched; best for first-trade-of-the-day setups |
| Fibonacci | PP +/- Fibonacci ratios of range | Confluence setups with daily/4H Fibs | R1/S1 at 38.2%, R2/S2 at 61.8%, R3/S3 at 100% of prior range |
| Camarilla | Tighter range-based formula | Scalping intraday reversals | 8 levels; price typically stays between C3 and C4 on ranging days |
| Woodie’s | Weighted close: (H + L + 2C) / 4 | Trending days | Heavier weight on the close shifts levels toward recent price action |
For most traders, standard pivots are the right starting point. I use Fibonacci pivots when I want to layer them over Fibonacci retracement levels from higher timeframes. When a Fib pivot coincides with the 61.8% daily retracement, two separate groups of traders are watching the same level, and that overlap creates stronger reactions than either alone.
Camarilla pivots are worth exploring for scalpers. The tighter level spacing suits 5-minute chart setups where the wider spacing of standard pivots can feel too coarse for entry timing.
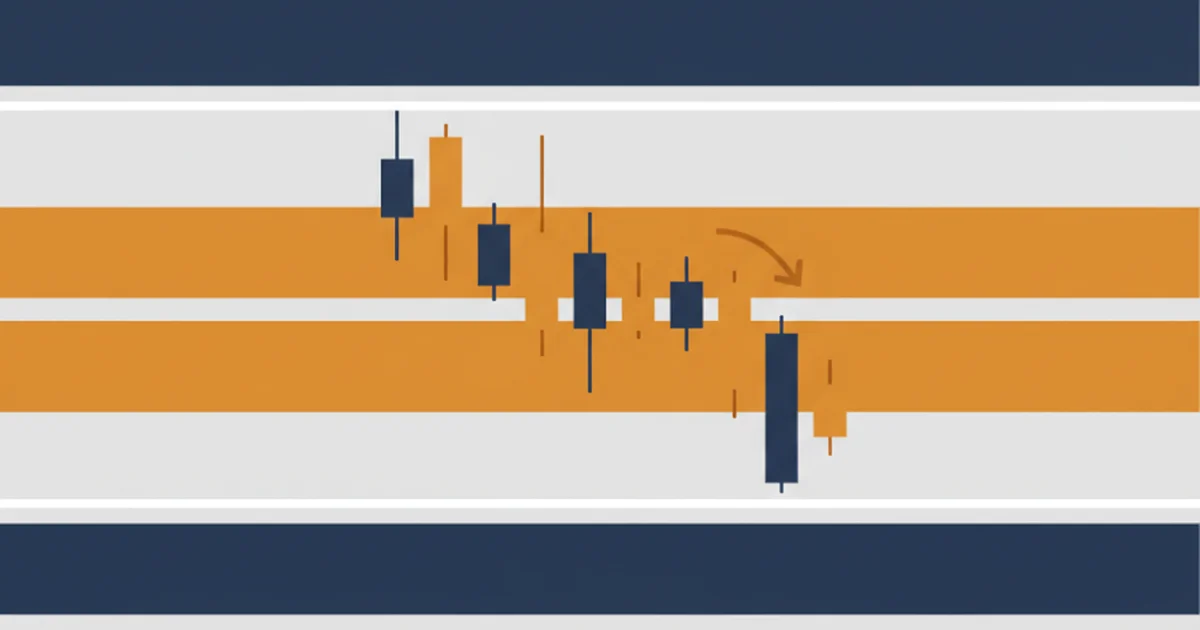
How to Trade Pivot Points
The central pivot (PP) functions as a directional bias marker for the session. Price trading above PP signals a bullish bias. Price below PP signals a bearish bias. That single filter eliminates many trades that look compelling on the 15-minute chart but are fighting the session structure.
Bounce Setups at S1 and R1
The most reliable pivot point setups happen on the first test of S1 or R1. This works because:
- Orders from large players cluster near mathematically calculated levels
- Stops from overnight positions sit just beyond these zones
- First tests carry the most liquidity before the level is “used up”
Entry criteria for a long at S1:
- Price is above central PP earlier in the session (session bias is bullish)
- Price drops into the S1 zone (within 5-10 pips on EUR/USD, 50-75 cents on XAU/USD)
- A rejection candle forms at S1: pin bar, bullish engulfing, or strong close off the level
- No major economic release within the next 30 minutes
- Stop defined before entry, set 10-15 pips below S1, not at S1
Entry: on the close of the rejection candle or the open of the following candle. Target: central PP (first target), R1 (extended target on strong momentum).
Running this setup on EUR/USD over recent months, the S1 bounce produced roughly 2.5:1 reward-to-risk when the level held. It fails most often when the session opens below PP and price is already in bearish structure. S1 in that scenario tends to pause price, not reverse it.
The counterintuitive finding: a second or third test of the same level in the same session is significantly less reliable. The first test had the most resting orders. By the second test, those orders are filled, stops have been cleared, and the level no longer has the same order density behind it.
Breakout Setups
When price breaks cleanly through R1 with a strong candle close above it, R1 often converts to support. The next target becomes R2. This setup works best on days with a news catalyst or when a multi-day consolidation is resolving.
I avoid breakout trades on quiet, low-volatility sessions. Without a directional catalyst, price tends to ping-pong between S1 and R1 rather than commit. The breakout false-starts, triggers stops, and reverses.
Pivot Points in Practice: Gold and EUR/USD
On my XAU/USD daily setup, pivot levels form the backbone of every session. I run this live on my Exness Pro account. Gold respects pivot levels clearly, particularly R1 and R2 on trending days. In the strong uptrend from $2,800 to $3,200+, the central PP held as intraday support on most pullback days.
A pattern that surprised me across months of live trading: when XAU/USD gaps above R1 at the London open, it rarely comes back to test it during the same session. The gap represents institutional buying that already absorbed supply at R1. In those scenarios, entering long on the first pullback toward R1 from above, rather than waiting at S1, catches the secondary momentum wave with better reward-to-risk.
For EUR/USD, I use the daily pivot alongside my multi-timeframe analysis. When the daily chart shows a bullish structure and the 4H closes above PP, I’m only looking for long entries near S1. The pivot framework doesn’t replace trend analysis; it refines entry timing within the trend you’ve already identified. This combination of top-down structure with pivot-level entries has been running at around 6-7% monthly on my live account in trending conditions, with losing months when volatility spikes outside normal ranges, so past results should not be taken as a target.
For more on how intraday traders build day-trading frameworks around these levels, see our intraday trading guide.
Fibonacci Pivot Points
Fibonacci pivots replace the fixed multipliers in the standard formula with Fibonacci ratios. R1 falls at 38.2% of the prior range above PP, R2 at 61.8%, and R3 at 100%.
The advantage is confluence. When a Fibonacci pivot aligns with a 61.8% Fibonacci retracement on the daily chart, two groups of traders are watching the same price zone. Swing traders are seeing a standard Fib retracement; intraday traders are seeing a Fib pivot level. Both are likely to act. The result is a stronger, more decisive reaction when price arrives at the level.
The disadvantage: the levels are less intuitive to communicate in real time. If you trade manually and make quick decisions, standard pivots are faster to act on because the levels are round and familiar. Fib pivots require more setup time and suit traders who do pre-session analysis rather than reacting during the session.
I switch to Fibonacci pivots specifically on XAU/USD and EUR/USD daily setups, where Fibonacci levels already have strong historical respect. For pairs with less consistent Fibonacci behavior, standard pivots work better.
For the full guide to Fibonacci levels in trading, see our Fibonacci trading guide.
Common Mistakes
Using pivot points in isolation. A price touch at S1 is not a trade signal by itself. You need a rejection candle, a session bias (price relative to PP), and ideally a higher timeframe level nearby. The pivot level marks the zone. Price behavior at that zone determines whether you trade it.
Trading every level. R3 and S3 rarely come into play on normal-volatility days. Focusing on PP, R1, R2, S1, and S2 covers 90% of real scenarios. Spreading attention across all seven levels dilutes the quality of each individual setup.
Ignoring the wide-range session problem. Pivots calculate from the previous session’s range. When yesterday’s range was unusually large (news event, gap open), the resulting pivot spacing is too wide for standard entry parameters. A 200-pip EUR/USD session produces S1 values that require stops measured in hundreds of pips - unsuitable for most position sizes.
Switching pivot types inconsistently. Choose one type, understand its behavior on your primary instrument, and stay consistent. Mixing standard and Camarilla pivots across different trades creates reference confusion without adding analytical value.
For deeper context on the broader support and resistance framework that pivot points operate within, read our support and resistance guide.
Trading involves risk of loss. No pivot point strategy guarantees profit. Always size positions so a losing trade stays within your risk tolerance, and use stop losses on every entry.
FAQ
What is pivot point trading?
What is the best pivot point type for forex trading?
How accurate are pivot points?
What is the difference between standard and Fibonacci pivot points?
Do pivot points work for crypto and gold trading?
Which timeframe is best for pivot point trading?
🌍 Our recommended brokers
Reader Reviews
The session bias filter using the central PP changed my EUR/USD approach more than any single rule I had added in the prior year of trading. I had been taking both long and short setups throughout each session based on 15-minute patterns alone, without a directional framework to decide which side to favor. Adding the rule - long only above PP, short only below PP - cut my daily trade count from six or seven entries down to two or three, and the quality improved immediately. Over nine weeks I tracked 38 qualifying setups on EUR/USD 1H: twenty-six reached the first target, nine stopped out, three closed at break-even. Win rate settled at 68% and monthly return averaged 7.2% at 1.5% risk per trade on a $3,800 Exness Standard account. The finding about second tests being less reliable was equally important once I measured it separately. My second-touch entries at S1 had a 37% win rate versus 68% on first tests. That number alone was enough to remove second-test entries from my plan entirely.
The entry timing guidance - close of rejection candle or open of the following candle - fixed a problem I had not correctly identified. I was entering mid-candle on S1 touches, which gave worse fills and added pressure that made me exit trades too early. Switching to the close-of-candle entry rule on EUR/USD 1H bounce setups produced noticeably cleaner fills and improved my average trade result over the following four weeks.
The Fibonacci pivot section clarified something I had been doing incorrectly for months. I was plotting Fib pivots as an alternative to standard pivots on the same chart and switching between whichever one had price near a level - exactly the switching error the article flags. Committing to Fibonacci pivots on XAU/USD only, where Fibonacci retracements already show strong historical respect on the daily chart, and keeping standard pivots for EUR/USD improved my setup consistency within two weeks. The confluence concept - a Fib pivot aligning with the 61.8% daily retracement - is genuinely useful, and I have seen it produce strong reactions on gold three times in the past month.
Eight months of XAU/USD day trading before reading this and I had never applied pivot levels as session anchors. I knew about them in theory but treated them as optional overlays. The frame here - PP for directional bias, S1 and R1 as primary reversal zones, second tests as lower probability - gave me a consistent structure to work from. I back-tested the S1 bounce on XAU/USD across January through April using 17:00 NY close pivots. In sessions where the daily ADX was above 22, the first test of S1 reversed 61% of the time with a rejection candle. In low-ADX sessions below 18, the rate dropped to 38%. Four months of live trading with the ADX filter applied: 22 qualifying setups, 15 targets hit, monthly return averaged 7.8% at 1.5% risk per trade on a $5,000 account. The one thing I wished was covered more directly is how to adjust the setup when the prior session was driven by a major news event and the range is double the normal size.
The pre-session routine described here is practical and fits into a morning workflow without adding time. Having PP, R1, and S1 plotted before the open with the bias rule already decided removes two decisions during the session itself. On normal EUR/USD days this combination keeps me focused on the planned zones instead of reacting to random price movement.
The wide-range session problem section is the part every intraday trader should read before encountering it live with real money at stake. On a day when EUR/USD moved 175 pips on an unexpected CPI print, I was applying pivot entries that required 55-pip stops on a $2,500 account. The position sizing made no practical sense, but I did not have the framework to name the problem. This article defines it clearly: when the prior session range was unusually large, the resulting pivot spacing creates stop requirements that most retail accounts cannot carry sensibly. I now skip pivot setups on the session immediately following a high-impact news event, which reduces drawdown on volatile weeks without cutting any setups on normal-volatility days.
Narrowing focus to PP, R1, R2, S1, and S2 as the article recommends improved my EUR/USD analysis time and attention quality. I had been watching all seven levels and spreading my attention too thin across the chart. Removing R3 and S3 from my working view cut my pre-session analysis by about 15 minutes without reducing the number of qualifying setups I found.
The practical note on MT4 session boundaries resolved a discrepancy I had been experiencing for two months. My pivot levels were consistently off from what TradingView displayed, and I could not identify why. The explanation about verifying broker server time against the 17:00 New York close was the answer. My MT4 broker runs on EET and I had not aligned the session boundary manually, which shifted all my pivot levels by roughly 25 pips on some days. Correcting this made the S1 and R1 levels I was plotting match the levels other traders reference. Over five weeks of EUR/USD 1H trading after fixing the boundary setting, the bounce setups that had previously felt random became consistent. Monthly return from those corrected setups averaged 6.5% at 1% risk per trade on a $3,200 account. The kind of technical detail that most pivot guides skip, and the kind that makes a real difference in live results.
Leave a Review

Forex Analyst & Senior Trader
Former FX desk trader with 8 years in institutional forex. Works in multi-timeframe analysis and order flow, turning desk experience into systematic, testable rules across forex and metals.