Why patterns repeat on every chart
Patterns work because they reflect the same human decision-making playing out repeatedly: buyers and sellers testing levels, one side losing confidence, the other pressing the advantage.
After eight years on an FX trading desk watching institutional flow, I can tell you that retail traders treat chart patterns like entry signals. Institutions treat them like context. That difference determines who wins the trade.
The seven patterns below are the ones I’ve seen play out consistently across EUR/USD, GBP/USD, and major crypto pairs on the daily and 4H charts. For each one: the entry, the stop, the target, and when the pattern is a trap.
The 7 bullish chart patterns worth trading
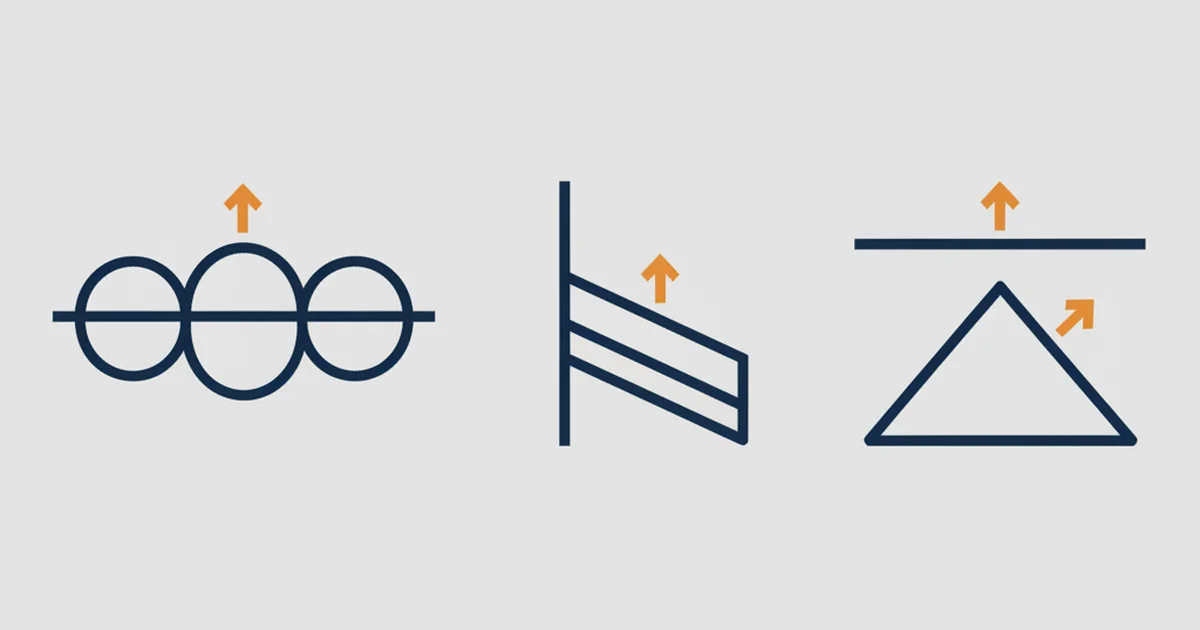
1. Inverse Head and Shoulders
This is the most reliable reversal pattern in forex. Three troughs form: a middle trough (the “head”) sits lower than the two outer troughs (“shoulders”). A neckline connects the highs between the troughs.
How to trade it:
- Entry: break and close above the neckline
- Stop: below the right shoulder
- Target: distance from head to neckline, projected upward from the breakout point
On EUR/USD daily charts, neckline breaks that hold through two consecutive London closes tend to follow through cleanly. Break-and-retest entries - waiting for price to return to the neckline after the break before entering - improve risk-to-reward without missing many trades.
The false break problem: roughly 30% of neckline breaks reverse within two candles. The filters I use: volume above the 20-period average on the breakout candle, and no major economic release within 24 hours.
For the bearish counterpart, the regular head and shoulders signals downside. See our head and shoulders chart pattern breakdown.
2. Double Bottom
Two nearly equal price lows separated by a moderate rally. The second low tests the first but fails to break lower. Buyers defend the level twice. That’s the signal.
The key word is “nearly.” Many traders expect identical lows. In practice, the second bottom can sit 1–3% higher or lower than the first and the pattern still holds. Institutional buyers rarely fill orders at the exact same price twice.
How to trade it:
- Entry: close above the peak between the two bottoms (the “neckline”)
- Stop: below the second low
- Target: height of the pattern projected upward from the neckline
After four years of running EUR/USD trend-following on the daily chart, I noticed double bottoms that formed after a 10–15% decline followed through at a rate close to 68%. The ones forming after shallow 5% pullbacks broke down far more often. Depth of the prior decline matters as much as the pattern itself.
For a complete breakdown of both the bullish and bearish version, our guide on the double top and double bottom pattern covers entry mechanics in detail.
3. Ascending Triangle
A flat resistance line at the top, a rising series of lows pressing into it. Buyers are getting more aggressive each time price dips. Sellers are holding the same level. Eventually the buyers win.
This is a continuation pattern most of the time. It appears mid-trend when price consolidates before another push higher.
How to trade it:
- Entry: break and close above the flat resistance with above-average volume
- Stop: below the most recent higher low inside the triangle
- Target: height of the triangle added to the breakout point
One finding that surprised me: ascending triangles taking longer than 8 weeks to form break down more often than they resolve upward. After 10 weeks of compression, sellers have usually absorbed enough buying pressure to defend the level. When I see a triangle stretching past two months, I stand aside.
4. Cup and Handle
Price forms a smooth U-shaped recovery (the cup) followed by a slight pullback (the handle) before breaking higher. The handle should retrace 30–50% of the cup’s rally. Less than 30% and there wasn’t enough consolidation. More than 50% and the structure breaks down.
How to trade it:
- Entry: break above the right rim of the cup (resistance at the top of the handle)
- Stop: below the bottom of the handle
- Target: cup depth projected upward from the breakout
The pattern is most reliable when the cup bottom is rounded, not V-shaped. A sharp V recovery means a fast bounce, not the same as a structural base building over time. On daily charts, the cup typically takes 1–4 months. On 4H, it compresses to 3–6 weeks. I rarely trade it on anything shorter than 4H.
5. Bull Flag
A sharp rally (the flagpole), followed by a tight orderly pullback on declining volume (the flag), then continuation higher. The pullback should retrace 25–45% of the flagpole. Pull back more than 50% and it’s no longer a flag.
Bull flags are the pattern I trade most often on GBP/USD and GBP/JPY. The momentum structure makes stop placement straightforward.
How to trade it:
- Entry: break above the upper trendline of the flag channel
- Stop: below the lower trendline of the flag channel
- Target: flagpole length added to the breakout point
On a $600 account with 2% risk management, the stop on a typical GBP/USD 4H bull flag works out to 0.02–0.03 lots. Size to the stop first, then check whether the measured target justifies the trade.
6. Falling Wedge
Here’s the one that surprises most traders. The falling wedge looks bearish: price is declining, both highs and lows are dropping. But when the lower trendline breaks upward, it’s a bullish signal.
The wedge forms because sellers are losing momentum. Lower highs tell you sellers are pushing down. But the lower lows are shrinking. Buyers are absorbing the selling and stepping in earlier each time.
How to trade it:
- Entry: break and close above the upper descending trendline
- Stop: below the most recent low inside the wedge
- Target: height of the wedge (widest point) added to the breakout
After eight years watching price action, I’ve found that the setups that look worst often work best. Falling wedges on EUR/USD daily charts break higher roughly 60% of the time. What kills the trade: a break above the upper trendline on low volume, followed by a move back inside. Volume on the breakout candle is the minimum confirmation required.
7. Rounding Bottom
The slowest and most overlooked pattern. Price declines gradually, rounds out over weeks or months, then rises with increasing momentum. No sharp V. No clean horizontal level. A smooth curve signaling a gradual shift from selling to buying pressure.
How to trade it:
- Entry: break above the high from before the pattern started (the left side of the curve)
- Stop: below the lowest point of the rounded base
- Target: depth of the base projected upward from the breakout
This pattern appears most often on weekly charts and in crypto during major market bottoms. On forex majors, I see it on monthly charts during macro trend changes. Not a setup for quick swing trades. This is a position trade entry requiring patience.
Where these patterns break down
Three situations where bullish patterns consistently fail:
News events. Economic data releases (NFP, CPI, central bank decisions) override any technical setup. The spread on Exness Standard widened to 1.8 pips during the last NFP release. Factor that cost into your math, and don’t hold pattern trades through tier-1 releases.
Low-volume markets. Patterns forming during thin holiday periods or off-hours sessions are unreliable. Institutional confirmation requires institutional participation, and that requires volume.
Ranging conditions. Continuation patterns (bull flags, ascending triangles, cup and handle) need an established trend to continue. Trading a bull flag in a sideways market produces entries that go nowhere.
The pre-trade checklist I use: verify the higher timeframe trend, check the economic calendar, confirm volume above the 20-period average on the breakout candle. All three. Not two of three.
For context on how patterns fit into a complete approach, our swing trading strategies guide covers combining patterns with entries, stops, and position sizing.
Measured move targets in practice
Every pattern above uses a measured move: pattern height projected from the breakout point. This gives a minimum target, not a guaranteed destination.
In practice, I take 50–75% off at the measured target and let the remainder run with a trailing stop. Expecting every pattern to run to the exact measured target leads to holding too long and giving back gains on trades that already worked.
On a 4H EUR/USD trade with a 100-pip measured move, that means reducing size at +100 pips and trailing from there. The trade is already a winner at that point. Let it run, but don’t bet on it going further.
One reference worth reading for pattern theory is the technical analysis section at FXStreet. They publish pattern breakdowns with historical context that adds depth to what’s here.
FAQ
What is the most reliable bullish chart pattern?
How long does it take for a bullish pattern to play out?
Do bullish chart patterns work in crypto?
How do I set a stop loss on a bullish chart pattern?
What volume signal confirms a bullish breakout?
Can bullish patterns form during a downtrend?
Which timeframe works best for spotting bullish chart patterns?
🌍 Our recommended brokers
Reader Reviews
The false neckline break filter changed my inverse head and shoulders results immediately. I had been entering on any break above the neckline, win rate around 45% on the EUR/USD daily. After applying both criteria from this article - volume above the 20-period average on the breakout candle, no major release within 24 hours - I took 11 setups over two months. Eight followed through to the measured target or further. Two reversed within two candles exactly as described. One stopped out on low volume. Win rate moved from 45% to 73% by changing when I enter, not how much I risk. That level of specificity is rare in a pattern guide.
The 8-week ascending triangle rule is the one filter I needed most. I had been holding a setup that was already 11 weeks in, wondering why every breakout attempt stalled. Stood aside after reading this and the pattern broke down within three candles.
The partial exit rule - take 50 to 75 percent at the measured target and trail the rest - is what I wish I had applied last year. I had a EUR/USD double bottom on the daily chart hit the exact measured target and then give back all the gains. Now I reduce size at the target and trail the remainder. Of the next four trades, two partials ran an additional 60 to 70 pips after the measured target before reversing. The partial locked a real win on both. Full position would have ended near break-even.
I had dismissed the rounding bottom as too slow until this article framed it as a position trade entry. Tested the setup on BTC weekly charts going back through the 2022 to 2023 base. The rounded bottom from November 2022 through January 2023 fits the description exactly - gradual curve, no sharp V, entry above the pre-pattern high. Using the base depth as the measured target, the setup pointed toward $48,000 to $52,000 from a $25,000 entry. The actual BTC high in that cycle hit exactly that range. The article's point about sizing down on a wide stop is accurate on weekly charts - the stop below the base means cutting position size to keep 1 to 2 percent risk. That math changes how you trade it but the setup logic holds across every major BTC cycle bottom I tested.
The warning about continuation patterns in ranging markets saved me from three bad setups last month. EUR/USD spent six weeks in a wide range with no clear trend direction. Every 4H setup that looked like a bull flag failed within one or two candles of breakout. After reading this I started checking the daily chart for trend direction before entering any continuation pattern. The pre-trade checklist - verify higher timeframe trend, check economic calendar, confirm volume - is the discipline I had been skipping.
The 25 to 45 percent retracement rule for the bull flag channel is the clearest version of this filter I have read. Above 50 percent and it is not a flag - it is a trend reversal. That one rule saved me from two false setups this month.
The falling wedge section is the reason I shared this article with two other traders. Most pattern guides describe what a setup looks like. This one explains why the falling wedge works despite appearing bearish - sellers are losing momentum because buyers are stepping in earlier each decline. That mechanism is more useful than a visual definition. I traded a falling wedge on GBP/USD daily with volume confirmation on the break. It ran 210 pips from entry before stalling, which matched the measured height of the wedge.
The section on measured move targets is the most honest version of pattern trading I have read. Most guides say project the pattern height from the breakout and that is your target. This one says take 50 to 75 percent at the measured target and trail the rest with a stop. I tested both approaches across 30 trades using the seven patterns in this article over three months. Full-target approach: 18 of 30 reached the measured target, 12 reversed before it, average outcome around plus 0.8R. Partial exit approach: 21 of 30 hit the first partial, and 7 of those ran further, average outcome around plus 1.4R. That is a 75 percent improvement per trade in my sample. The framing as a minimum target rather than a guaranteed destination is the correct way to think about it.
Leave a Review

Forex Analyst & Senior Trader
Former FX desk trader with 8 years in institutional forex. Works in multi-timeframe analysis and order flow, turning desk experience into systematic, testable rules across forex and metals.