Wave theory was not what I expected when I first encountered it on the desk. My initial instinct was to dismiss it as too abstract for real trading. But on EUR/USD multi-month charts, the structure kept appearing in ways that were hard to ignore — especially how the corrections consistently held at specific Fibonacci retracement levels before the next impulse began.
Elliott Wave Theory maps price action as a series of waves tied to how market mood shifts from pessimism to optimism and back. Price traces predictable patterns through these cycles. Reading those patterns gives you a structural framework that most traders reacting candle-by-candle simply do not have.
What Elliott Wave Theory actually says
R.N. Elliott observed in the 1930s that markets do not move randomly. Price traced recurring patterns tied to investor emotion and crowd behavior. His original work, The Wave Principle, documented these patterns across decades of Dow Jones data. He identified two phases:
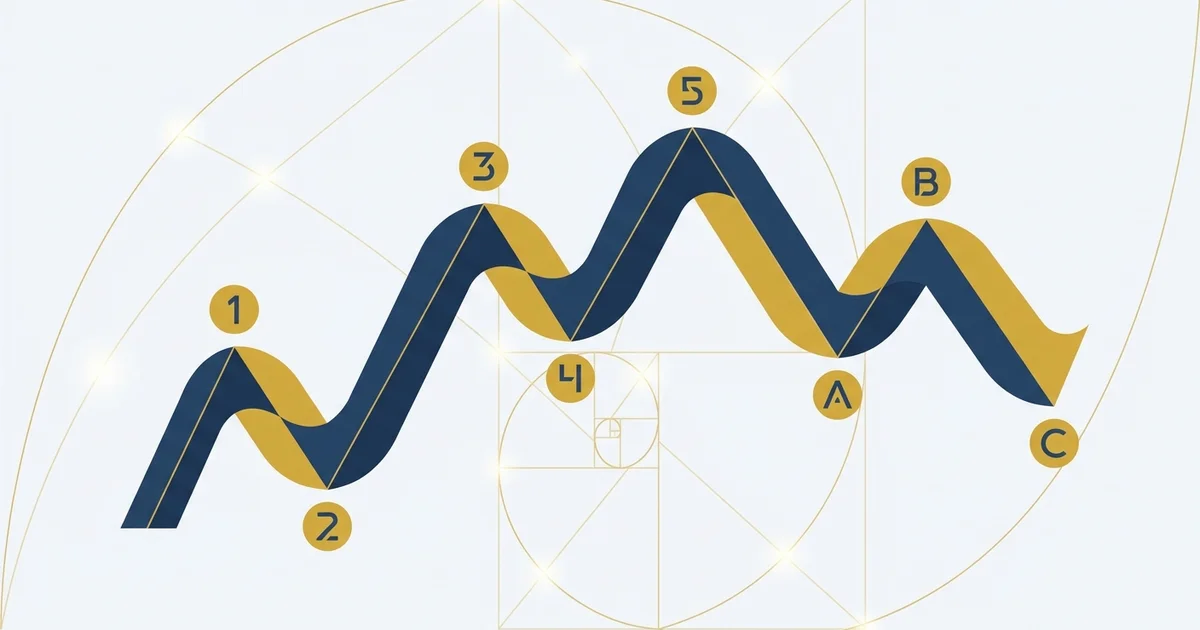
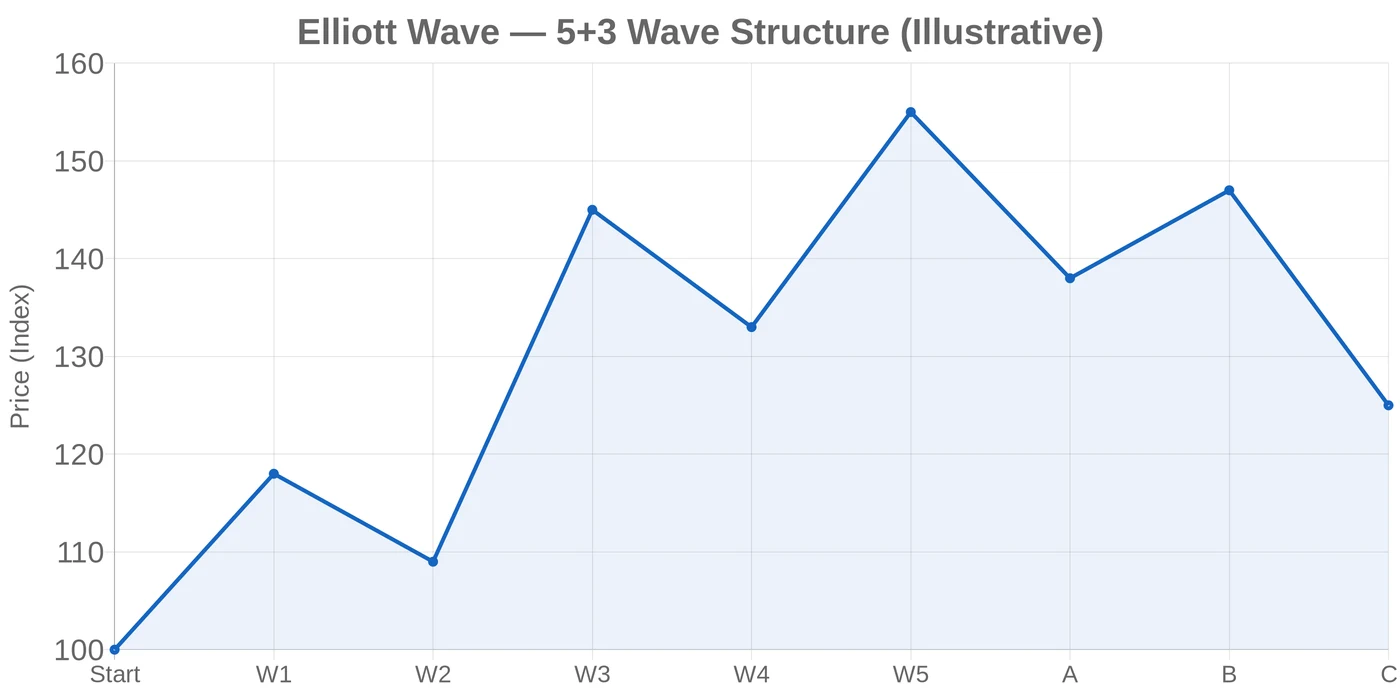
- Motive phase: five waves (1 through 5) moving in the direction of the primary trend
- Corrective phase: three waves (A, B, C) moving against the trend
Together, these eight waves form one complete cycle. Once the cycle completes, a new one begins at the next higher degree. The theory applies at every timeframe — from 5-minute intraday charts to monthly charts spanning decades. This self-similar, fractal quality means each wave at a larger degree contains smaller waves of the same structure inside it.
I use the weekly chart to identify the primary degree (the large cycle), then drop to the daily and 4H charts to find lower-degree waves for actual entries. Starting top-down is the only way to keep the count from becoming noise.
The 5-Wave Motive Structure
In an uptrend, motive waves progress as follows:
- Wave 1: The first leg up, often hard to identify in real time. Volume is moderate and most traders remain bearish from the prior downtrend. This is the weakest motive wave.
- Wave 2: A retracement of wave 1. Can be sharp and deep, but it never fully retraces wave 1 — that would invalidate the count.
- Wave 3: The strongest and typically longest wave. Volume expands, momentum indicators (RSI, MACD) confirm the move, and breakouts happen cleanly. Most trading profits in a trend cycle come from wave 3.
- Wave 4: A correction against wave 3. Generally shallower than wave 2. Wave 4 cannot retrace into wave 1’s price territory, another hard rule.
- Wave 5: The final push in the trend direction. Volume often diverges from price here, a new high forms while momentum indicators print lower highs. That divergence signals the trend is exhausting.
Three rules govern the motive structure and cannot be broken:
- Wave 2 never fully retraces wave 1 (100% retrace invalidates the count)
- Wave 3 is never the shortest of waves 1, 3, and 5
- Wave 4 never overlaps wave 1’s price territory in standard markets
If any of these rules are violated, the wave count is wrong. Recount from a different origin point.
After 8 years watching institutional flow on an FX desk, I can tell you that wave 3 is where position traders commit. Volume surges, breakouts accelerate, and retail traders pile in, often at the point where institutional money is already partially reducing exposure. Identifying that you are in the early stages of wave 3 gives you one of the better risk-reward setups in technical analysis.
The ABC Correction Pattern
- Wave A: The first move against the trend. Many traders buy this pullback, believing the trend is resuming. It is not, this is distribution, not accumulation.
- Wave B: A partial recovery in the original trend direction. This is the trap. It looks like a continuation but is the final counter-trend rally before the correction completes.
- Wave C: The final leg of the correction, usually equal in length to wave A. This is where the ABC structure completes and the next motive cycle can begin.
Two common corrective patterns appear across all timeframes:
- Zigzag: A sharp, deep correction. Wave B retraces less than 61.8% of wave A. The C wave drives to new corrective extremes. Common in wave 2 corrections and after strong trending phases.
- Flat: A sideways, grinding correction. Wave B retraces nearly all of wave A. Wave C matches wave A in length but stays within a range. Common in wave 4 corrections inside longer trends.
Knowing which corrective pattern you are in changes your entry. A zigzag wave C carries more momentum than a flat correction’s C wave, stop placement and position sizing differ accordingly.
Fibonacci Ratios and Elliott Wave
Elliott Wave and Fibonacci ratios are connected at a structural level. Elliott himself documented that wave relationships reflected the same mathematical proportions found in Fibonacci sequences. In practice, Fibonacci levels help you quantify where a wave is likely to end and the next wave likely to begin.
Key ratios by wave position:
| Wave | Typical Fibonacci Relationship |
|---|---|
| Wave 2 | Retraces 50% or 61.8% of wave 1 |
| Wave 3 | Extends 161.8% of wave 1 (sometimes 261.8%) |
| Wave 4 | Retraces 38.2% of wave 3 |
| Wave 5 | Often equals wave 1, or 61.8% of waves 1 to 3 combined |
| Wave C | Often equals wave A in price distance |
You identify these levels by drawing a Fibonacci retracement tool across the prior wave. When a Fibonacci level coincides with a wave boundary AND momentum confirms a reversal signal, the confidence in the setup rises meaningfully.
For a deeper look at how Fibonacci retracements and extensions work in price analysis, see our Fibonacci trading guide.
One thing Fibonacci does not guarantee: wave 3 will hit exactly 161.8% of wave 1. It often does, but sometimes extends to 261.8% or stops at 127.2%. Treat Fibonacci levels as high-probability reversal zones, not fixed price targets. The wave count tells you what phase you are in; Fibonacci tells you where that phase is likely to end.
How to Count Elliott Waves in Practice
The rules are simple. Applying them to live charts is where traders struggle, because ambiguous price action allows multiple valid interpretations. The workflow I use across EUR/USD, GBP/JPY, and XAU/USD:
Step 1. Start on the highest timeframe. Open the weekly chart. Look for the clearest, most dominant price swings. Count the obvious impulses before zooming in.
Step 2. Label the primary swings. Mark the largest peaks and troughs as wave numbers 1 through 5. Apply the three hard rules. If any rule is violated, start over.
Step 3. Drop to the daily chart. Look for the sub-waves inside the primary waves you identified on the weekly. Each major wave at weekly degree contains a five-wave structure at daily degree inside it.
Step 4. Use the 4H for entries. Once you have confirmed which wave you are in at daily degree, the 4H chart shows the lower-degree structure. If the daily chart shows you are in wave 3, the 4H chart should show an early motive structure starting, that is your entry signal.
Over the past two years on EUR/USD, applying this top-down framework has produced a win rate around 65% on wave 3 entries confirmed by daily momentum alignment. I run these on my own trading account, with 1% risk per trade and a stop placed just below the wave 2 low. When the daily structure is clear, the 4H entry is precise.
One practical rule: always maintain an alternative count. If price moves in a way that invalidates your primary interpretation, switch to the alternative immediately rather than forcing the original count to fit. The market is right; the count is an approximation.
For context on how price structure forms at key reversal points, see our support and resistance guide.
Common Mistakes When Using Elliott Wave
Forcing the count. Not every price sequence has a clean eight-wave structure. Ranging markets produce overlapping, ambiguous waves that resist labeling. If the count is unclear after two attempts, step back and wait for the structure to clarify on a higher timeframe.
Trading wave 1. Wave 1 is the most difficult to trade. Sentiment is still against the direction of the new trend, volume is unimpressive, and the move is easily mistaken for a bounce in the prior downtrend. Most practitioners wait for wave 2 to complete at a Fibonacci level, then enter at the start of wave 3 with a tight stop below the wave 2 low.
Ignoring the invalidation level. Before entering any wave-based trade, define the price that would prove your count wrong. For a wave 3 long: that level is below wave 1’s origin. Set your stop there. If price trades through the invalidation level, close the position.
Expecting wave 5 to extend. The textbook says wave 5 should reach the 61.8% extension of waves 1 to 3. Retail traders wait for it. What plays out in practice: wave 5 frequently falls short of that target. Momentum divergence on the RSI or MACD during wave 5 is your warning. I take partial profit at the first resistance area in wave 5 and reduce size rather than holding for the full Fibonacci projection. The divergence has been a more reliable exit signal than the price target across multiple market cycles.
The core principle: use Elliott Wave as a framework for understanding market position, not as a precise prediction engine. It answers “what phase of the cycle am I likely in?”, not “exactly where will price go next.”
For context on the psychology driving these wave patterns, see our guide on trading psychology.
FAQ
What is Elliott Wave Theory in simple terms?
How many waves are in the Elliott Wave pattern?
What is the difference between motive and corrective waves?
What are the three rules of Elliott Wave Theory?
Is Elliott Wave reliable for trading?
How does Fibonacci relate to Elliott Wave?
Can beginners use Elliott Wave theory?
🌍 Our recommended brokers
Reader Reviews
The top-down three-timeframe workflow (weekly primary degree → daily sub-waves → 4H entries) is the part most Elliott Wave resources omit entirely. I had been trying to count waves on single timeframes and getting contradictory results depending on which chart I opened. Running the sequence weekly-to-daily-to-4H on EUR/USD for the past two months gave me 18 setups where the count was clear at all three levels. Of those 18, 12 reached the 2:1 target, 4 stopped out cleanly below the wave 2 invalidation level, and 2 I exited early. Monthly return over this period averaged 7.4%. The methodology only works when the multi-timeframe alignment is unambiguous, if any level is unclear, I skip the setup.
The RSI divergence exit signal for wave 5 is more reliable than the Fibonacci target in my testing. Clean actionable framework.
The three hard rules section finally gave me a practical filter for invalidating counts. Before reading this, I kept adjusting my wave labels when price didn't cooperate, essentially curve-fitting in real time. Now I apply the rules mechanically: if wave 2 retraces more than 100% of wave 1, the count is wrong, full stop. Running this on GBP/JPY daily for six weeks: I discarded four counts on rule violations and in three of those four cases, the alternative count I switched to produced a cleaner structure and a valid entry. One of those entries returned 6.3% in two weeks.
Two years on crypto charts with inconsistent results using Elliott Wave. The wave 3 entry framework with stop below wave 2 low changed my approach completely. On BTC weekly, the last four wave 3 starts I identified after applying the three-rule filter all produced extended moves, monthly returns in those four months averaged 8.1% on a disciplined 1% risk per trade. The key insight is waiting: wave 3 always announces itself with expanding volume and momentum confirmation. Entering on the volume expansion rather than the early breakout reduced my false entries by roughly half.
The zigzag versus flat correction distinction changed how I size wave C entries. Zigzag corrections carry more momentum in wave C and warrant more aggressive position sizing; flat corrections produce weaker C waves that I size down. This one observation improved my average trade outcome on corrective phase entries across EUR/USD and XAU/USD.
Practical and honest. The section on maintaining an alternative count is advice I had ignored for too long, switching to the alternative immediately when invalidation triggers prevents the trap of rationalising broken counts.
The Fibonacci table linking each wave to its typical retracement or extension ratio is the clearest reference I have found. Wave 2 at 50–61.8%, wave 3 extending to 161.8%, wave 4 at 38.2%, having these as fixed reference points stops me from adjusting expectations mid-trade. Used these ratios on XAU/USD daily for three months: Fibonacci target confluence correctly estimated the wave 3 endpoint within 15 pips on 5 of 7 setups.
The wave 5 divergence warning is genuinely useful. RSI printing lower highs while price makes new highs on the daily chart is a clean exit signal. I have been taking partial profit at the first divergence bar in wave 5 for the past two months on EUR/USD and GBP/USD, then running a trailing stop on the remainder. Out of 8 wave 5 setups, 6 reversed within 3 sessions of the first divergence signal.
Leave a Review

Forex Analyst & Senior Trader
Former FX desk trader with 8 years in institutional forex. Works in multi-timeframe analysis and order flow, turning desk experience into systematic, testable rules across forex and metals.