


· 18 min read
Aroon Indicator: The Trend Gauge That Reads Time, Not Price
The Aroon indicator grades a trend by timing the last high and low. Its three uses, the crossover and the Aroon oscillator, on gold, Bitcoin and Forex.
Indicators describe what's already happening. They don't predict.
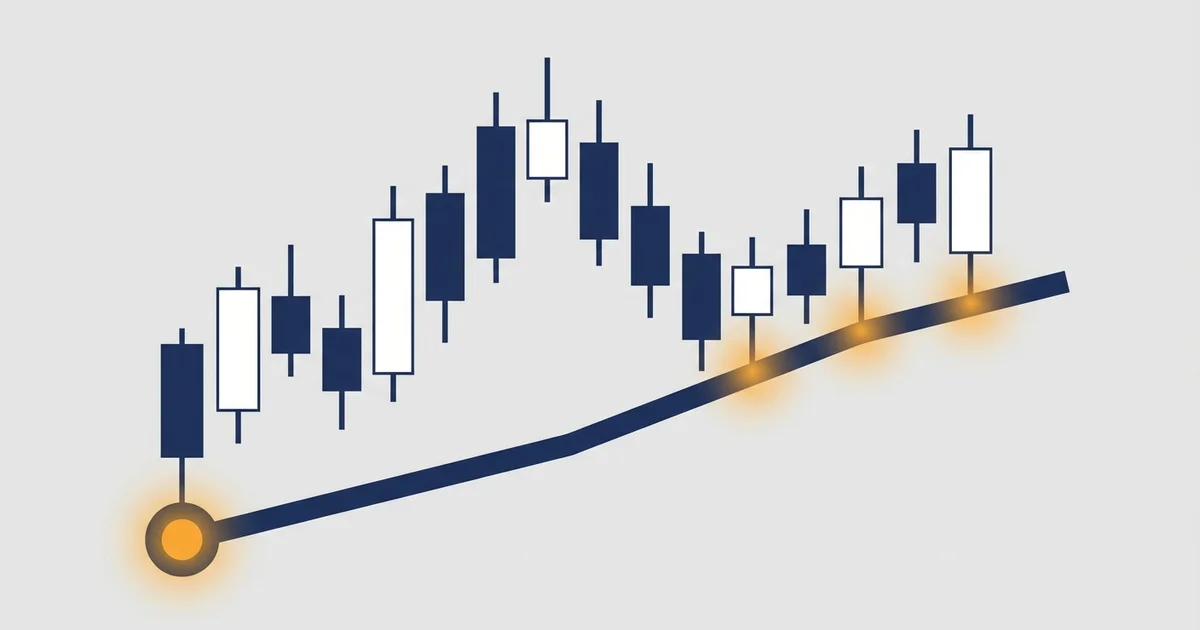
Anchored VWAP pins a volume-weighted average to a pivot you pick. How it works as dynamic support and resistance, and how it differs from session VWAP.
 nina-carr · · 19 min read
 Indicators describe what's already happening. They don't predict price. We lean on a short list: MACD, RSI, EMA structure. Each guide covers how to read one without lagging into bad entries. We also cover when the indicator misleads, and what combinations actually filter noise instead of adding more of it. Price action is the partner here, not the indicator alone.
 Indicators
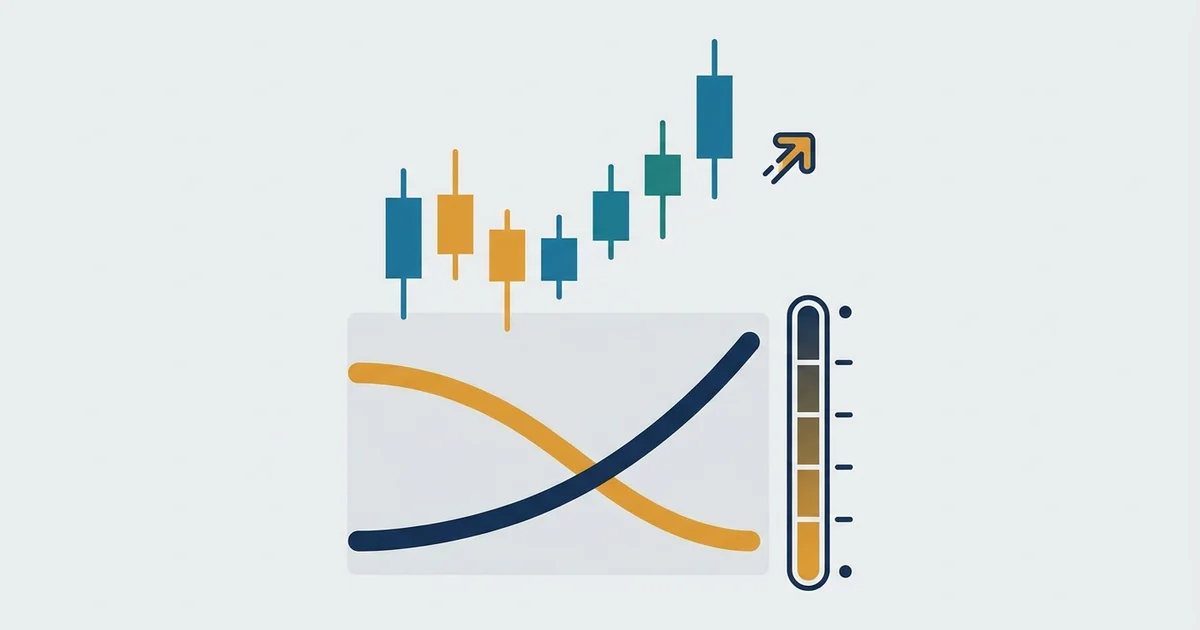
 The Aroon indicator grades a trend by timing the last high and low. Its three uses, the crossover and the Aroon oscillator, on gold, Bitcoin and Forex.
 Indicators
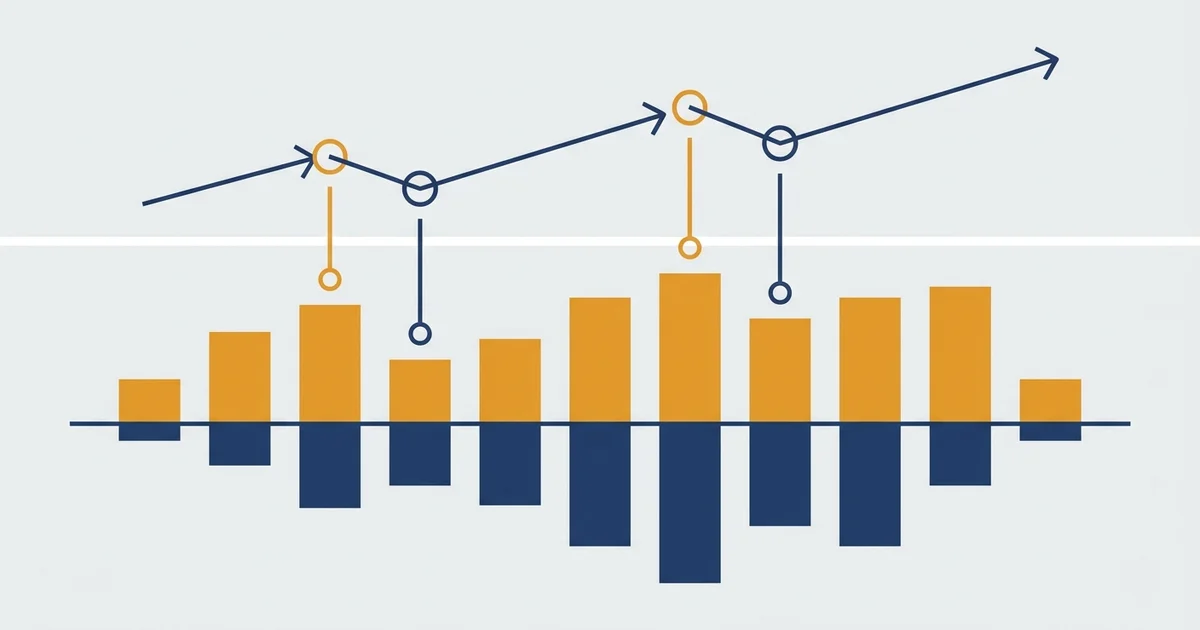
 The awesome oscillator zero-cross ran a 1.87 profit factor on eight years of gold, and 4.63 with a calm-market filter. Honest about where it breaks.
 Indicators
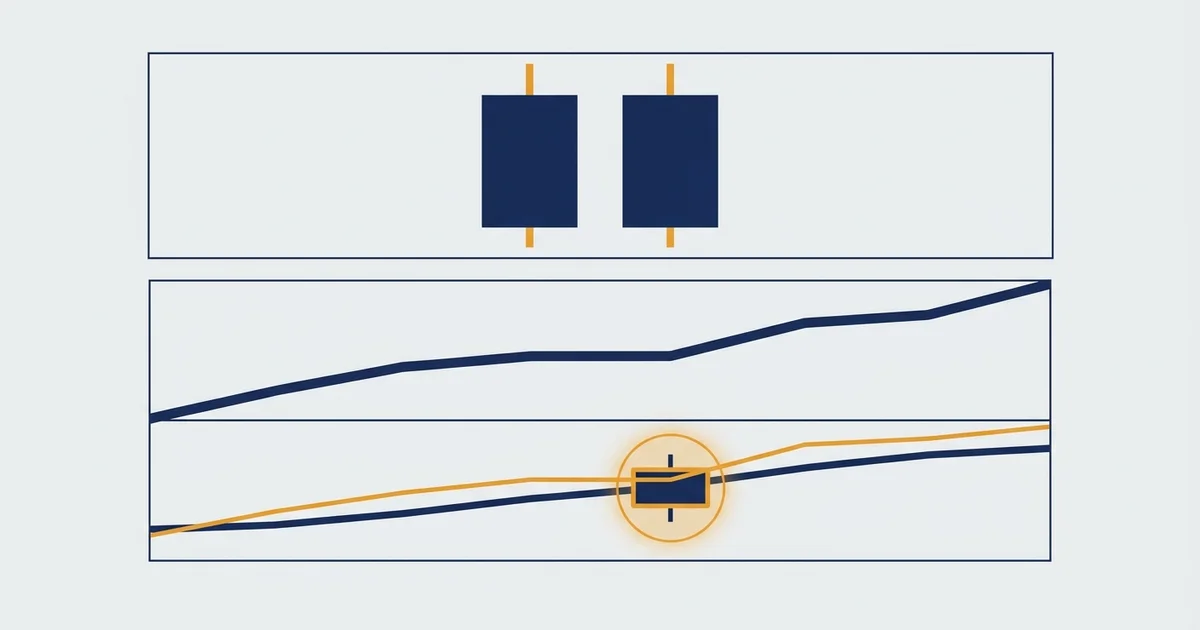
 We ran the accumulation/distribution indicator on eight years of daily gold. The fast A/D cross pays best, and calm days beat volatile ones five to one.
 Indicators
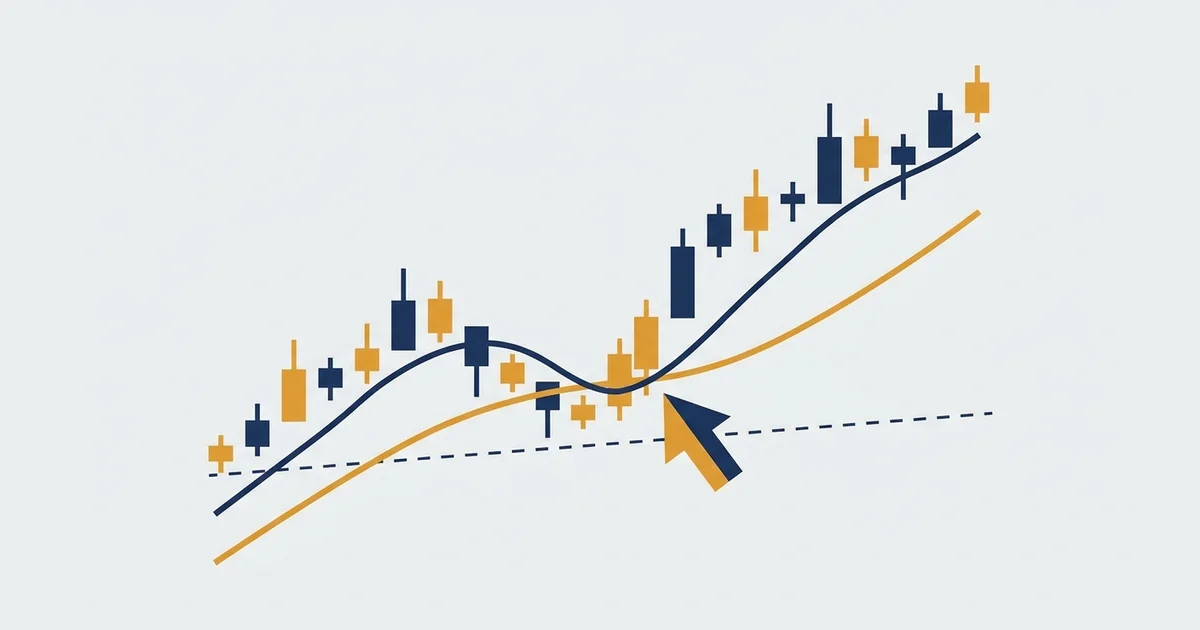
 The Hull Moving Average is a near-zero-lag trend line. Across eight years of gold data its cross setups ran a 1.9 profit factor. Here is how to trade the three main ways, and where each one breaks.
 Indicators
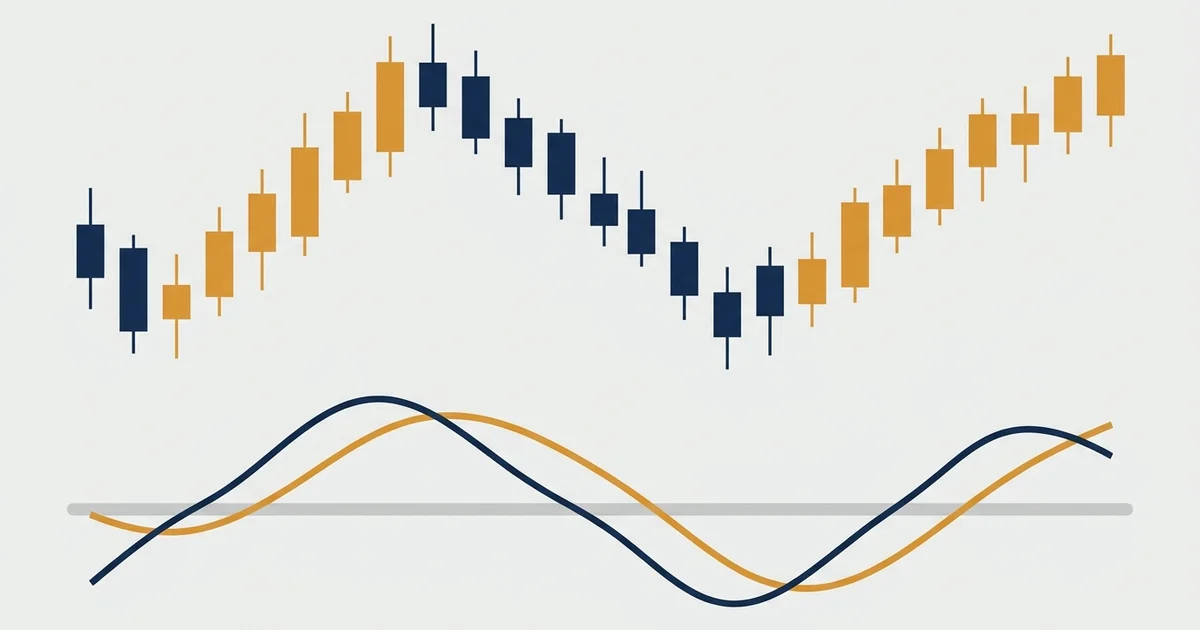
 The Relative Vigor Index is a momentum oscillator. On eight years of gold its signal cross paid best in calm markets, and the volume filter made it worse.
 Indicators
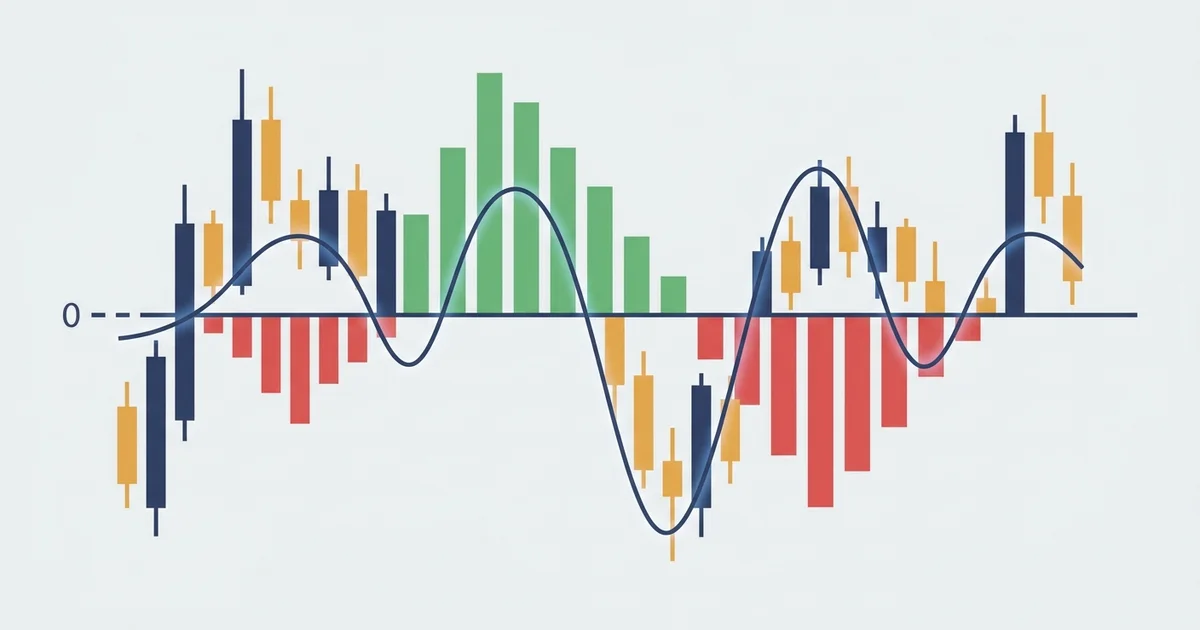
 We ran the Chaikin Money Flow indicator on eight years of gold, EUR/USD and Bitcoin. The CMF zero-cross pays best on gold, thin on the euro, marginal on Bitcoin.
 Indicators
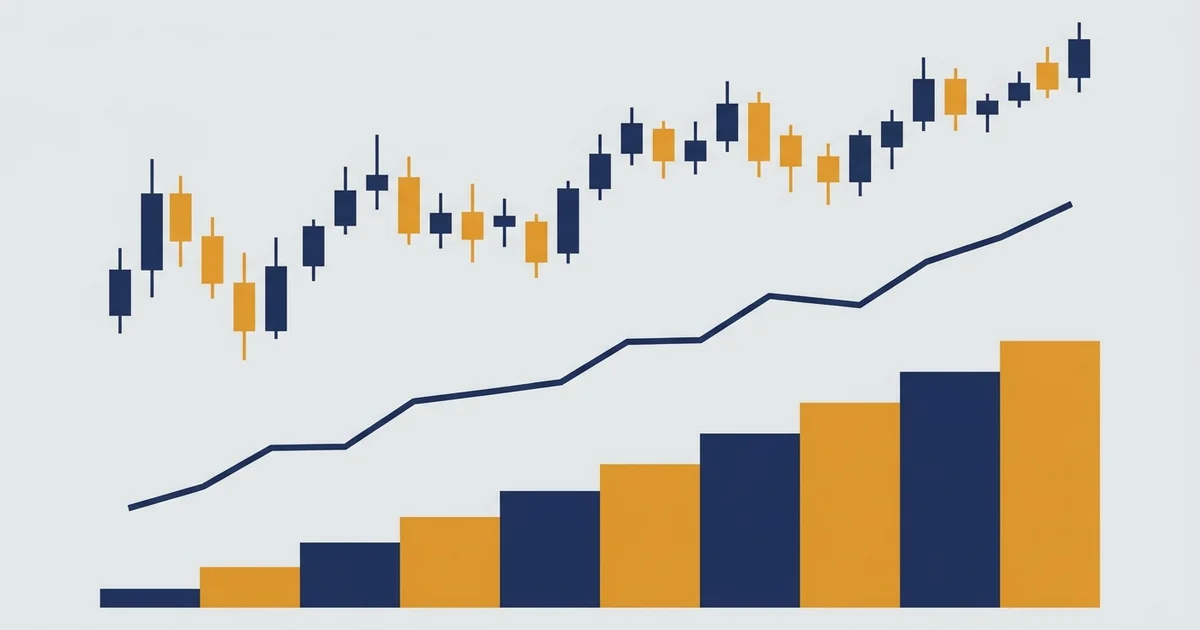
 On balance volume is a running tally of volume that leads price. We tested it over eight years: the raw signal is a coin flip, but as a trend confirmation it earned a 1.89 to 2.40 profit factor on gold and silver. The twist: adding a volume filter helps on Bitcoin and wrecks it on Forex.
 Indicators
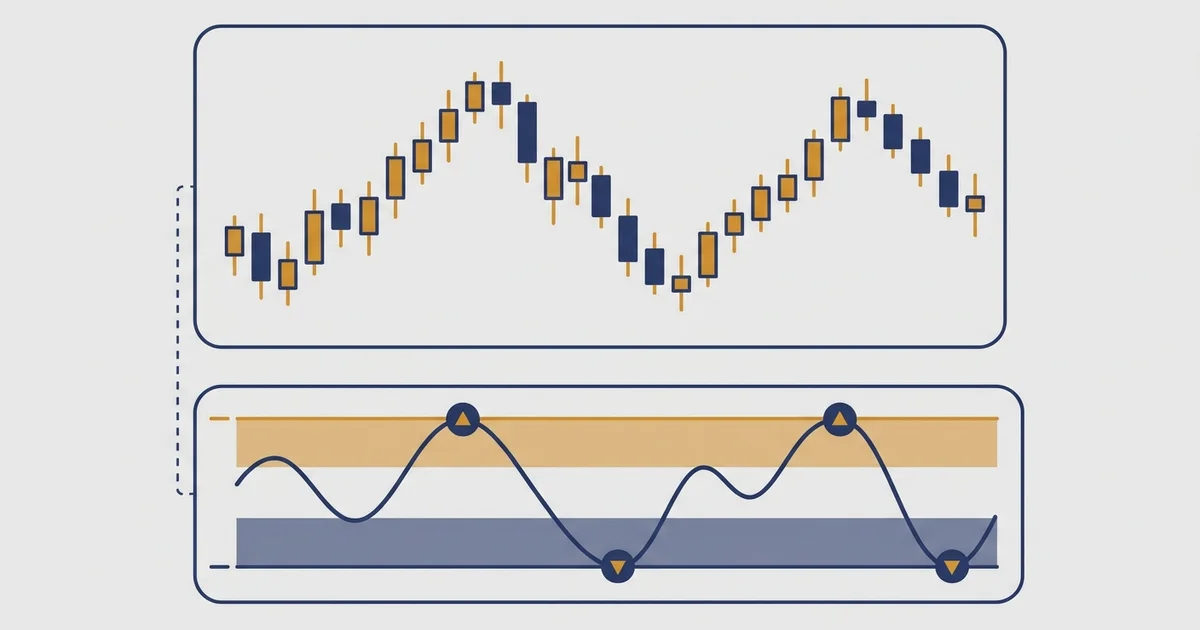
 We tested Williams %R across eight years on gold, EUR/USD and Bitcoin. The famous buy-at-minus-80 bounce wins often and still loses. The trend-pullback is the play that travels. Full numbers, real charts.
 Indicators
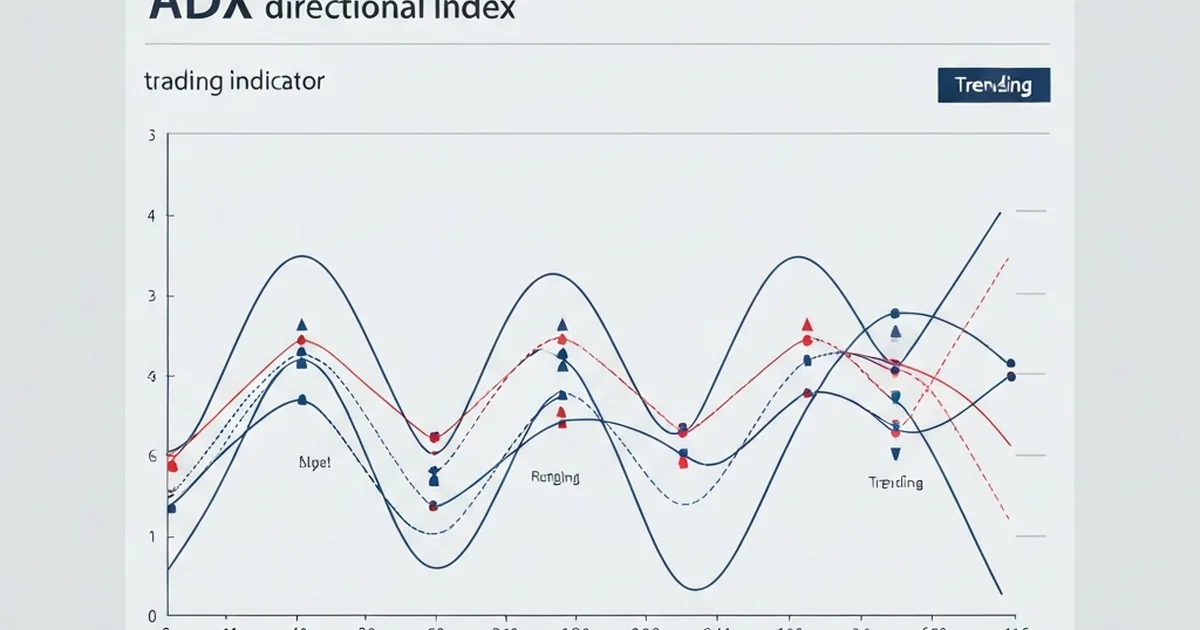
 Learn how the average directional index (ADX) measures trend strength, what ADX readings mean, and how to use +DI/-DI to find trending trade entries.
 Indicators
 What ATR measures, how to calculate it, and how to use it for stop losses, position sizing, and volatility filters. Includes live forward-test results.
 Indicators
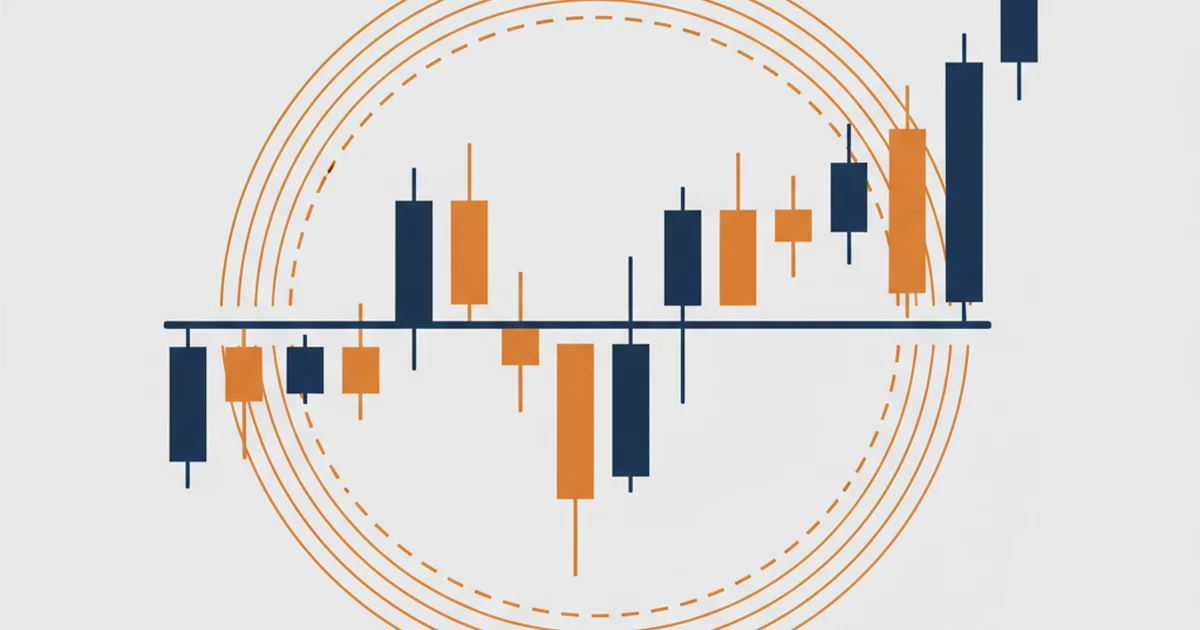
 What is VWAP? It is the volume-weighted fair-value line. Run on eight years of daily data, the VWAP reclaim setup paid a 2.21 profit factor on gold.
 Indicators
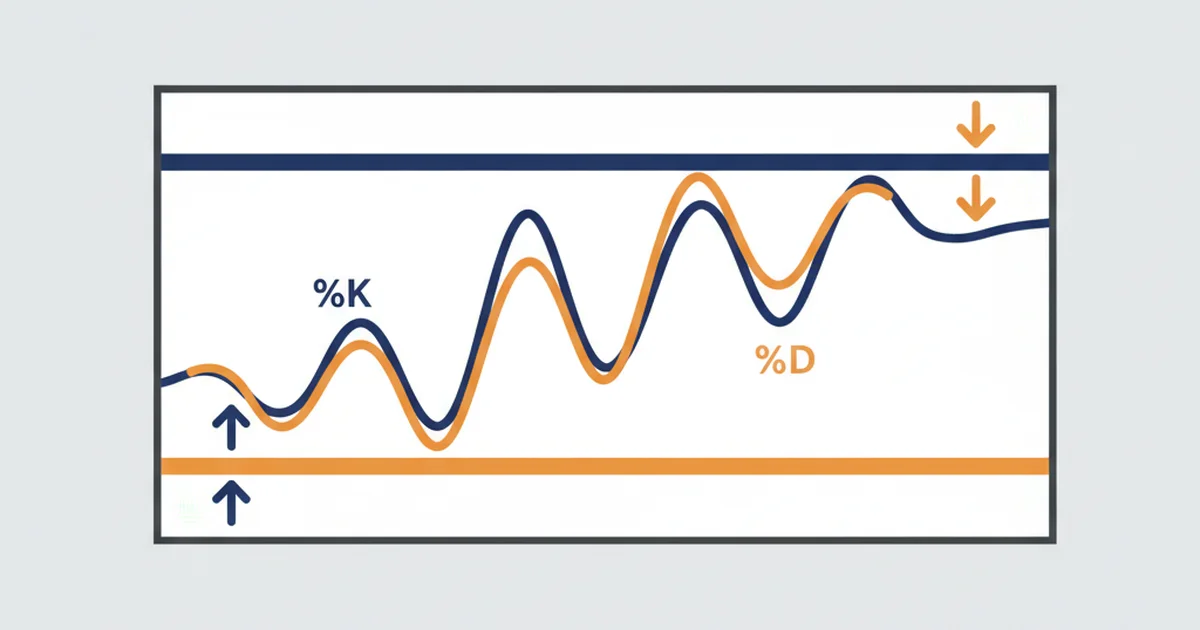
 The stochastic oscillator is taught as an oversold bounce. We tested it over 8 years: that read loses on gold. Here is the %K/%D play the data rewards, by market.
 Indicators
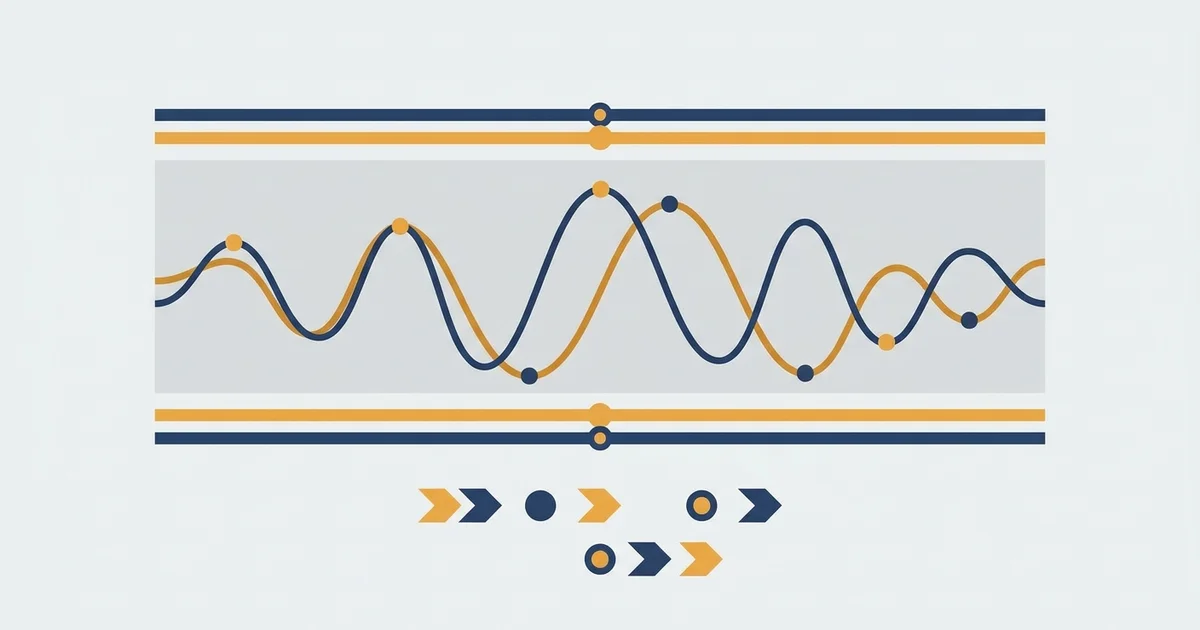
 StochRSI moves faster than regular RSI but generates more noise. Here's how it works, best settings for forex and crypto, and a live-tested 64% win rate setup.
 Indicators
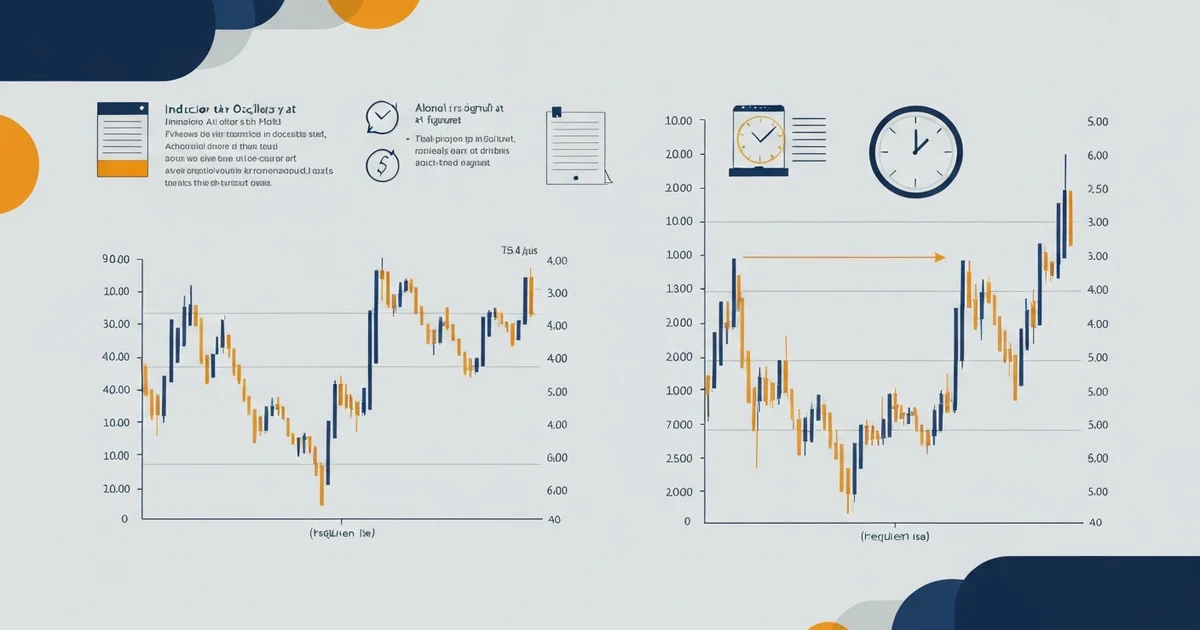
 We ran RSI period 7/9/14/21 and the 70/30 vs 80/20 levels across gold, EUR/USD and Bitcoin on three timeframes of real market data. There is no magic RSI setting, but the data says exactly which period and levels pay for each play. Real numbers, real charts.
 Indicators
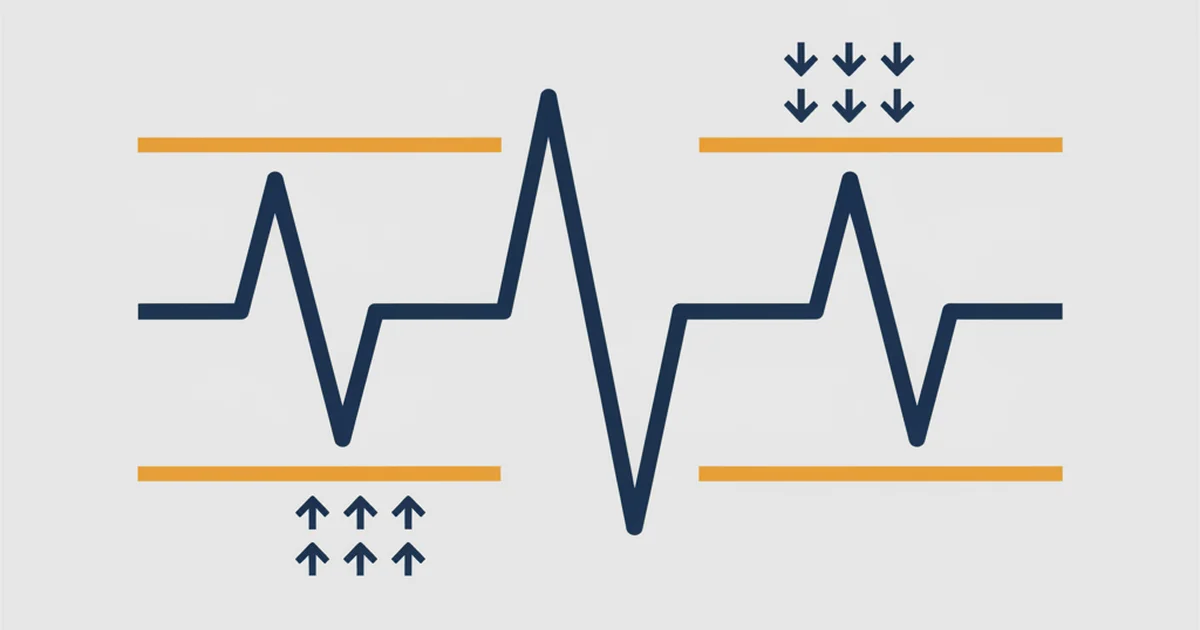
 Learn how to use the RSI indicator for trading. Overbought/oversold levels, divergence signals, and the 14-period settings that work in 2025-2026.
 Indicators
 The MACD indicator has two famous crosses. We tested both across eight years on gold, EUR/USD, BTC and oil. The slower zero-line cross is the real edge, with real numbers.
Apply these indicators on prop firm capital: $25K to $200K accounts, no personal risk. Compare the firms that actually pay out.