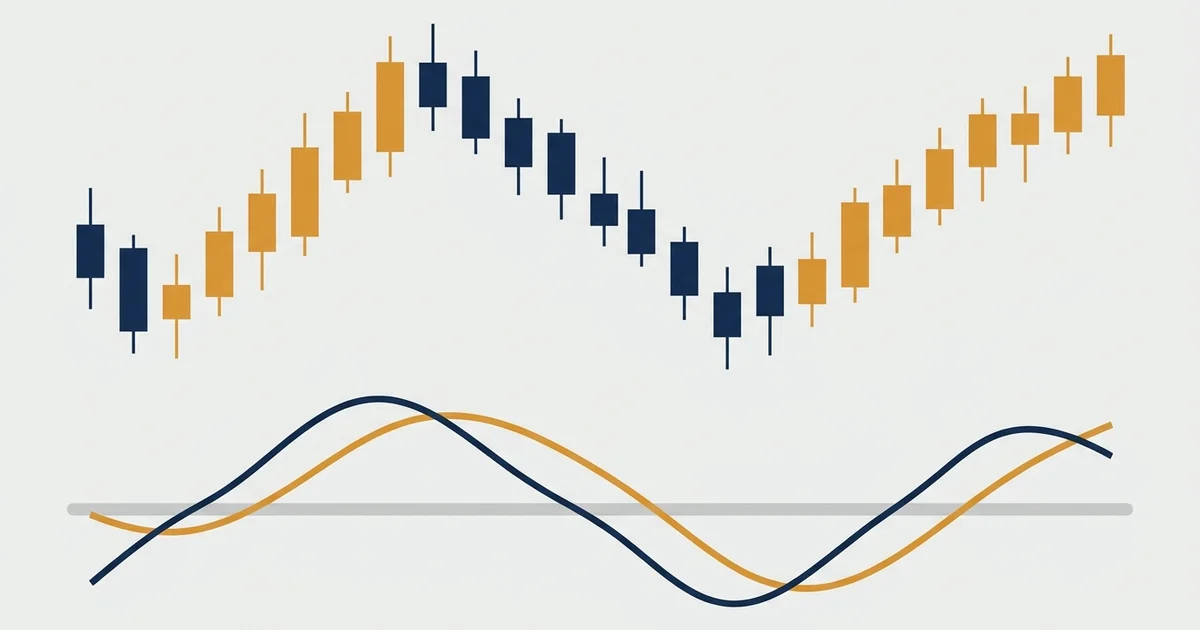

What the relative vigor index actually measures
Most oscillators compare today’s close to some past close. The relative vigor index asks a narrower question: where in the bar did price close relative to where it opened.
The logic is old trading-desk folklore made into a number. When buyers are in charge, candles tend to close near their highs.
When sellers take over, they close near their lows. The RVI turns that habit into a single line that swings above and below a zero line.
Here is the whole idea on one cheat-sheet before we put it on real price.
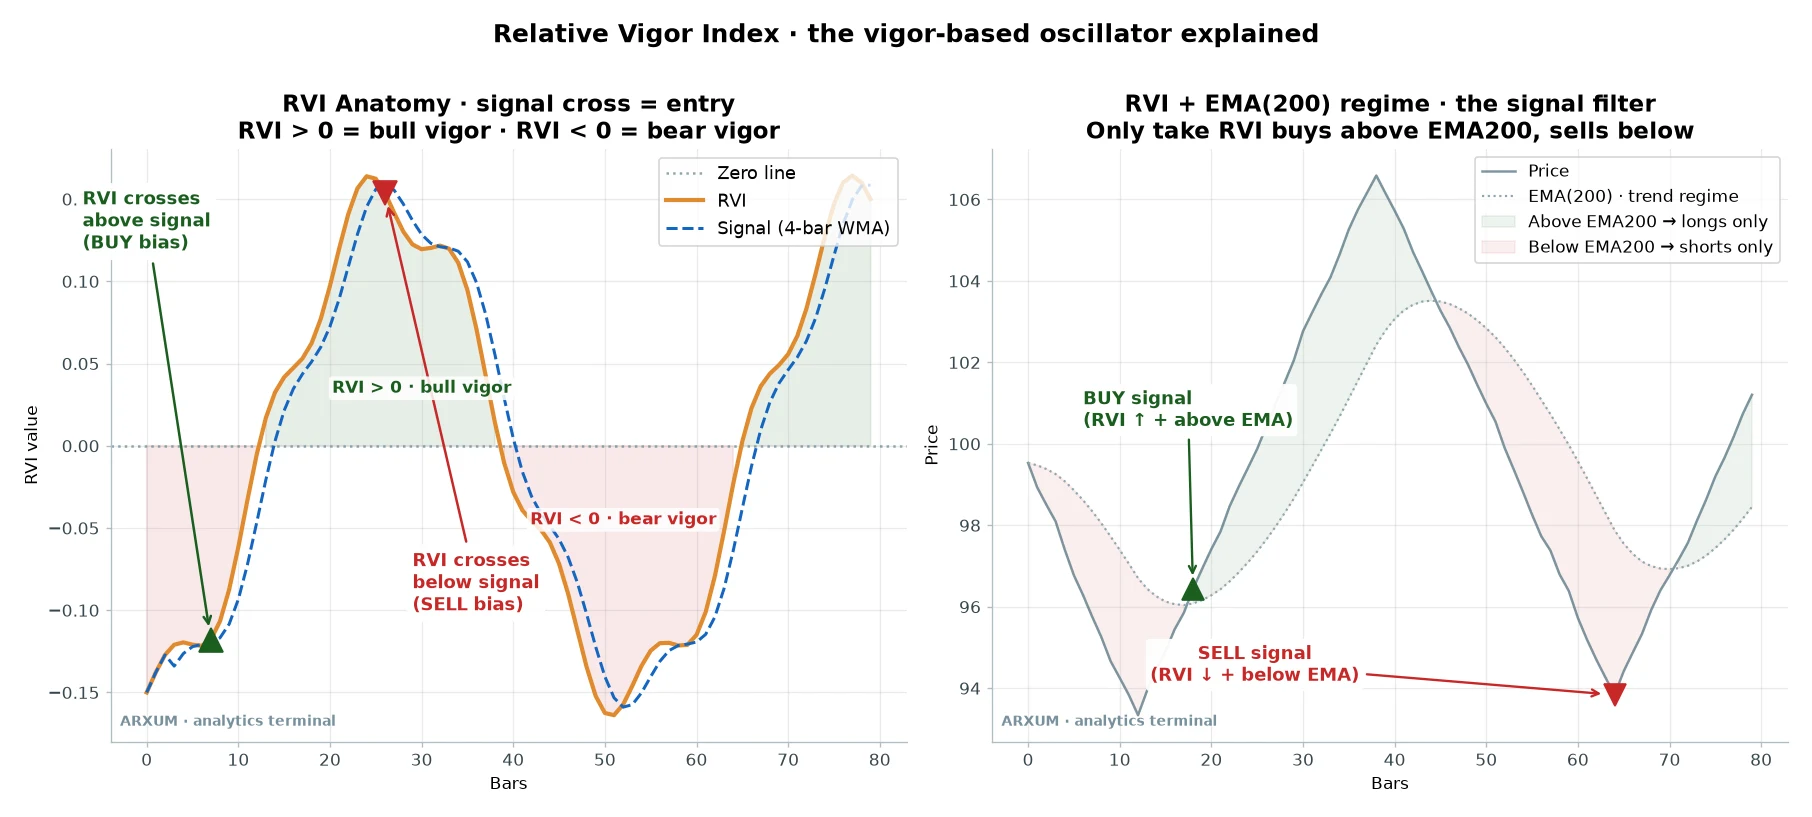
Read the left panel first. The orange line is the RVI, the dashed blue line is its signal, and a cross between them is the trigger.
Above zero means closes are winning on balance, so bull vigor. Below zero is the mirror.
The right panel is the filter we lean on, and it matters more than the settings. When price sits above its 200-day average the market is in an uptrend, so you only take the buys.
Below it, only the sells. That single gate is what keeps the RVI out of trouble.
One naming note, since it trips people up. This is the Relative Vigor Index, sometimes written as the RVI indicator.
It is not the Relative Volatility Index, which measures something else and just happens to share the acronym.
The RVI on a real gold chart
A cheat-sheet is clean by design. Real price is messier, so here is the same signal cross on eight years of spot gold, zoomed into one honest window.
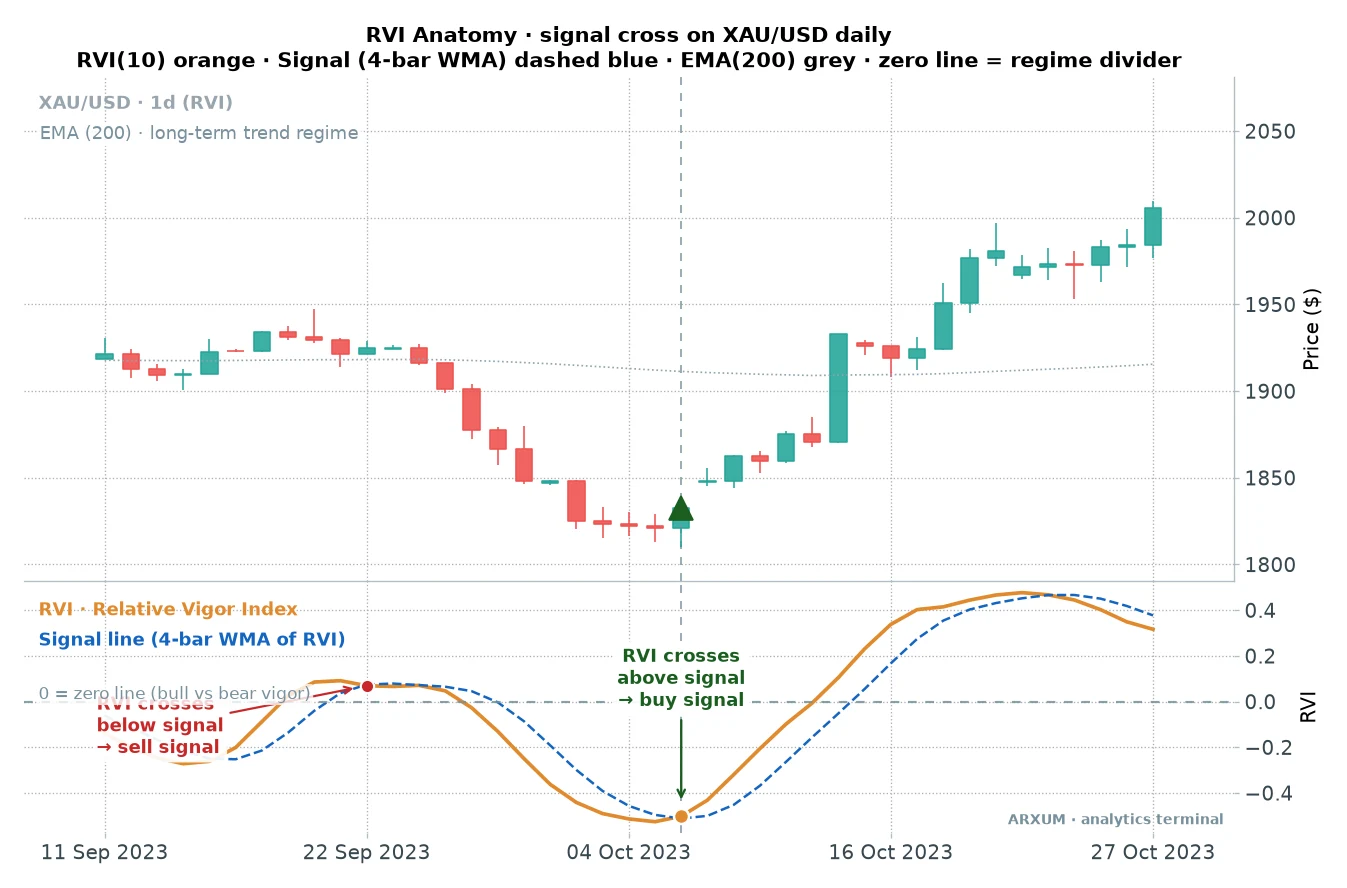
Look at the lower panel. Price fell for a couple of weeks, then the orange RVI stopped dropping, hooked up, and crossed above the dashed signal line.
That cross is your entry, marked by the green arrow on the price panel above.
Notice what the RVI did that raw price could not tell you as early. It flagged the shift in closing pressure while the candles were still red.
That is the appeal of a vigor reading. It listens to how bars close, not just where price is.
This is the setup the rest of the article tests and ranks. Not in theory, on the actual numbers.
How the RVI is built, in plain words
You do not need the formula to trade this, but a one-line version helps you trust it. For each bar the RVI takes the close minus the open, then divides by the bar’s full range, the high minus the low.
That ratio is smoothed over ten bars so a single wild candle cannot jerk it around. Then a second line, the signal, is a short weighted average of the RVI itself.
The two lines are what you watch, and the cross between them is the trade. If that construction reminds you of the stochastic oscillator, you are right, they are close cousins.
The default look-back is ten bars, and I will save you a tuning session. We ran periods of 7, 10, and 14 on gold, and 10 came out on top with a profit factor of 1.99.
The textbook value won, which is a small relief and one less knob to overfit.
Three ways to trade the relative vigor index
The RVI is not one strategy, it is a tool that supports a few. We built and ran three on gold’s daily chart, then ranked them by how they actually performed over the full eight years.
| Setup | Trades | Win rate | Profit factor | Best for |
|---|---|---|---|---|
| The signal-line cross | 79 | 56% | 1.99 | the main edge |
| The zero-line cross | 64 | 52% | 1.83 | fewer, cleaner signals |
| The trend ride | 80 | 55% | 1.64 | the shallowest drawdown |
Three terms before the numbers pile up. Profit factor is total dollars won divided by total dollars lost across the whole strategy, so anything above 1.0 makes money and 2.0 means you won two dollars for every one you lost.
Win rate is the share of trades that closed green. And reward-to-risk, written 1:X, compares one trade’s reward to its risk: the 1 is what you stake from entry to stop, the X is how many times that you made back, so a 1:2 winner paid double what it risked.
Tap any setup name above to jump to its rules.
1. The signal-line cross
This is the lead, and the one to learn first.
- Entry: buy when the RVI crosses above its signal line.
- Regime gate: only take the buy when price is above its 200-day exponential moving average, the line that tells you the bigger trend is up.
- Stop: below the recent swing low, roughly the last ten bars. That distance is your risk, the “1” in every risk-to-reward figure here.
- Target: a fixed reward of twice your risk, a 1:2 trade, or you exit if it stalls for too long.
- Timeframe: the daily chart. This is a swing setup, not a scalp.
- Direction: long while price is above the 200-day line.
Here is what those rules did to a $1,000 account over eight years, risking 2% per trade.
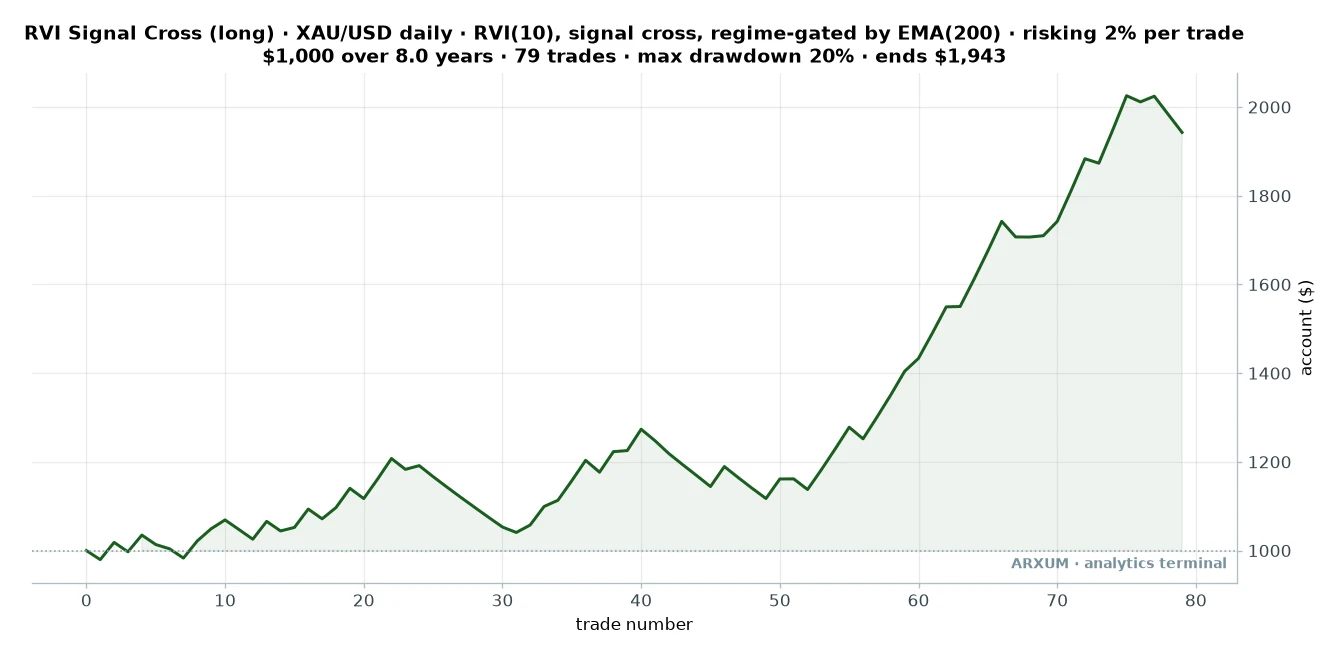
Read that curve honestly. It is not a smooth ramp.
For the first stretch the account chops around break-even, then the strong gold trend of the last few years lets the winners stack up.
| Trades | 79 |
| Win rate | 56% |
| Reward-to-risk | 1:1.6 |
| Profit factor | 1.99 |
| Max drawdown | 20% |
| Avg hold | ~3 weeks |
| Net return on $1,000 | +94% |
Max drawdown is the worst peak-to-trough drop the account took along the way, here about a fifth. It is the pain you had to sit through to collect the rest.
One number to reconcile before you trust the table. You aim for a 1:2 reward, yet the realized reward-to-risk reads 1:1.6.
That gap is the trades that drift up and time out at the 30-day limit for a small gain instead of reaching target, which you will see in the examples below.
The finding worth the read: this signal likes a quiet market. Most guides tell you to confirm a cross with a volume spike. On the RVI, that advice is backwards.
| Regime gate only | 79 trades · 56% win · PF 1.99 |
| Only in a calm market, ADX below 22 | 35 trades · 57% win · PF 2.69 |
| Only on low volatility, ATR below normal | 39 trades · 54% win · PF 2.36 |
| Only in a strong trend, ADX 22 or more | 44 trades · 55% win · PF 1.56 |
| Only on a volume surge | 7 trades · 43% win · PF 0.83 |
The ADX is a trend-strength gauge that runs from zero upward. A reading above 22 means a genuine trend is in force, below 22 means the market is calm or ranging.
We use 22 because that is where the split showed up in the data, not because it is magic.
Look at the calm row. Taking the RVI cross only when ADX sits below 22 lifted the profit factor from 1.99 to 2.69.
The low-volatility version did nearly as well at 2.36, where “calm” means the Average True Range, a simple measure of how far price travels in a day, is sitting below its own recent average.
Now the volume row, and it is the point of the whole table. Confirming with a volume surge dropped the profit factor to 0.83, which means it lost money.
On most oscillators volume helps. On the RVI it hurts, because a volume spike usually marks a market already running hard, exactly the trending condition where these crosses whipsaw.
Why calm wins here. In a ripping trend, price closes in the trend direction almost every bar, so the RVI just stays pinned high or low and its crosses mean little. In a calm, ranging market a shift in closing pressure is a real event, and that is what the RVI catches.
That makes the RVI a mean-reversion and regime-change tool at heart, not a trend-chaser. Keep that in your head, it explains everything below.
Here is one of those trades in the current market.
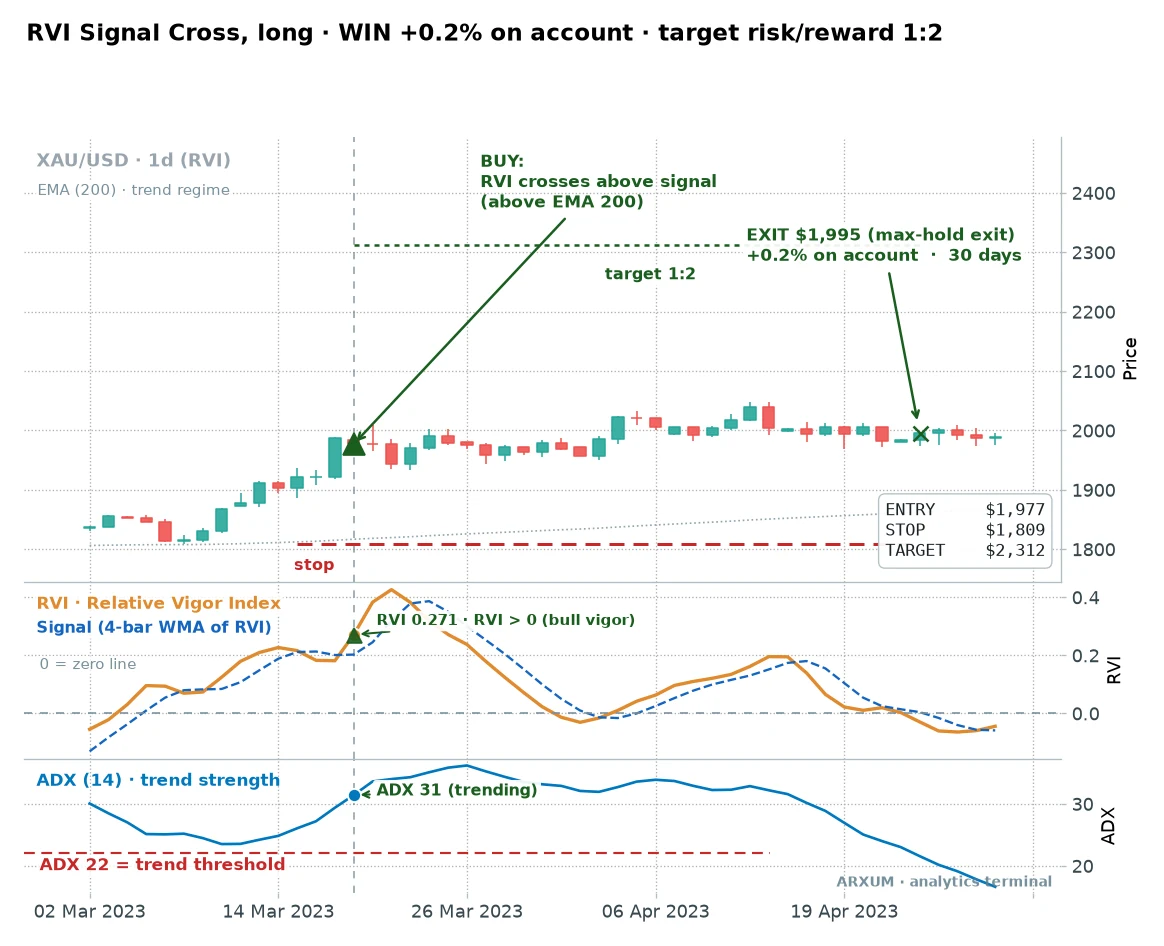
The buy fires as the RVI crosses up and price is above the 200-day line, shown in the lower panels with the entry marked by the vertical line. The ADX pane reads about 31 here, a trending market, which is why this one was only a modest winner rather than a clean run to target.
Notice the honesty in that. It did not rocket to the 1:2 target.
It ground higher and closed out at the 30-day time limit for a small profit. That is a common outcome for this setup in a slow grind, and pretending otherwise would be a lie.
Here is a cleaner example from an earlier, quieter stretch of gold.
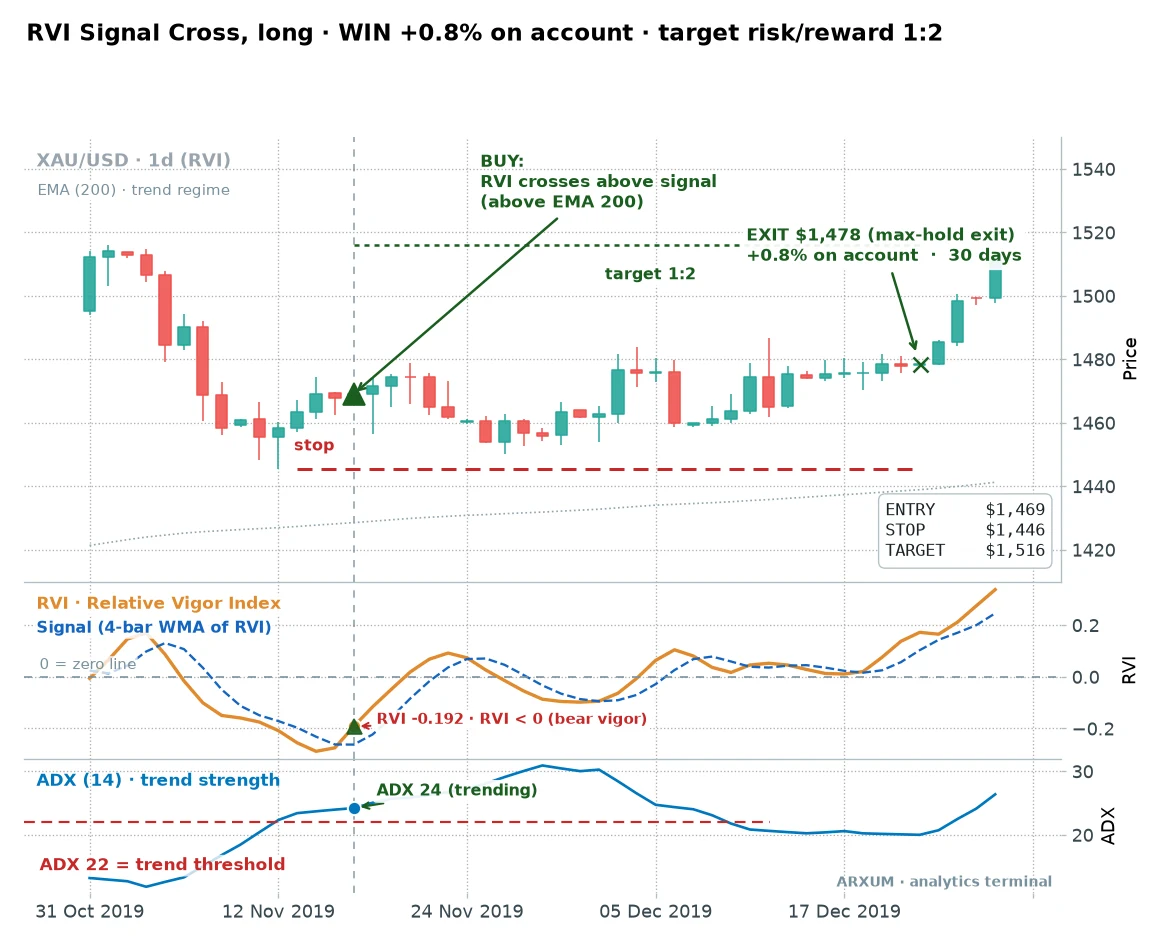
Same rules, calmer conditions, and the entry sits right on the cross. The RVI hooks up out of bear vigor, crosses the signal, and price was already curling higher above its trend line.
This is closer to the calm state the filters favour, though at an ADX of 24 it still sits just above the under-22 cutoff. A genuinely calm entry, ADX below 22, is rarer on the chart, which is the honest catch the next paragraph comes back to.
And now the other side of the ledger, because a strategy shown only through its winners is a sales pitch.
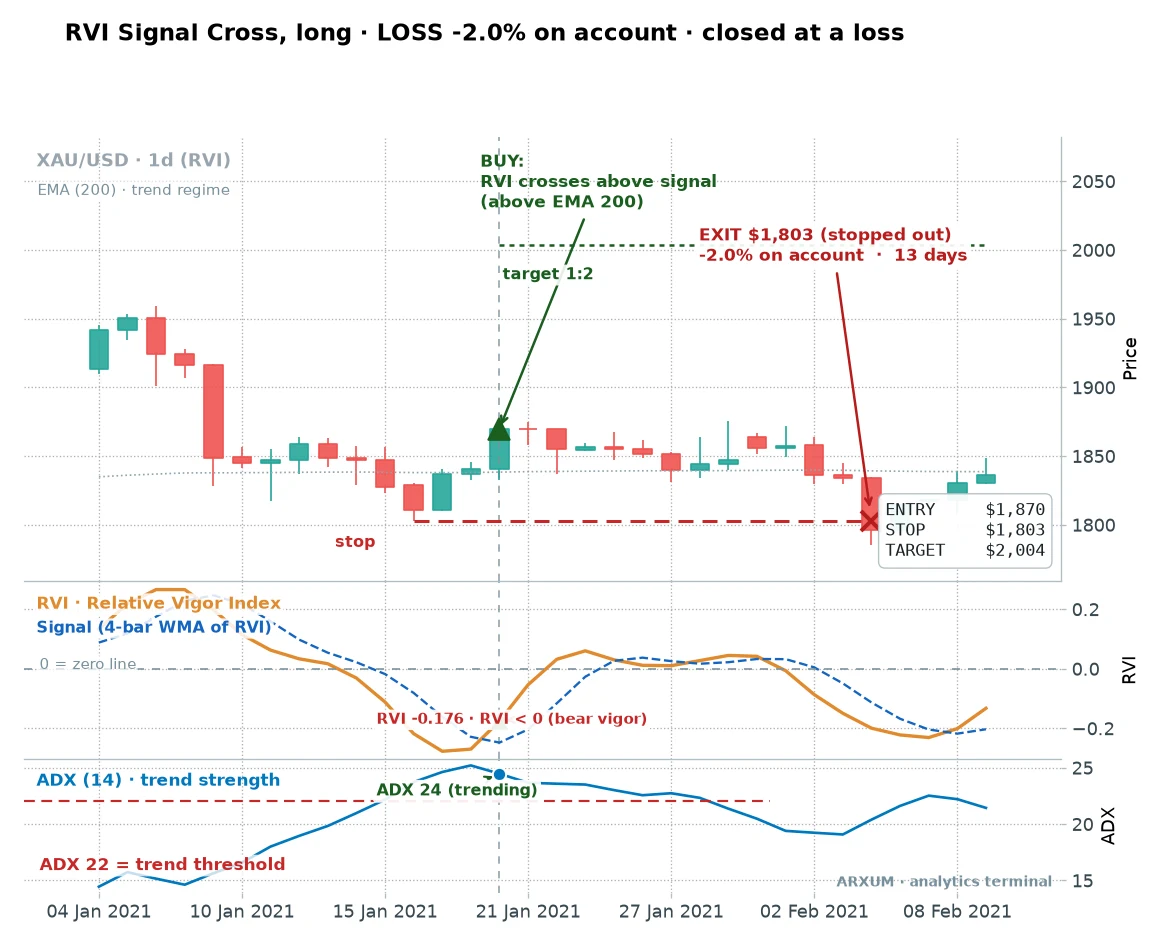
Everything qualified. The RVI crossed up, price was above the 200-day line, the trigger was clean.
Price still stalled, rolled over, and clipped the stop about two weeks later.
One honest thread ties these three examples together. Check the ADX pane on each: all were entered with the ADX above 22, a trending market, which is exactly why two were only modest winners and one lost.
The calm entries the data prefers, ADX under 22, are rarer on the chart, but they are where the stronger 2.69 profit factor actually comes from.
This is the deal you sign. A 56% win rate means you lose plenty, and a full stop-out costs about 2% of the account.
The math only works because you keep those losses capped while the winners are free to run further. No filter buys you certainty.
2. The zero-line cross
The second setup ignores the signal line and watches the zero line instead. The RVI crossing above zero means bull vigor has taken over outright, a slower and less twitchy trigger.
- Entry: buy when the RVI crosses above zero, with price above the 200-day trend line.
- Stop and target: same as the signal cross, a swing-low stop and a 1:2 reward.
- Timeframe: the daily chart, same as above.
- Trade-off: fewer signals, but each one is cleaner.
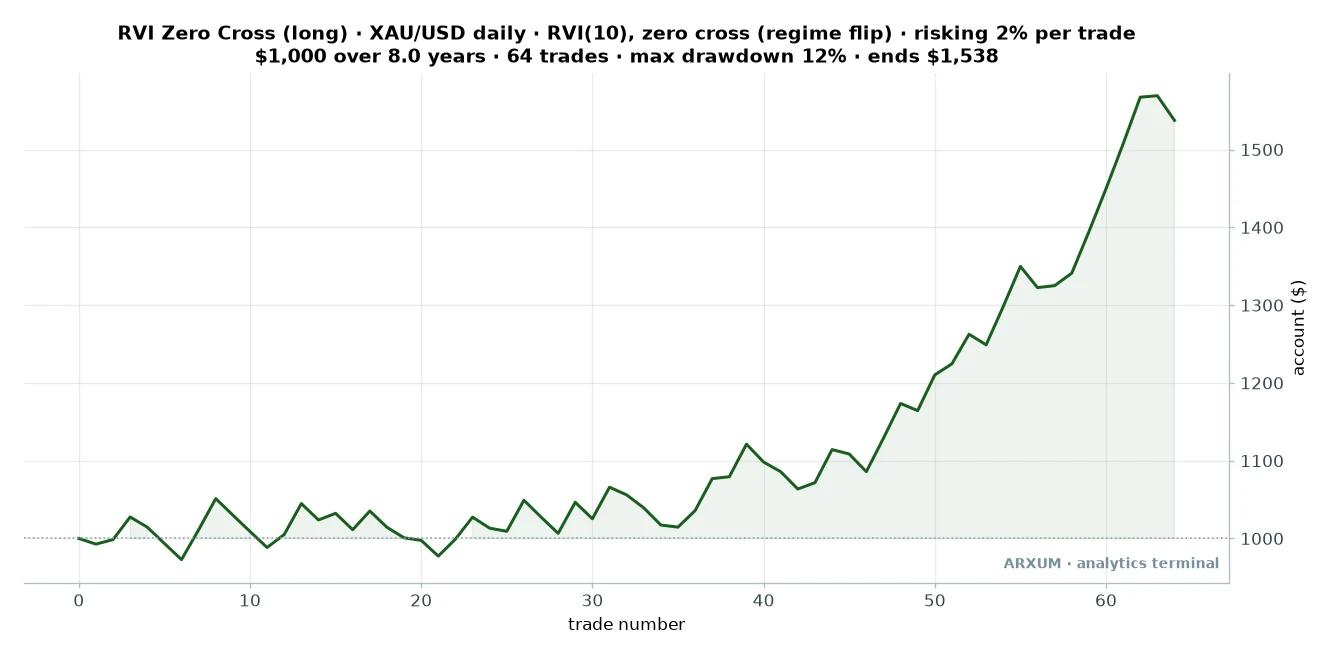
| Trades | 64 |
| Win rate | 52% |
| Reward-to-risk | 1:1.7 |
| Profit factor | 1.83 |
| Max drawdown | 12% |
| Avg hold | ~3 weeks |
| Net return on $1,000 | +54% |
The headline return is smaller than the signal cross, but look at the drawdown. It holds the worst drop to about 12%, well under the signal cross’s 20%.
If a smoother account curve helps you actually stick to the plan, that is a fair trade.
The calm-market lesson holds here too. Filtered to low-volatility entries, the zero cross was the strongest of the three on out-of-sample data, which is a good sign it is not a fluke.
3. The trend ride
The third setup is the most cautious. It only takes a signal cross when the RVI is already above zero, so you are adding to strength rather than catching a turn.
- Entry: the RVI crosses its signal line while already sitting above zero, price above the 200-day trend.
- Exit: on a reverse cross or the 1:2 target.
- Timeframe: the daily chart, same as the other two.
- Character: the tightest filter, the fewest surprises.
Here is how it scored over the full eight years, so it sits alongside the other two:
- Trades: 80
- Win rate: 55%
- Profit factor: 1.64, the lowest raw return of the three
- Max drawdown: under 10%, the shallowest of all
- Best confirmation: a MACD agreement, not the calm-market filter. The MACD is a momentum gauge built from two moving averages, and “agreement” just means it points the same way as the trade.
Its selling point is control. Think of it as the conservative cousin: less money, fewer nasty stretches.
The short side, and why it barely works
Every setup above is long-only for a reason. We ran the shorts, and in a market that spent eight years mostly rising, betting on falls was a losing game.
The signal cross short made just 22 trades and limped to a 1.19 profit factor. The zero cross short was worse, a 0.60 profit factor and a brutal 49% drawdown when we stripped out the 200-day gate.
That last number is the whole argument for the regime filter in one figure.
The honest read is simple. On a market with a clear downtrend the short side would open up, but you take shorts only when price is below the 200-day line.
You never sell a rising market just because the RVI flipped down for a few bars.
Does it beat just holding gold?
No, and I am not going to dress that up. Over these eight years gold itself roughly tripled, a buy-and-hold gain far above anything the RVI setups made.
When a market goes almost straight up, any strategy that steps in and out will trail simply holding it.
So why bother timing it. Two honest reasons.
The strategy’s worst drawdown was about 20%, shallower than gold’s own 27% drop along the way, so the ride was calmer. And a signal that can flatten or flip short protects you when the trend finally turns, which buy-and-hold never does.
That is the real job of the RVI. It is a timing and risk-control layer for a market you already want exposure to, not a machine that out-earns a raging bull run.
Does the edge survive fresh data?
One backtest on one asset is a story until you split it. So we cut the eight years in half and checked whether the edge held on data it was never fit to.
- First four years, calmer gold: 35 trades, a soft 1.24 profit factor. Barely worth trading on its own.
- Last four years, trending gold: 44 trades, a 3.04 profit factor. Much stronger, on data the setup never saw during its early life.
An edge that improves on unseen data is the opposite of curve-fitting, where a strategy looks perfect on the past and falls apart on anything new. The catch is honest too: the strong recent half rode gold’s bull run, so some of that lift is the market, not the signal.
Treat the calm-market filter as the durable part and the raw return as regime-dependent.
That leaves three profit-factor numbers floating around, so here is which to trust. The 1.99 is your honest all-weather expectation.
The 2.69 is the extra edge the calm-market filter adds when conditions cooperate. The 3.04 was a bull-run bonus from the recent trend, and you should not count on it repeating.
How to trade it, without the guesswork
Here is the from-scratch recipe, so you rebuild our chart and not a look-alike.
On TradingView, type your ticker, open the Indicators menu, and add “Relative Vigor Index” with the length set to 10. Then add “Moving Average Exponential” with length 200 for the trend gate, and “Average Directional Index (ADX)” with length 14 for the calm-market read.
On MT4 or MT5 the RVI lives under Insert, Indicators, Oscillators, and the moving average and ADX sit under the Trend folder.
Placing the trade is four fields:
- Wait for the trigger. On the daily chart, the RVI crosses above its signal line while price is above the 200-day EMA. Prefer it when the ADX reads under 22.
- Enter at the close of the signal bar. A buy-stop just above it works too if you cannot sit at the screen.
- Set the stop below the recent swing low, about the last ten bars. That gap is your risk.
- Set the target at twice that distance, a 1:2 trade, or plan to close it if it stalls for a month.
On risk, one rule carries the rest: never stake more than 2% of the account on a single trade, sized so a stop-out costs exactly that. Here is that rule as plain arithmetic on a $1,000 account.
- Find your risk per ounce. Say gold is near $2,000 and your swing-low stop sits $160 below the entry. That $160 is what one ounce loses if the stop is hit.
- Find your dollar risk. 2% of a $1,000 account is $20.
- Divide. $20 you are allowed to lose ÷ $160 of risk per ounce = about 0.12 of an ounce. That is your position size.
Now the leverage part, because it is where beginners tie themselves in knots. One full ounce near $2,000 is about $2,000 of gold, which on a $1,000 account is already 2x your money in play.
So a single one-ounce micro lot, the smallest position most brokers allow, would risk about $160 on that same stop, roughly 16% of the account, far past the 2% rule on its own.
The broker’s headline leverage, say 100:1, does not change any of this. It is margin headroom, the collateral the broker needs to open the position, not permission to risk more.
Your real risk is fixed by the stop distance and the 2% rule, whatever leverage number the broker advertises.
That is why gold is the awkward one: its dollar stops are wide, so a $500 or $1,000 trader often needs a cent-lot or fractional broker, the kind that lets you hold below one ounce (our 0.12-ounce size above), or a larger account. Never widen the stop or oversize to force the trade in.
And a circuit breaker, because every mechanical edge has cold streaks. Three to six losers in a row is normal variance at a 56% win rate.
Beyond that, stop and check whether gold has slipped out of the calm regime the RVI needs, rather than doubling down out of frustration.
Common mistakes
- Confirming with volume. The one filter most traders add is the one that broke this edge. A volume surge dropped the profit factor below 1.0.
- Trading it in a raging trend. The RVI’s crosses go quiet when price runs hard. It earns its keep in calm, ranging conditions, not breakouts.
- Shorting a rising market. Ignore the 200-day gate and the short side bleeds. Direction follows the regime, not your opinion.
- Confusing the two RVIs. The Relative Vigor Index and the Relative Volatility Index share an acronym and nothing else. Load the wrong one and none of this applies.
- Expecting every trade to hit target. Many close small on the time limit. The edge is in the average, not any single trade.
Honest scope: read this before you trade it
Every number here comes from one run, so here is exactly what it does and does not cover.
- Asset: spot gold (XAU/USD) only, on the daily chart. The rules are generic and apply to any market with clean opens, highs, lows and closes, but we have not put your pair through this engine, and I will not hand you numbers I did not earn.
- Period: eight years, one long stretch that ended with a strong gold trend. A single window can flatter any strategy.
- Direction: long results are what pay. The short side was weak because the market rose, so shorts stay a separate question for a genuine downtrend.
- Costs: entries modeled at the close with 0.04% round-trip fees. Real fills can differ.
- This is education, not advice. Past results are not future ones, and only ever risk money you can afford to lose.
The short version
If you take one thing away, take this.
- Trade the RVI signal cross on the daily chart, long only while price is above its 200-day line.
- Prefer calm markets where the ADX reads under 22, and skip the volume filter, it made things worse.
- Keep risk at 2% a trade and expect a patient grind, roughly ten trades a year, carried by a handful of good ones.
Where to go from here
The RVI works best alongside the tools that gate it. The ADX indicator guide explains the calm-versus-trending read that sharpens every setup above.
And if the construction caught your eye, the stochastic oscillator is the RVI’s closest relative, built from the same open-to-close logic, and worth reading side by side.
FAQ
What is the relative vigor index, in plain terms?
Does the relative vigor index strategy actually work?
What are the best RVI settings?
How do I use the relative vigor index?
What is the best confirmation to add to the RVI?
Why does volume hurt the RVI?
Which markets and timeframes are best for the RVI?
Can I trade the short side with the RVI?
How is the RVI different from the stochastic or MACD?
How many losses in a row should I expect?
What do the key terms mean?
Real-time trade setups with entry, stop loss and take profit. Daily market analysis. No subscription, no complicated theory.
🌍 Our recommended brokers


Reader Reviews
Be the first to review this — tell other traders what actually helped, or where it fell short.
Leave a Review

Quant Researcher & Systems Builder
Quantitative researcher who builds the automated systems behind Arxum strategy testing. Works in Python and Pine Script, using AI alongside classic backtesting to validate strategies on years of real data.
