
What the awesome oscillator is, by the textbook
Here is the thing you came to see. This is the awesome oscillator, the way every chart draws it.
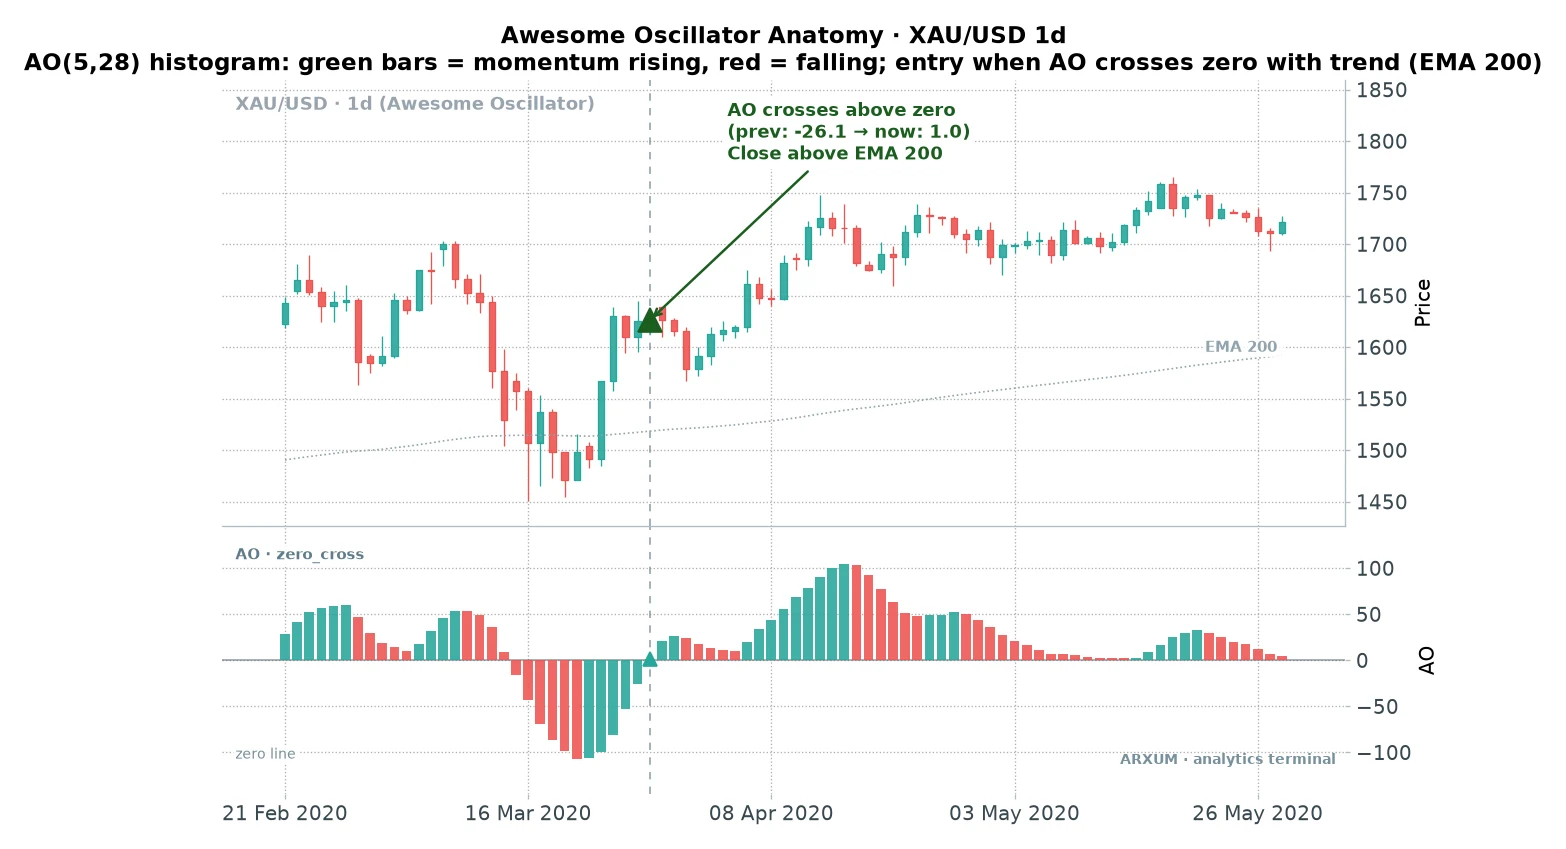
The awesome oscillator indicator sits in a panel under your price chart. It is one number, plotted as a bar for each candle.
The math is simple. You take the midpoint of every bar, the high plus the low divided by two.
Then you average that midpoint two ways, a fast 5-bar average and a slow average, and subtract one from the other.
AO = 5-bar average of midpoints - slow average of midpointsWhen the fast average is above the slow one, the bars sit above zero and print green as momentum builds. When it drops below, they fall under zero and turn red.
Bill Williams designed it this way to show, at a glance, whether short-term momentum is pulling ahead of the longer trend or falling behind it.
One setting note that matters. The awesome oscillator Bill Williams ships with is a 5/34 pairing, a 5-bar fast average against a 34-bar slow one.
When we swept the numbers on gold, the 28-bar slow average came out cleaner. It reacts a few bars earlier to a change in trend and throws fewer false crosses, so every result here uses AO(5,28).
If picking the best-scoring number sounds like curve-fitting, that is a fair worry and exactly the trap to watch for. The check is that this same 28 setting also held up on the recent years the rules were never shaped around, not just the sample it was chosen on.
Keep it at 28 and move on.
The takeaway: the awesome oscillator is momentum, plain and simple. Bars over zero mean the recent push is winning; bars under zero mean it is losing.
The interesting question is what to actually do with that.
Where this signal comes from
Bill Williams was a trader and psychologist who spent years trying to describe markets as something closer to a living thing than a spreadsheet. The awesome oscillator was his way of catching the market’s immediate momentum against its recent momentum, before the candles fully showed it.
His claim was that the histogram reveals the driving force behind a move early. That is a big promise, and the kind I distrust on sight.
A pretty indicator that predicts nothing is the most common thing in this business.
So I did what I do with every clean story. I coded the rules strictly, ran them across eight years of gold, and let the data settle it.
The short version: the signal is real, but only under conditions the textbook never bothers to mention.
The setup that pays: the zero-line cross in a trend
There are a few named signals on this indicator, the zero cross, twin peaks, and the saucer. We ran all of them, and one carried the study clearly, so lead with it.
The awesome oscillator strategy that paid is the zero-line cross taken in the direction of the trend. The rules are short:
- Timeframe: the daily chart. Fewer, cleaner signals that you can manage around a job.
- Regime: only take longs when price closes above its 200-period exponential moving average. The exponential moving average is just a moving average that leans on recent prices, and the 200-line is the standard divider between an uptrend and a downtrend. Above it, you buy dips. Below it, you leave longs alone.
- Entry: buy when the AO histogram crosses from below zero to above it, momentum flipping back to the upside inside that uptrend.
- Stop: two times the average bar size below entry, wide enough to survive gold’s daily noise.
- Target: four times the average bar size, a reward-to-risk of 1:2.
- Exit: the target or the stop closes the trade. If neither is hit within 40 trading days it closes on time, so your capital is never tied up in a stalled position.
That 1:2 is the reward-to-risk ratio, how many times its risk a single trade aims to make back. Risk one unit to make two.
We link the full explainer on reward-to-risk below, because it is the number this whole setup leans on.
Those five lines are the whole base signal. The base numbers below use exactly that, with the 200-EMA regime gate and nothing else.
Two optional confirmations sharpen it, and the charts plot both so you can see them: ADX above 22 (a genuine trend behind the cross) and, the big one, a calm market (its own section shortly). Neither is required to take the trade; each is a filter you can add to raise the quality, and the calm-market filter is the one that matters most.
Here is one of those trades on gold, from the cross to the exit.
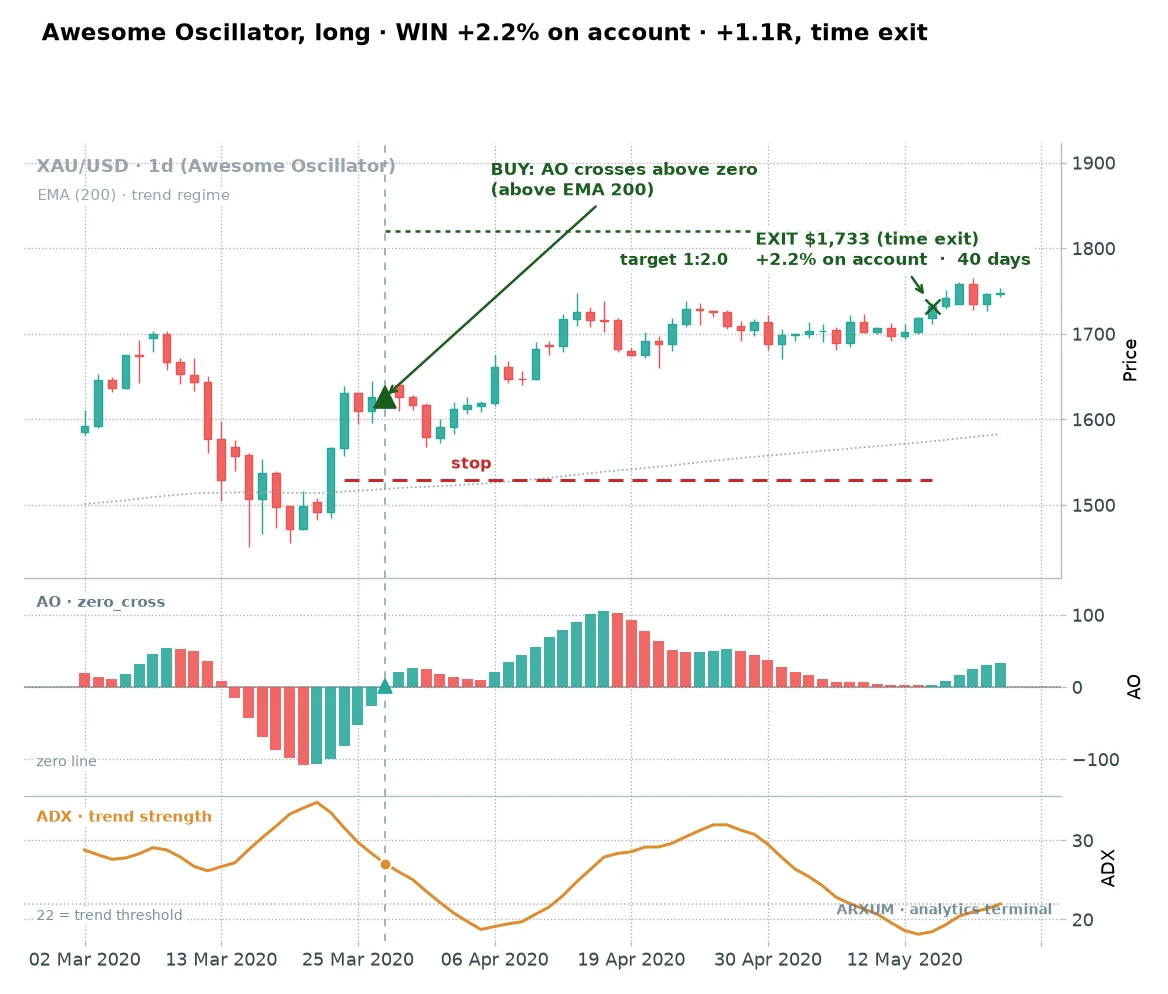
Read the panels together. The dashed vertical line marks the entry bar.
Up top, price is above the dotted 200-EMA, so longs are allowed. In the middle, the AO bars flip from red to green right at that line.
The bottom panel is a new gauge, so meet it before we lean on it. That is the ADX, or average directional index, a measure of how strong a trend is, running from quiet to powerful.
It does not care about direction, only strength. We mark the 22 level because that is where a real trend tends to begin, and it is where the edge showed up in the sweep.
Our full ADX indicator guide covers it in depth.
On this trade, ADX sat above 22 at entry, confirming there was a genuine trend behind the cross, not just a twitch in a flat market. Price climbed for 40 days, and the position closed on a time exit at +2.2% on the account.
Here is a cleaner one, more recent.
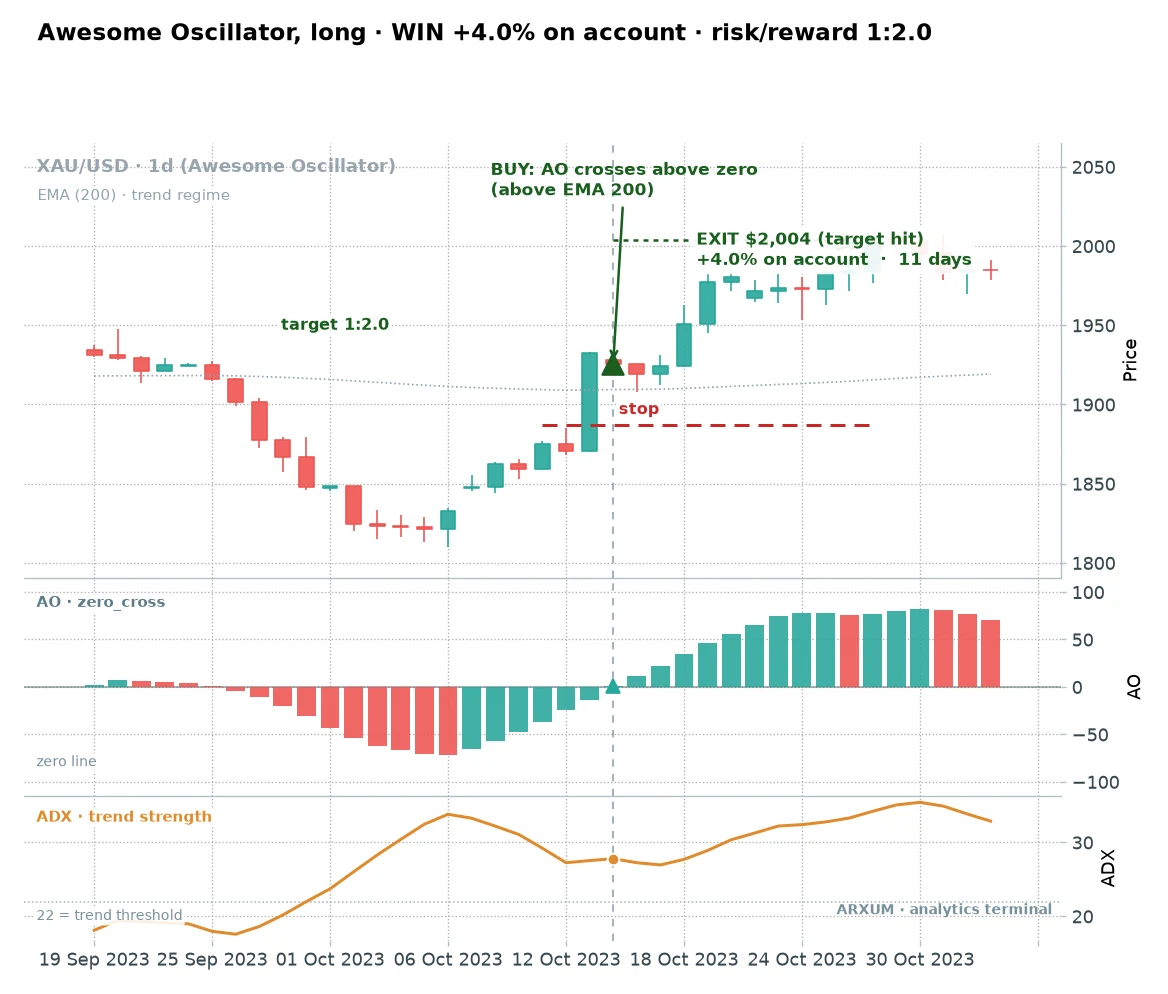
This is the textbook version. Price had pulled back to the 200-EMA, the AO bars were deep red, then they turned and crossed zero as ADX pushed above 22.
The move ran fast. Eleven days later it tagged the four-times-risk target for a full +4.0% on the account.
Not every winner is this tidy, but this is the shape you are hunting: a clean flip into a market that is already trending.
What the zero-cross did over eight years
Two winning trades prove nothing on their own. Here is the whole thing.
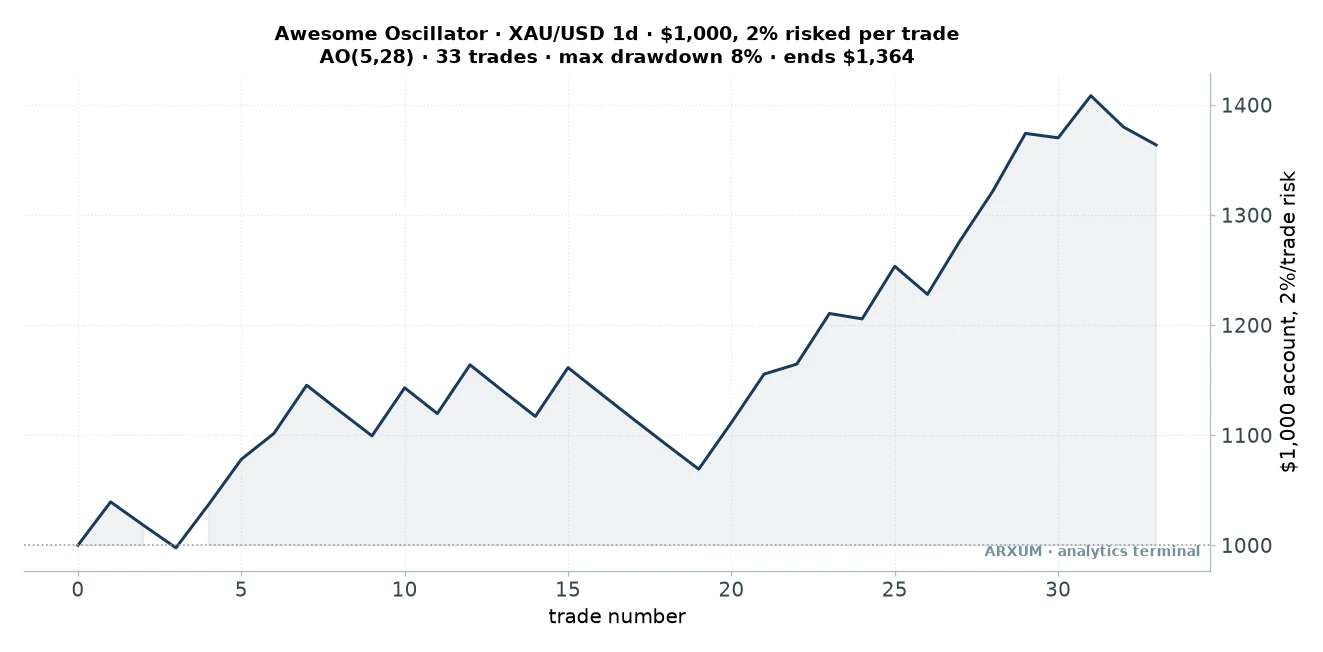
| Trades | 33 |
| Win rate | 51.5% |
| Reward-to-risk | 1:1.76 avg |
| Profit factor | 1.87 |
| Max drawdown | −7.8% |
| Net return on $1,000 | +36% |
The curve is the honest picture, and it reads as $1,000 with 2% of the account risked on each trade. A stop-out costs 2% of the balance; a full-target winner adds about 4%.
Notice how calm the line is. There are flat patches where small stops nibble, then a trend shows up and the account steps higher.
That smoothness is the wide stop doing its job, absorbing gold’s daily chop without getting shaken out.
Two numbers carry this table. The win rate is 51.5%, so the setup wins slightly more than half its trades.
The profit factor of 1.87 is the whole strategy’s dollars won divided by dollars lost, so it made about $1.87 for every dollar the losers cost.
There is one more check worth showing, because it separates a real edge from a curve fit. We split the eight years in half.
On the first four years the profit factor was 1.67; on the most recent four years, data the rules were never shaped around, it was 2.07. An edge that holds up, or even improves, on data it has never seen is one you can lean on.
One that only works on the years you tuned it to is a story, not a strategy.
The filter that more than doubles the edge: a calm market
This is the part the textbook never mentions, and it is the most useful thing in the whole study.
A momentum cross is not equally good in every market. Sometimes gold is trending quietly; sometimes it is thrashing around a news spike.
We sorted every trade by how violent the market was at entry, using the average true range, which is simply the size of a typical bar. A big range means wide, violent candles; a small range means tight, quiet ones.
Split the trades at the middle, calm entries on one side, wild entries on the other, and the gap is stark.
| Market at entry | Trades | Win rate | Profit factor |
| All crosses (no filter) | 33 | 51.5% | 1.87 |
| Calm (range below median) | 16 | 68.8% | 4.63 |
| Wild (range above median) | 17 | 35.3% | 1.02 |
Take the cross only in a calm market and the profit factor jumps from 1.87 to 4.63, with the win rate climbing to 68.8%. Take it in a wild market and you are at 1.02, barely breaking even.
Think about why. The zero-cross wants an orderly resumption of a trend, a quiet pause and then momentum picking back up.
When the range is exploding, that “cross” is often just noise inside a shakeout, and the move fizzles.
So how do you read this on a live chart, without running any numbers? Two ways:
- Watch the candle ranges. When the bars are shrinking and the market feels quiet, that is your green light.
- Watch ATR if your platform plots it. If the ATR line is sitting below its own recent average, conditions are calm. If it is spiking, skip the signal and wait.
The rule to actually use: take the awesome oscillator cross when gold is calm, and pass when it is wild. That one filter does more for the setup than any tweak to the indicator’s settings.
When it fails: a flat, tired market
Honesty beats a clean story, so here is a loss, the same setup that won above.
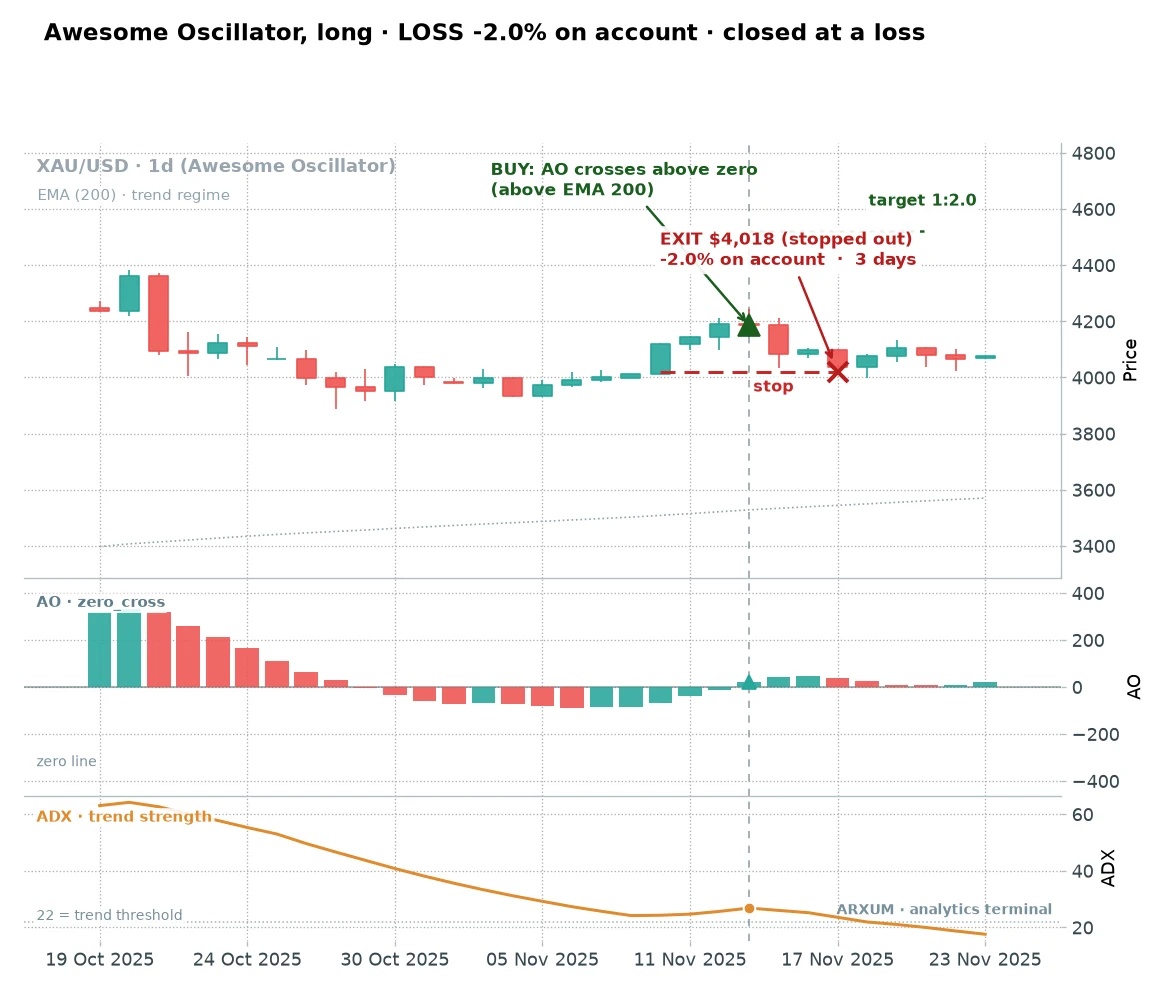
Every box looked ticked. Price was above the 200-EMA, and the AO bars nudged above zero, so the entry fired.
But look closer at the two lower panels. The AO bars around the cross were tiny, hovering right at the line, not the decisive flip you want.
And the ADX was sliding down toward its floor, telling you the earlier trend had run out of steam.
The market had gone sideways after a big run. Three days later the trade hit its stop for a 2% loss.
The tell was there in the weak bars and the fading ADX: this was a resting market, not a fresh trend.
The lesson: the cross is necessary but not sufficient. A limp cross in a flat market is exactly the trade the calm-and-trending filters are built to skip.
The saucer setup, and why it stays on the bench
The zero-cross is not the only signal on this indicator. The saucer is the other one traders reach for: two red bars followed by a green one while the histogram stays on the same side of zero, a faster read on momentum turning.
We ran it the same way, and it works, just not as well.
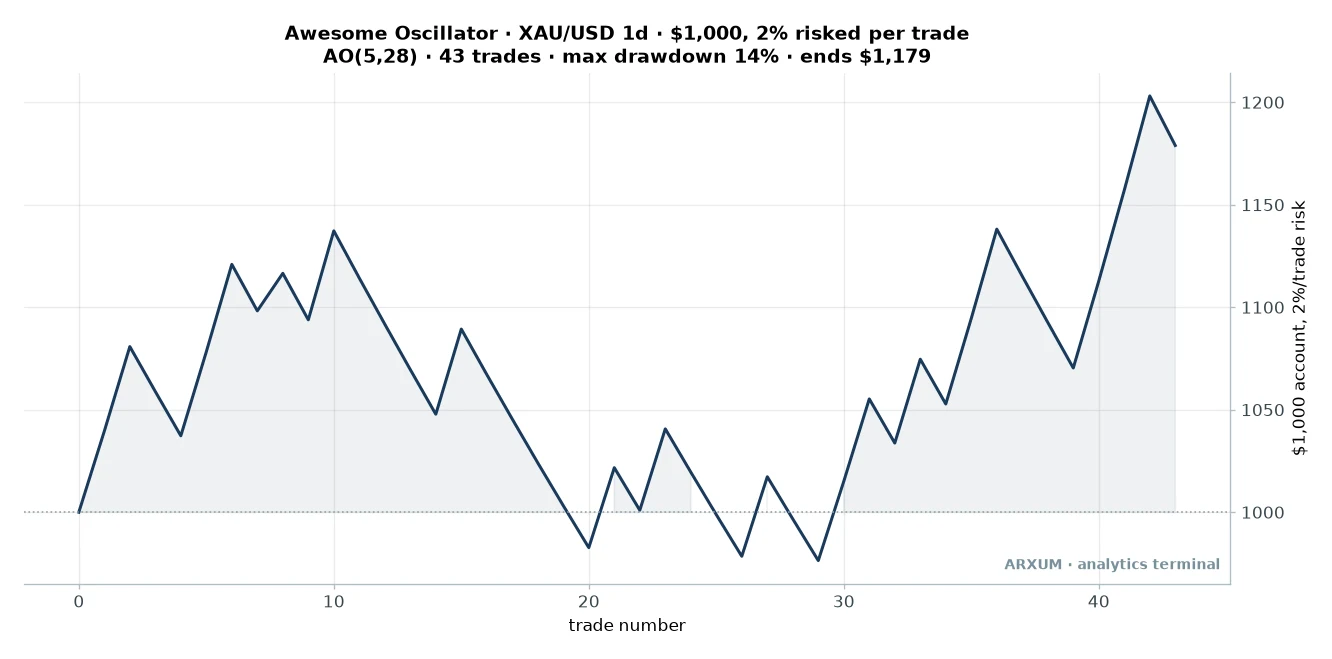
| Trades | 43 |
| Win rate | 41.9% |
| Reward-to-risk | 1:1.67 avg |
| Profit factor | 1.20 |
| Max drawdown | −14.1% |
| Net return on $1,000 | +18% |
More trades, a thinner edge, and nearly double the drawdown. That is a worse deal on every axis that matters.
There is also a red flag under the hood. When we split the saucer’s history in half, the first four years actually lost money, and only the recent stretch pulled it into the green.
A signal that only works on one half of the data is one to treat with suspicion, not to build a plan around.
The takeaway: the saucer is a fine idea and a real alternative, but on gold the zero-cross is simply the better machine. Keep the saucer as a bench player, not your starter.
Long, short, and the trend gate
Direction here is a rule, not a preference. You go long only when price is above the 200-EMA, because a momentum flip means far more when the bigger trend already agrees with it.
The short side is the same idea flipped: sell the cross from above zero to below, with price under the 200-EMA. On gold it was thin.
Most of these eight years were a bull market, so clean downtrends were rare and the short sample came to about a dozen trades, too few to lean on.
For a Forex or CFD trader, a short is just a sell order. There is no borrowing and no special mechanics, the way stock traders sometimes picture it.
When your market spends a stretch below its 200-EMA, the same cross works in reverse.
The rule of thumb: match the tool to the market. The zero-cross is a trend-continuation signal, so it wants a market that is actually trending.
In a long, dead range it hands you a string of small losers, which is the tool telling you to wait, not a flaw to patch with another indicator.
How the awesome oscillator differs from MACD
If this all sounds like the MACD, you are not wrong. Both are momentum histograms built from the difference between two averages.
The difference is what they average. The MACD works off closing prices and defaults to 12 and 26 periods, while the awesome oscillator uses bar midpoints and a 5/34 (here 5/28) pairing.
In practice the awesome oscillator reacts a touch faster and hugs the raw swing highs and lows more closely. If you already run the MACD indicator, treat the AO as a close cousin, not a second opinion, they will often agree.
Profit factor is not reward-to-risk
Two numbers in this article both look like “one-point-something,” and beginners blur them. They answer different questions.
- Reward-to-risk (1:X) is about a single trade. A 1:2 trade risks one unit to make two.
- Profit factor is about the whole strategy. Total dollars won divided by total dollars lost across every trade. Above 1.0 means the system made money overall.
You can have healthy reward-to-risk on each trade and still lose if you win too rarely. The zero-cross wins 51.5% of the time at 1:1.76, and those two together give the 1.87 profit factor.
Watch one without the other and you will fool yourself.
Does the edge actually hold up
A good backtest number can still rest on one or two lucky trades, so I ran the checks I would run on anyone else’s strategy.
- Out-of-sample. The recent four years the rules were never shaped around returned a 2.07 profit factor, stronger than the earlier half. An edge that holds up on data it has never seen is the one worth trusting.
- Drawdown. The worst peak-to-trough dip on the account was about 7.8% across the whole eight years. That is shallow for a strategy that holds trades for weeks at a time.
- Spread of winners. The gains are scattered across gold’s different phases, a crash and its recovery, the long range that followed, and the newer trend. No single moon-shot trade is carrying the result, so losing any one trade barely moves the total.
- High-volume check. We also split the entries by the volume on the trigger bar. The high-volume crosses returned a 0.89 profit factor, the weakest group in the study. Note that gold and most forex platforms record tick-volume, which counts price changes per bar rather than actual contract size, so treat it as a rough proxy, not true traded volume. The finding still holds: a loud, busy bar is not what this signal wants.
Out-of-sample survival plus a shallow drawdown is the line between a real edge that trends amplify and a curve-fit that falls apart the moment the market shifts. This one cleared both.
What a run of these trades feels like
Percentages stay abstract, so picture the shape of it. You take a signal maybe four or five times a year on gold’s daily chart, because a clean cross in a calm uptrend is not a common event.
Out of every ten trades, close to five lose, each costing the 2% you risked. A couple drift to a partial exit on time, and one or two run the full way to the 1:2 target for about 4% each.
That handful is where the profit lives.
It does not feel like steady income. It feels like small, boring losses interrupted now and then by a trade that pays for all of them.
If you cannot sit through the flat stretches, you will not be holding when the trend finally shows up.
That is the real skill here, and it is patience, not chart-reading. The setup does a lot of its work simply by keeping you out.
How to trade it, and the discipline it needs
The rules have been spread across a few sections, so here they are reunited in one place.
- The signal: the AO histogram crosses up through zero while price is above its 200-EMA. That is the only condition you must have.
- The filter that matters: take it only when the market is calm (shrinking candle ranges, ATR below its recent average). This is most of the edge, not an extra.
- Optional confirmation: ADX above 22, a quick check that a real trend sits behind the cross.
- The trade: stop two times the average bar size below entry, target four times it (1:2), and a 40-day time cap. Risk a flat 2% of the account.
Setting it up takes one click. On TradingView, open the indicator search and add “Awesome Oscillator” (it is a Bill Williams built-in), then change the slow length from the default 34 to 28.
On MT4 or MT5 it lives under Insert, then Indicators, then Bill Williams, then Awesome Oscillator. Add an EMA at length 200 and the “Average Directional Index (ADX)” at length 14 in the same way, and you have the full picture on one screen.
Placing the trade is three fields once the cross fires in a calm uptrend:
- Entry: buy at market on the close that confirms the AO bars have crossed above zero.
- Stop-loss: in the stop field, two times the average bar size below entry.
- Take-profit: four times that risk above entry, for the 1:2 target. You can also trail the exit and let a strong trend run.
On sizing, the standard is to risk 2% of the account on any single trade, no more. Gold is expensive, so on a small account the honest position can come out below a broker’s minimum lot; that is a reason to trade a cheaper instrument or find a broker offering fractional or cent-lot sizing, never a reason to widen the stop to “make it fit.”
Here is that sizing worked out, from the account down, because a rule you cannot place is useless.
Say gold trades near $4,150 with an average daily bar around $55. Your two-times-ATR stop is about $110 below entry.
On gold, one micro lot is a single ounce that gains or loses $1 for every $1 gold moves, so one micro lot risks about $110 to the stop. Now the division: on a $1,000 account, 2% is $20 at risk, and $20 ÷ $110 = 0.18 ounces.
That is below the one-ounce minimum, so gold on the daily chart simply does not fit a $1,000 account at 2% risk. That is the honest wall most guides skip.
You have two clean ways past it. On a larger account it fits directly: on about $6,000, 2% is $120, which buys roughly one ounce and risks close to 2%.
The 2% cap, not your broker’s 1:100 leverage, is what bounds the loss; leverage only frees up the cash to hold the position.
Or run the identical rules on a cheaper market. On EUR/USD, say the two-ATR stop works out to about 80 pips.
A pip is the smallest price step on a currency pair, sitting at the fourth decimal place.
A micro lot is worth about $0.10 per pip, so 80 pips risks about $8. The division: $20 ÷ $8 = 2.5 micro lots, which fits a $1,000 account with room to spare.
The setup does not change with the instrument, only the sizing does.
The discipline this setup needs is specific, not boilerplate. You will lose close to half your trades, and they will sometimes come in clusters. Three habits keep that survivable:
- Risk the same 2% every time. Do not size up to win back a loss, and do not size up out of euphoria after a run of wins.
- Use a circuit-breaker. If you take 3 to 6 losses in a row, the market may have stopped trending. Pause for a week and check conditions before the next entry.
- Keep a calm live-versus-history check. One bad week is just variance, so do not panic-quit. A large, sustained gap below what the study showed is a real signal that the regime has shifted, so step back and look at whether gold still suits the tool.
One honest note on returns. Over these eight years, simply holding gold returned far more than the strategy did, because it was one of the great bull runs.
That is bull-market math, not a knock on the setup. What the zero-cross gives you is defined risk and a drawdown near 7.8% against gold’s 26.6%, plus a system that can also go short when the trend flips, which buy-and-hold cannot.
Common beginner mistakes
- Trading every zero-cross. Without the calm-market filter you are back near a 1.87 profit factor at best, and the wild-market crosses drag hard. The filter is most of the edge.
- Chasing the loud breakout. The high-volume crosses were the worst group on gold, a losing 0.89 profit factor. Conviction volume is not the tell here that it is for breakout systems. One caveat: gold and most forex platforms show tick-volume (a count of price changes per bar, not actual contract size), so treat the volume reading as a rough proxy and hold it more loosely when porting this rule to EUR/USD or other pairs.
- Dropping to intraday charts. The bars whip across zero on fast timeframes, and most of those crosses reverse a bar later. You hand your edge to the spread.
- Widening the stop to give it room. The two-ATR stop is the plan. Move it and a clean 2% loss turns into a 5% hole.
- Reaching for the saucer to trade more often. It fires more and earns less, with a deeper drawdown. Boredom is not a strategy input.
Honest scope: read this before you trade it
Every number here comes from one study on one market, so here is exactly what it covers.
- Market: spot gold (XAU/USD) only, on the daily chart. Gold was chosen because it is the cleanest trending market right now, the exact condition this signal likes. The logic is not gold-specific, but the numbers are, so treat other markets as untested until you check them yourself.
- Direction: long-only in the tested window, with the short mirror reported but thin. Gold trended up for most of these years, which flattered the long side.
- Period: eight years to a recent close, covering a crash, a range, and a strong trend. One long window can still flatter a result.
- Execution: entries modeled on the daily close with about 0.04% round-trip fees. Real fills during a volatility spike can be worse, which is one more reason to skip those.
- This is education, not advice. Past results are not future ones, and you should only risk money you can afford to lose.
Where to go from here
The awesome oscillator is one momentum tool among several, and they teach each other. To go deeper on the calm-market filter that powered this whole article, the average true range explainer is the place to start, and the stochastic oscillator guide shows a very different take on reading momentum.
The bottom line: the awesome oscillator zero-cross is a real edge on trending gold, modest on its own and much stronger once you demand a calm market. The signal gets you in the door.
The quiet-market filter is what makes it worth trading.
FAQ
What is the awesome oscillator, in plain terms?
Does the awesome oscillator actually work?
What are the best awesome oscillator settings?
Who created the awesome oscillator?
What is the awesome oscillator zero-line cross strategy?
How is the awesome oscillator different from the MACD?
What timeframe is best for the awesome oscillator?
Why does the awesome oscillator work better in a calm market?
Can I use the awesome oscillator to short?
How much money do I need to trade the awesome oscillator?
What are the key terms in this guide?
Real-time trade setups with entry, stop loss and take profit. Daily market analysis. No subscription, no complicated theory.
🌍 Our recommended brokers


Reader Reviews
Be the first to review this — tell other traders what actually helped, or where it fell short.
Leave a Review

Quant Researcher & Systems Builder
Quantitative researcher who builds the automated systems behind Arxum strategy testing. Works in Python and Pine Script, using AI alongside classic backtesting to validate strategies on years of real data.
