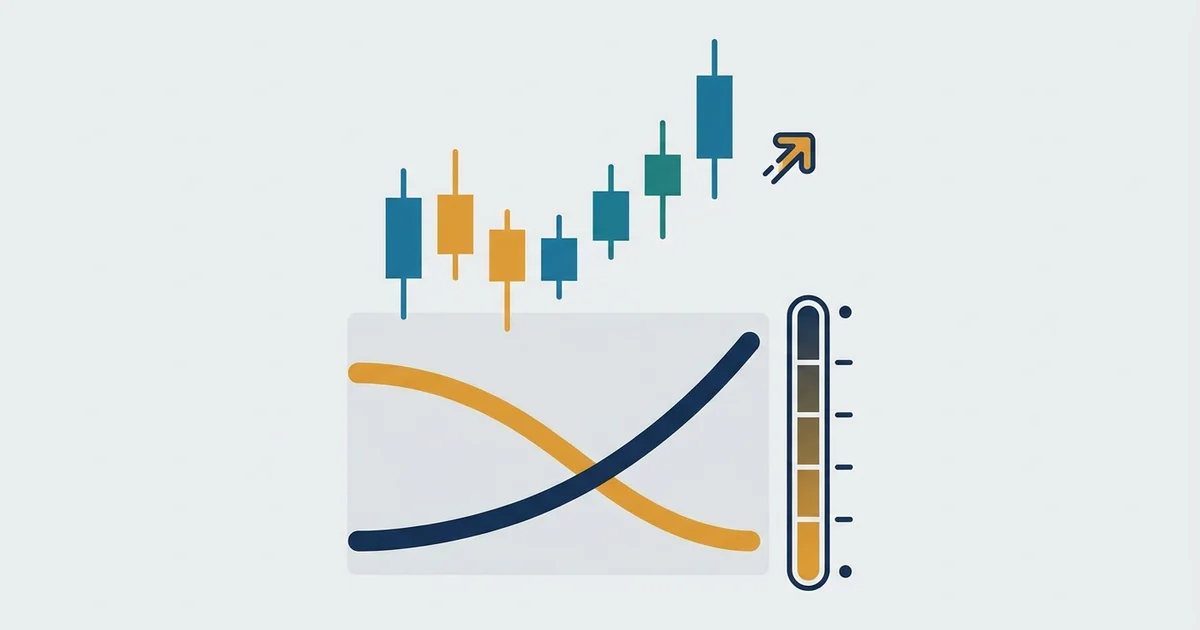

What the Aroon indicator actually measures
Most indicators do math on price. The Aroon indicator does math on time.
It asks one question on every bar. How many bars ago was the highest high, and how many bars ago was the lowest low, inside a lookback window?
- Aroon Up climbs when the newest bar is the highest in the window. A brand-new high pins it at 100.
- Aroon Down climbs when the newest bar is the lowest in the window. A brand-new low pins it at 100.
- Both lines swing inside a fixed 0 to 100 range, so it reads the same on gold as it does on Bitcoin.
A market making fresh highs and no new lows is, by definition, trending up. Aroon just puts a number on it.
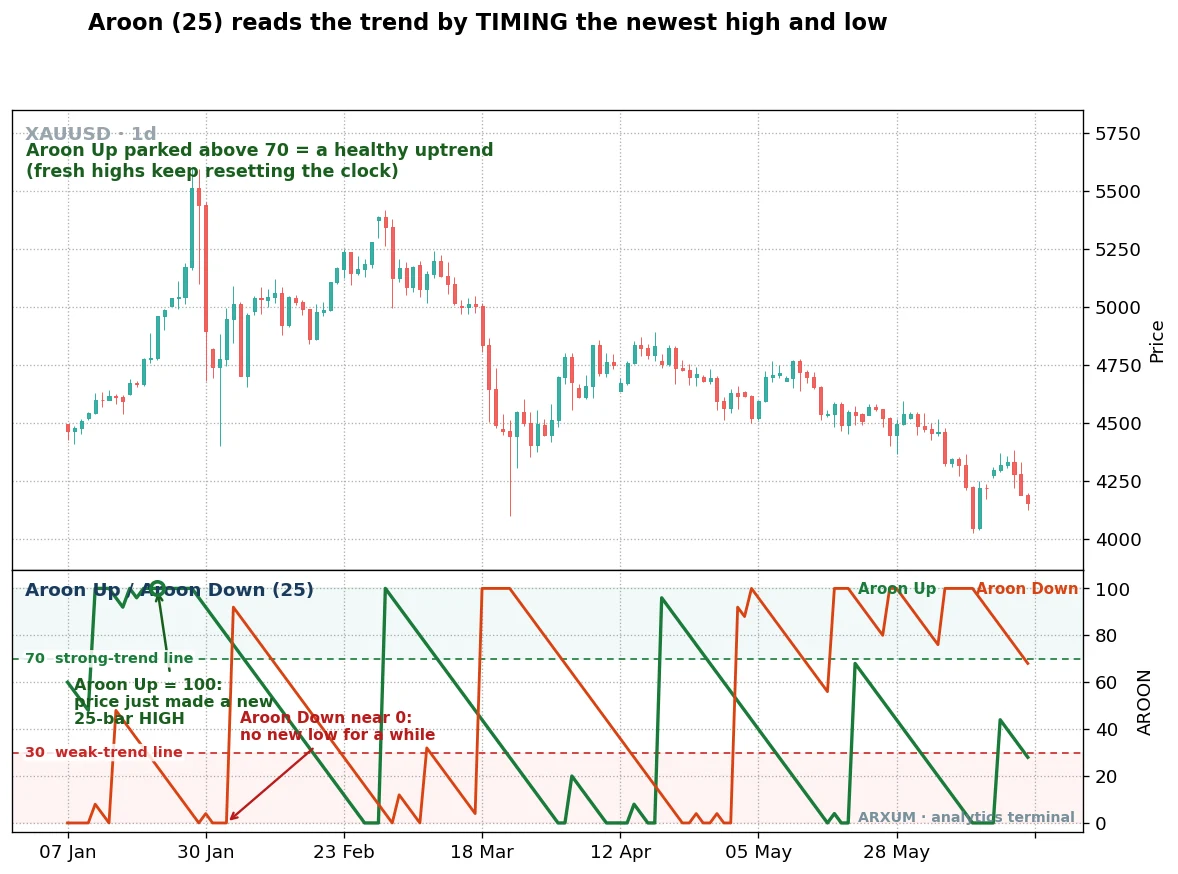
The anatomy chart above uses a 25-bar lookback, the common default. Read it from the bottom panel up.
The green Aroon Up line and the orange Aroon Down line both swing between 0 and 100 as the market trades off fresh highs and lows.
- Aroon Up above 70 (green line parked high) means fresh highs keep resetting the clock. That is a healthy uptrend.
- A reading of 100 means price just printed a new high for the lookback window.
- Aroon Down near 0 means no new low has printed for a while, so sellers are absent.
- The two dashed guides matter: 70 is the strong-trend line, 30 is the weak-trend line.
The one-line read: whichever line is high owns the market, and how high tells you how firmly.
Aroon in one glance
| Part | What it is | Plain read |
|---|---|---|
| Aroon Up | Time since the newest high, scaled 0 to 100 | High value means fresh highs, buyers active |
| Aroon Down | Time since the newest low, scaled 0 to 100 | High value means fresh lows, sellers active |
| 70 line | The strong-trend threshold | A line parked above it means a real trend |
| 30 line | The weak-trend threshold | Both lines below it means no trend, a range |
| Aroon oscillator | Aroon Up minus Aroon Down | One line above or below zero, covered below |
The lookback sets the speed. Most platforms default to 25, some ship 14, and this guide uses 25 to match the charts here.
Shorter lengths react faster and whipsaw more, meaning they fire rapid false signals on small moves. Longer lengths are slower and cleaner, so start at 25 and only shorten it if you trade fast.
The three ways traders actually use Aroon
A single indicator is never one strategy. Aroon splits into three distinct jobs, and each suits different timeframes and instruments.
Here is each one, how it looks, and where it earns its keep.
1. The 70 and 30 threshold read: is there a trend at all
This is the simplest use and the one most worth learning first. You are not hunting an entry here.
You are asking whether the market is trending or drifting sideways, before you pick any strategy.
How it looks:
- One line pinned above 70 while the other sinks under 30 means a strong, one-sided trend.
- Both lines tangled between 30 and 70 means no trend. The market is ranging, and trend tools bleed here.
- Aroon Up touching 100 means price just made a new high for the window. Aroon Down at 100 means a new low.
- A line falling away from 70 back toward the middle is an early warning that the trend is tiring.
This read matches what the ADX indicator does, but Aroon answers a slightly different question. ADX grades raw trend strength with no direction.
Aroon tells you the strength and which side, in one panel.
Application table: the threshold read
| Role | How you use it | Best TF and instrument |
|---|---|---|
| Trend determination | Trade only in the direction of the line above 70 | D1 on gold, H4 on EUR/USD |
| Filter and context | Skip range-bound setups when both lines sit 30 to 70 | H1 and H4 on Forex majors |
| Regime switch | Above 70 use trend tactics, below 30 use range tactics | D1 on Bitcoin and gold |
| Exit cue | Trim or tighten when the leading line drops back under 70 | H4 and D1, any instrument |
On the desk we never called this an entry signal. It is a permission slip that tells you which playbook to open before you look for a trigger.
2. The Aroon crossover: an aroon indicator strategy for direction
The crossover is the classic aroon indicator strategy. When Aroon Down climbs above Aroon Up, control has swapped from buyers to sellers, and the reverse for a rally.
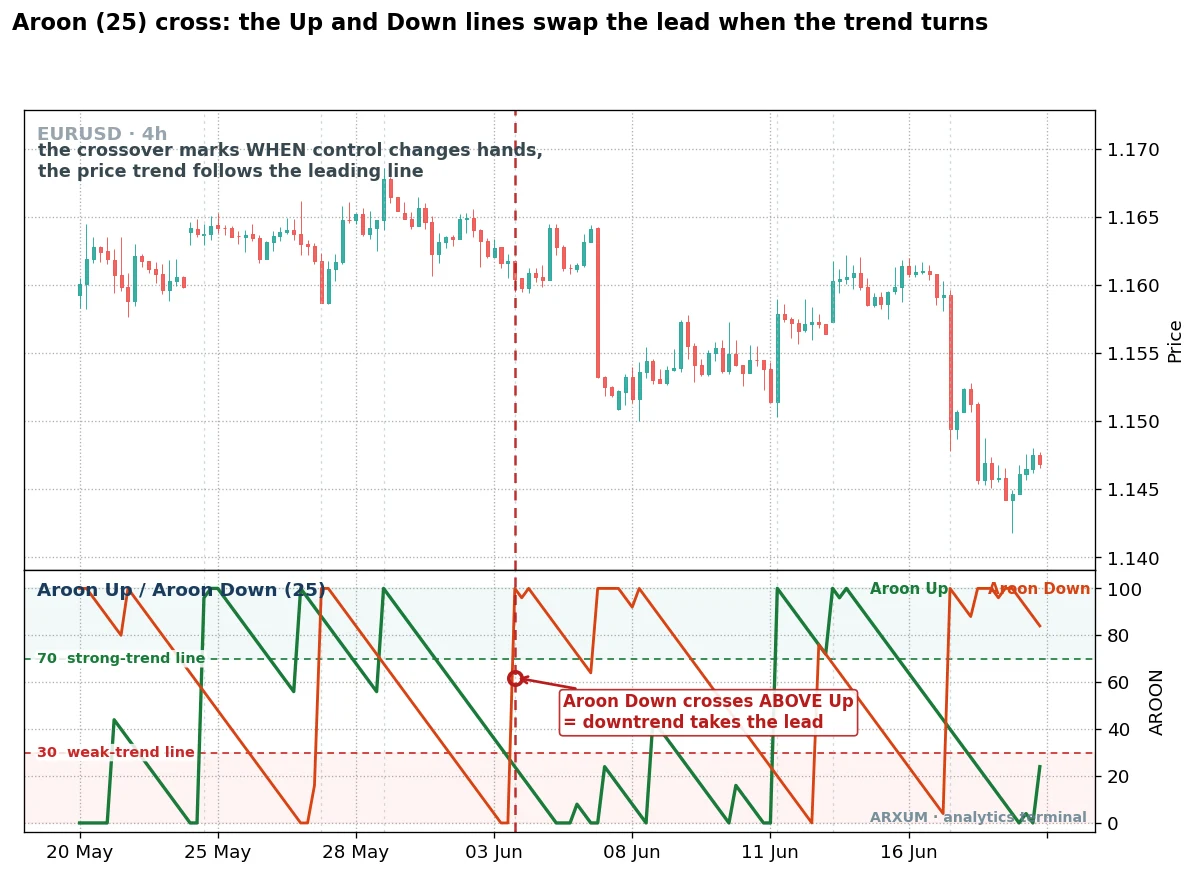
Indicator colors vary by platform and chart theme. Here Aroon Up is green and Aroon Down is orange, and each caption names the colors shown.
Read that EUR/USD chart left to right around the dashed line:
- Before the line: the green Aroon Up line led and price held up.
- At the line: Aroon Down crosses above Aroon Up, the crossover bar.
- After the line: the orange line takes the lead above 70 and the pair drops.
How it looks:
- Bullish cross: Aroon Up rises above Aroon Down. Buyers now set fresh highs faster than sellers set lows.
- Bearish cross: Aroon Down rises above Aroon Up. Sellers take over, as on the chart above.
- The cleanest crosses happen when the winning line then pushes above 70 and the loser falls toward 0.
- A cross where both lines stay bunched in the middle is noise, not a trend change.
The catch, stated plainly: a bare crossover fires on every wiggle in a range, so it is best paired with the threshold read from use one.
Take the cross only when the new leader clears 70. That single filter throws out most of the false starts.
Application table: the crossover
| Role | How you use it | Best TF and instrument |
|---|---|---|
| Entry trigger | Enter on the cross, but only if the new leader clears 70 | H4 and D1 on gold and EUR/USD |
| Direction call | Long while Up leads, short while Down leads | D1 on Bitcoin, GBP/USD |
| Trend confirmation | Confirm a breakout when the cross agrees with it | H1 and H4 on Forex majors |
| Avoid | Do not trade raw crosses in a flat range | Any low-volatility session |
3. The Aroon oscillator: one line, zero as the pivot
The aroon oscillator folds the two lines into one. It is simply Aroon Up minus Aroon Down.
The result swings positive and negative and pivots on a zero line.
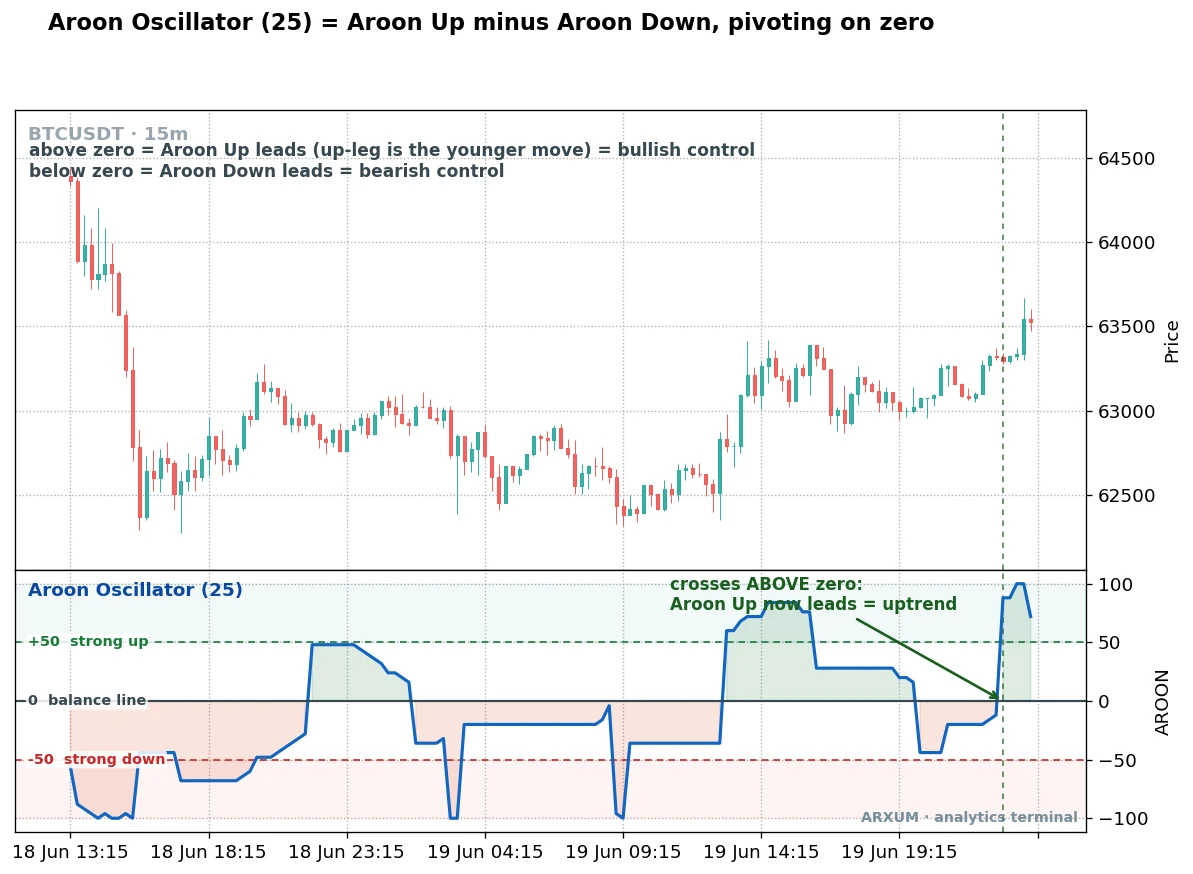
Read the Bitcoin panel simply. Above the zero line buyers lead, and below it sellers hold the market.
How it looks:
- Above zero: the up-leg is the younger move, so the read is bullish. Deeper above +50 means a firm uptrend.
- Below zero: Aroon Down leads and the read is bearish. Under -50 is a firm downtrend.
- A cross back above zero, as the arrow marks on the chart, is the moment control flips to the buyers.
- The line snaps between extremes on a fast timeframe like the 15-minute, so it is busiest, and noisiest, intraday.
The oscillator is the cleanest of the three to eyeball because there is only one line and one level that matters. That makes it a natural second indicator sitting under a price chart, rather than a standalone system.
Application table: the aroon oscillator
| Role | How you use it | Best TF and instrument |
|---|---|---|
| Momentum confirmation | Take price signals only when the oscillator agrees | H4 and D1 on gold, EUR/USD |
| Second indicator | Pair it under a price setup as a trend check | H1 on Forex, D1 on Bitcoin |
| Zero-line trigger | Enter on the cross of zero in the trend direction | H4 and D1, trending markets |
| Filter | Ignore longs while the line is below zero | Any instrument, any TF |
Which Aroon use fits which market
The three uses are not rivals. You pick by what you are trying to do and how fast you trade.
This table is the whole guide in one place.
| Aroon use | What it answers | Strength | Weakness | Fits best |
|---|---|---|---|---|
| Threshold read (70 and 30) | Is there a trend, and which way | Simple, hard to misread | Not an entry on its own | D1 swing trading, gold and Forex |
| Crossover | When did control change hands | Clear entry direction | Fires in ranges without a filter | H4 to D1 trend trades |
| Oscillator | How firm is the current trend | One clean line, easy confirm | Noisy on fast timeframes | Confirmation on any TF |
A few plain rules of thumb drawn from that table:
- Slower is safer with Aroon. All three uses read cleaner on H4 and D1 than on the 15-minute, where fresh highs and lows churn constantly.
- Gold and index-style trends suit it. A market that runs in long one-way legs keeps one line pinned high, which is exactly what Aroon rewards.
- Ranging Forex sessions punish it. The quiet hours between London and New York chop both lines into the middle band, and every use gives false reads there.
- Bitcoin cuts both ways. Its big daily trends are ideal for the threshold read, but its intraday noise makes the crossover unreliable below H1.
Pairing Aroon with a price signal
Aroon shines as the confirming second indicator rather than the trigger. It answers “is this a trend” while another tool answers “where do I act”.
A few pairings that fit its strengths:
| Pair Aroon with | Aroon’s job | What the pair looks for |
|---|---|---|
| A moving average | Confirm the trend direction | Price above the average and Aroon Up above 70 both confirm the long |
| A breakout level | Confirm the break has legs | A close through the level while the oscillator crosses above zero |
| A pullback setup | Confirm the trend is intact | Price dips in an uptrend while Aroon Up stays above 70 |
| Support and resistance | Filter which side to trade | Trade bounces only in the direction of the leading line |
The rule across all four is the same. Let price or a level pick the moment, and let Aroon confirm the market is actually trending before you commit.
On the desk that division of labour, a trigger plus a trend filter, is how these tools were meant to be used.
How to add Aroon to your charts
You do not need a paid tool. Here is the exact recipe so your chart matches the ones above.
| Platform | What to add | Setting |
|---|---|---|
| TradingView | Search indicators for “Aroon” | Length 25 for the two lines |
| TradingView | Search for “Aroon Oscillator” for the single line | Length 25 |
| MetaTrader 4 and 5 | No built-in Aroon ships with the platform | Add a free custom Aroon from the MQL5 code base |
Two honest notes on setup:
- On TradingView the plain “Aroon” plots Aroon Up and Aroon Down, and the “Aroon Oscillator” is a separate one-line indicator, so add whichever use you want.
- MetaTrader has no native Aroon at all, which surprises people, so you install a community indicator rather than hunting a menu that does not exist.
For a trailing trend tool that behaves similarly but plots on price instead of in a panel, the Parabolic SAR and the Supertrend are worth a look. And if you like trading fresh highs and lows directly, the Donchian channel draws them straight on the chart.
What works: the three things to remember
If you keep only three points from this guide, keep these.
- Aroon grades a trend by timing. A line above 70 means fresh highs or lows keep coming, which is a real trend. Both lines in the middle means no trend, so stand down.
- The crossover needs a filter. Take the cross only when the new leader clears 70, or the range will hand you a string of losing signals.
- Match the speed to the tool. Aroon is a swing trader’s read. On H4 and D1 it is clean, and the faster you go the more it whipsaws.
Aroon will not call a top or a bottom, and it lags a sharp reversal like any trend tool. Used for what it is good at, spotting a trend early and grading its strength, it is one of the more honest gauges on the menu.
Pair it with a price signal and a look at the indicators that suit your timeframe, and it earns a place on the chart.
FAQ
What is the Aroon indicator, in plain terms?
Does the Aroon indicator actually work?
What is the best timeframe for Aroon?
What is the difference between Aroon and ADX?
What is the Aroon oscillator?
What settings should I use for the Aroon indicator?
How do I trade the Aroon crossover?
Which markets suit the Aroon indicator best?
Can I use Aroon on its own?
Is Aroon a leading or lagging indicator?
What do the key Aroon terms mean?
Real-time trade setups with entry, stop loss and take profit. Daily market analysis. No subscription, no complicated theory.
🌍 Our recommended brokers


Reader Reviews
Be the first to review this — tell other traders what actually helped, or where it fell short.
Leave a Review

Forex Analyst & Senior Trader
Former FX desk trader with 8 years in institutional forex. Works in multi-timeframe analysis and order flow, turning desk experience into systematic, testable rules across forex and metals.
