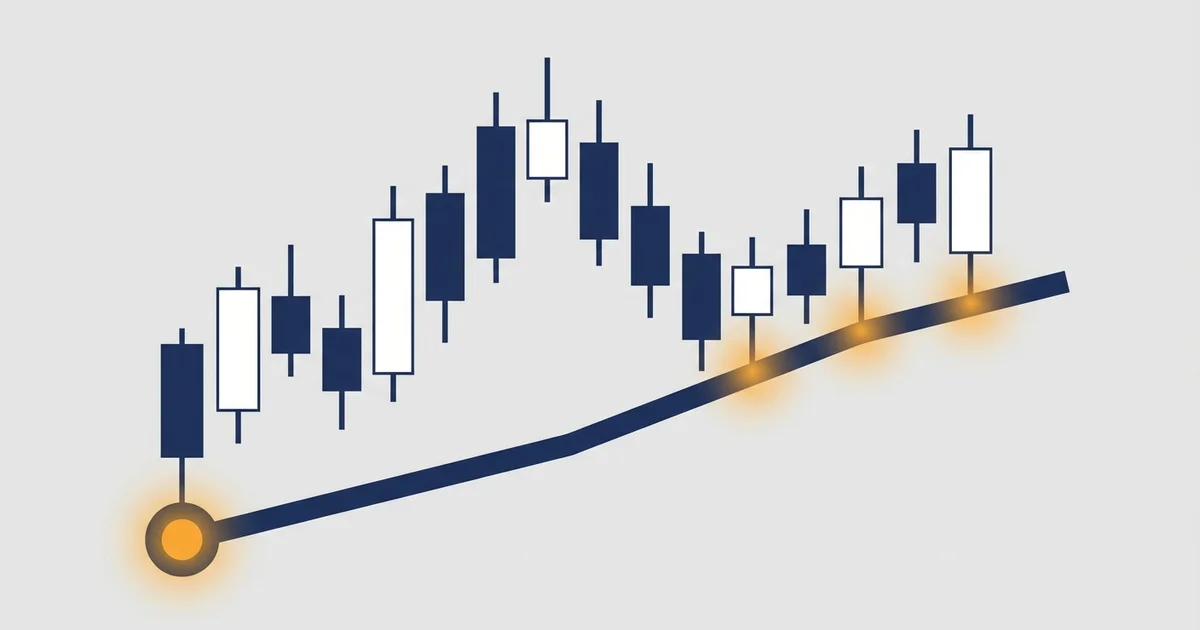

What anchored VWAP actually is
Regular VWAP answers “what is the average price today”. Anchored VWAP answers “what is the average price since the event that actually mattered”.
You place the anchor yourself, and the line builds forward from that single bar.
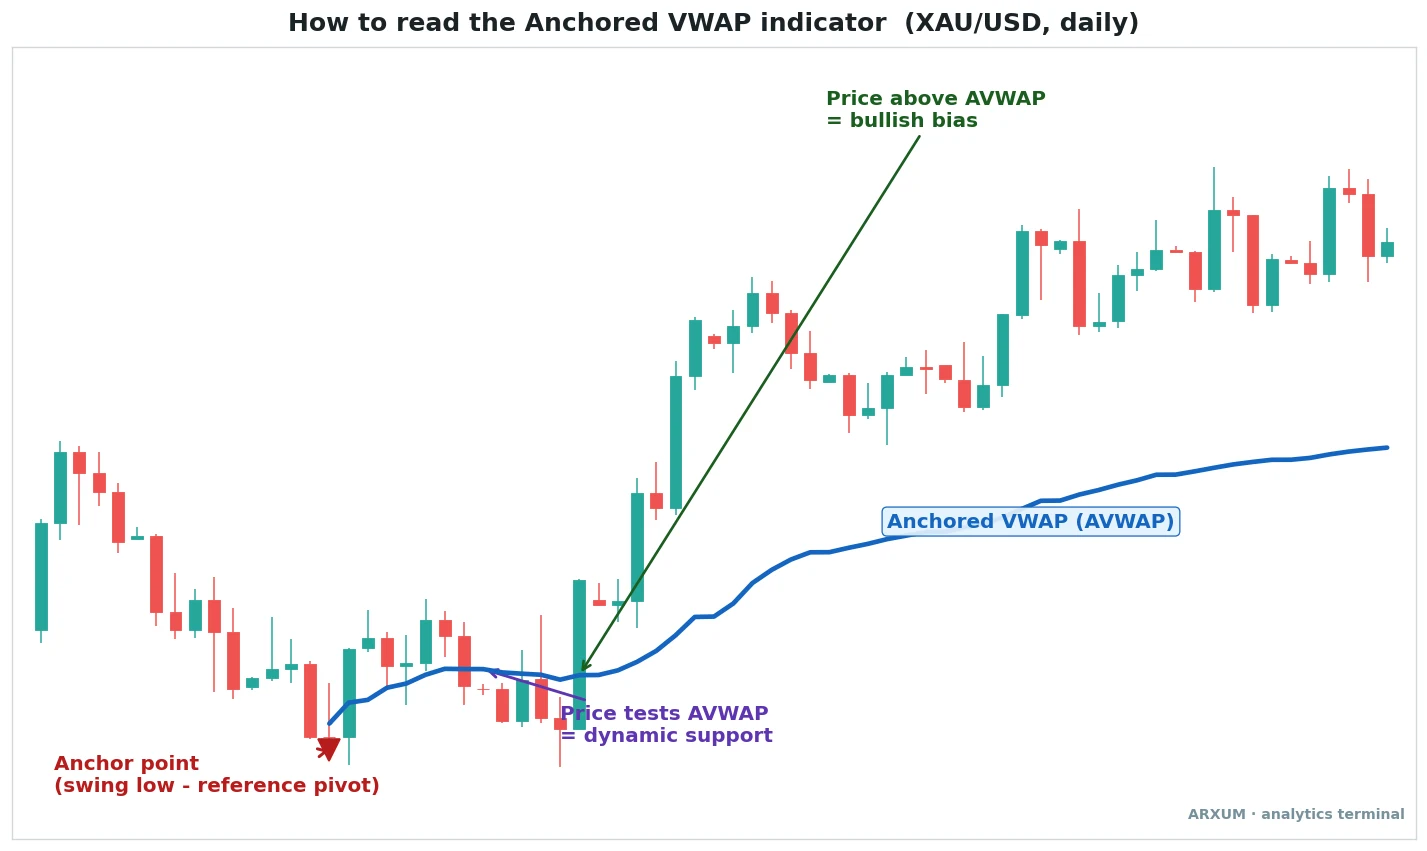
Read the gold chart above from the anchor outward, not left to right like a normal indicator.
- The anchor point is the red marker at the swing low. That single bar is where the calculation starts.
- The blue AVWAP line is the volume-weighted average price of every bar since that low.
- Price above the line means buyers who entered after the anchor are, on average, winning. That is the bullish bias label.
- The dip that holds the line is AVWAP working as dynamic support, a moving floor that rises with the trend.
The key idea is that the line is not a moving average. It weights each price by how much volume traded there, so heavy-volume bars pull it harder than quiet ones.
Anchored VWAP in one glance
| Part | What it is | Plain read |
|---|---|---|
| Anchor point | The bar you start the line from | A pivot that mattered, a high, low or event |
| AVWAP line | Volume-weighted average since the anchor | The break-even price for everyone since then |
| Price above line | Market trades over the average | Bullish bias, buyers in control |
| Price below line | Market trades under the average | Bearish bias, sellers in control |
| Test of the line | Price returns to touch it | Dynamic support or resistance, watch the reaction |
Because it is volume-weighted, AVWAP means more on markets with real volume data. Spot Forex volume is only tick-count, so treat a Forex AVWAP as a good approximation rather than exact.
Anchored VWAP vs session VWAP
The two look identical on the chart, one line hugging price. The difference is entirely in where the line starts.
| Feature | Session VWAP | Anchored VWAP |
|---|---|---|
| Start point | Automatic, the session open | Manual, a bar you pick |
| Resets | Every new session | Never, until you move it |
| Best for | Intraday day trading | Swing trading, multi-day trends |
| What it tracks | Today's fair value | Fair value since a key event |
| Main use | Intraday mean reversion | Dynamic support and resistance |
- Session VWAP is the day trader’s tool. It resets each morning and marks whether price is rich or cheap for the day.
- Anchored VWAP is the swing trader’s tool. It ignores the calendar and tracks one story, the move since the anchor.
- For the full mechanics of the standard version and an intraday VWAP trading strategy, the session guide covers it. This piece stays on the anchored kind.
The one-line difference: session VWAP asks about today, anchored VWAP asks about the move you care about.
Where to drop the anchor
The whole tool lives or dies on the anchor choice. A random anchor gives a meaningless line, a meaningful pivot gives a meaningful line.
These are the anchor points traders actually use.
| Anchor here | Why it matters | The AVWAP then reads |
|---|---|---|
| A major swing low | Where a rally began | Support under an uptrend |
| A major swing high | Where a decline began | Resistance over a downtrend |
| A big news event | A repricing everyone saw | The post-news break-even level |
| An all-time high or low | A reference the whole market knows | The line trapped longs watch |
| A gap or breakout bar | The start of a new leg | Whether the leg is still healthy |
Two rules of thumb keep the anchor honest:
- Anchor to something obvious. If you have to hunt for the pivot, so did everyone else, and a level nobody watches has no power.
- Anchor to the start of the move you are trading. Swing traders anchor to the last major swing low or high, so the line grades the current leg, not ancient history.
The three ways traders use anchored VWAP
AVWAP is not one strategy, it is one line put to three jobs. Each suits a different question and a different timeframe.
Here is each use, what it looks like, and where it earns its place.
1. Dynamic support and resistance
This is the core anchored VWAP strategy, and the one to learn first. In a trend the line becomes a moving level price keeps returning to.
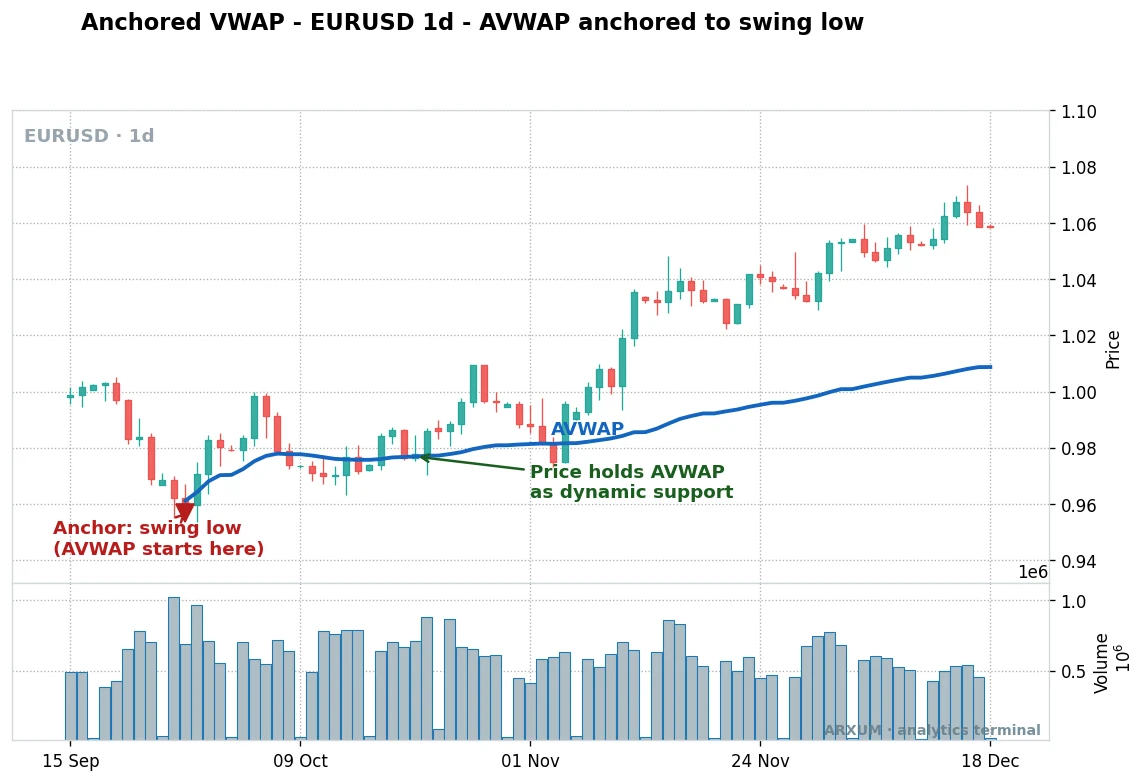
On the EUR/USD chart, the line is anchored to the swing low, then it rises with the trend.
- In an uptrend, anchor to the swing low. The line rises underneath and each pullback that holds it is a support test.
- In a downtrend, anchor to the swing high. The line falls overhead and each bounce that fails there is a resistance test.
- A hold is a bounce off the line without a clean break, which keeps the bias intact.
- A decisive close through the line is the warning that the average trader since the anchor has flipped from winning to losing.
Bitcoin shows the resistance side of the same idea. Here the anchor sits on a swing high, so the line caps price from above.
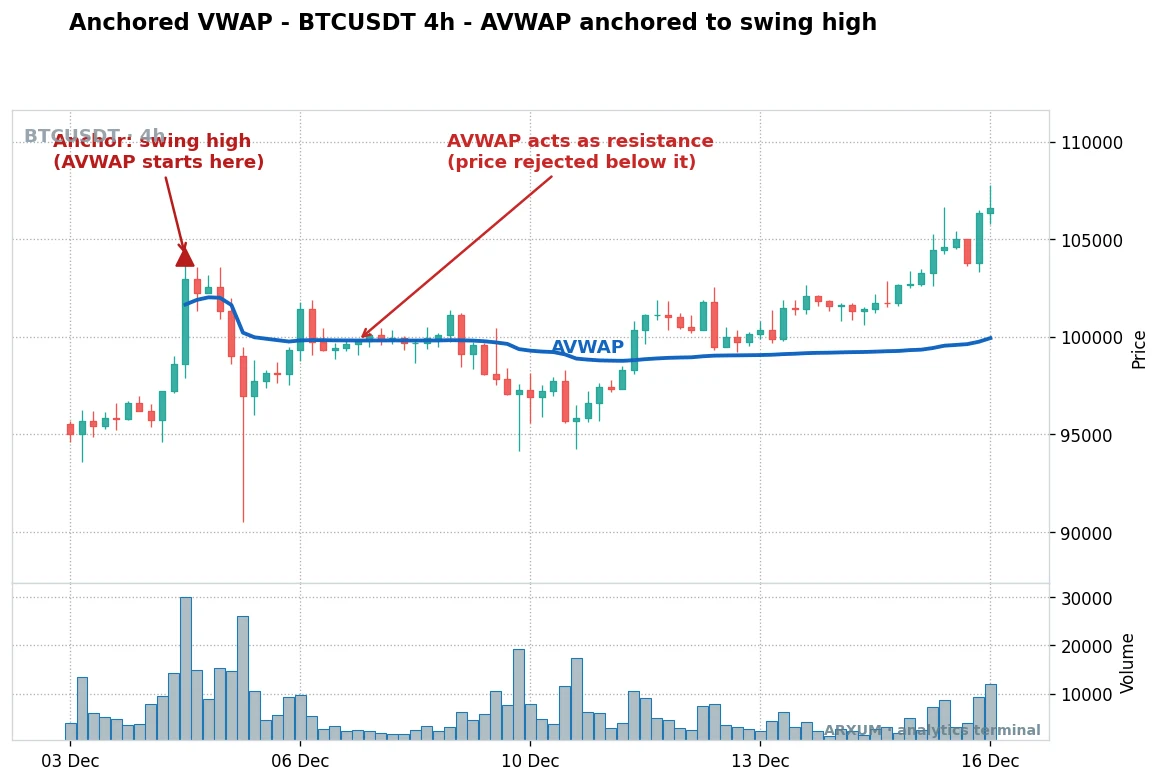
The catch, stated plainly: in a flat, choppy range price criss-crosses the line and every touch looks like a level. AVWAP shines in a trend and misfires in a chop, so pair it with a read of whether the market is trending at all.
Application table: dynamic support and resistance
| Role | How you use it | Best TF and instrument |
|---|---|---|
| Trend read | Above the line is a long bias, below it a short bias | D1 on gold, H4 on EUR/USD |
| Entry zone | Buy the pullback that holds the rising line in an uptrend | H4 and D1 on gold, EUR/USD |
| Filter | Skip the level when the market is ranging, not trending | Any low-volatility session |
| Exit cue | Trim or exit on a decisive close back through the line | H4 and D1, any instrument |
2. The break and retest
The second use waits for price to break through the AVWAP, then come back to test it from the other side. A level that used to be resistance becoming support is a classic breakout tell.
How it looks:
- Price is capped under a falling AVWAP anchored to a swing high, then closes firmly above it.
- Instead of chasing, you wait for price to dip back to the line.
- The line that was resistance now holds as support, which confirms the break was real.
- The same works in reverse, a break down through a rising line, then a failed retest from below.
Why it beats chasing: the retest gives you a defined level to lean a stop against, so the trade has a clean risk point rather than a guess. This is where matching the setup to a proper risk-reward ratio gets easy.
Application table: the break and retest
| Role | How you use it | Best TF and instrument |
|---|---|---|
| Entry trigger | Enter on the retest that holds, not on the first break | H4 and D1 on gold, BTC |
| Confirmation | The old resistance turning into support confirms the move | H4 on EUR/USD, BTC |
| Stop reference | Rest the stop just past the retested line | Any trending instrument |
| Avoid | Do not trade the break with no retest in a choppy tape | Range-bound sessions |
3. Multi-anchor confluence
The third use plots two or more AVWAP lines from different anchors. Where they stack up, the level carries more weight, a simple form of confluence.
How it looks:
- One line anchored to a recent swing low, another to the year’s low or an all-time high.
- When both lines land at roughly the same price, that zone is where two different groups of traders share a break-even.
- Price reacting at that overlap is a stronger signal than a reaction at a single line.
- A gap between the lines is a low-conviction zone, so you wait for price to reach the cluster.
The honest limit: more lines is not automatically better. Two well-chosen anchors beat five random ones, and a screen full of lines just hides the one that matters.
Application table: multi-anchor confluence
| Role | How you use it | Best TF and instrument |
|---|---|---|
| High-conviction zone | Trade reactions where two anchors overlap | D1 on gold, BTC |
| Second gauge | Confirm a support level a single line already flags | H4 and D1, Forex majors |
| Context | Read the gap between lines as a no-trade zone | Any instrument |
| Filter | Skip a lone line when a nearby overlap is the real level | Swing timeframes |
Which anchor and which use fits which market
The three uses are not rivals, you pick by what you are trying to do. This table is the whole guide in one place.
| Use | What it answers | Strength | Weakness | Fits best |
|---|---|---|---|---|
| Support and resistance | Where does the trend pull back to | Simple, one line, one read | Misfires in a range | D1 swing trades, gold and Forex |
| Break and retest | Was the breakout real | Clean stop level | Needs patience for the retest | H4 to D1 trend trades |
| Multi-anchor confluence | Which level matters most | Higher-conviction zones | Clutters the chart if overdone | D1 on gold and BTC |
A few plain rules of thumb drawn from that table:
- Anchored VWAP is a swing trader’s tool. It reads cleaner on H4 and D1 than on fast intraday charts, where the anchor gets buried in noise.
- Trending markets suit it. Gold in a long one-way run keeps price on one side of the line, which is exactly what AVWAP rewards.
- Ranges punish it. When price chops sideways it crosses the line constantly, and every crossing looks like a level that is not there.
- Volume quality matters. Crypto and futures report real volume, so the line is exact. Spot Forex uses tick volume, so read it as a close approximation.
Pairing anchored VWAP with a price signal
AVWAP works best as the level, with another tool picking the moment. It answers “is this a real support” while a trigger answers “do I act now”.
| Pair AVWAP with | AVWAP's job | What the pair looks for |
|---|---|---|
| A candlestick signal | Mark the level | A pin bar or engulfing bar right at the line |
| Support and resistance | Add a dynamic level | A static level and the AVWAP lining up together |
| A momentum read | Confirm the trend | Price holding the line while momentum agrees |
| A breakout level | Time the retest | A break of structure that retests the AVWAP |
The rule across all four is the same. Let AVWAP mark the level and let a price signal or a static support and resistance level pick the trigger.
How to anchor VWAP in TradingView
You do not need a paid plan. The tool is built in, but the exact name trips people up, so here is the recipe.
| Platform | What to add | Then |
|---|---|---|
| TradingView | Search indicators for "Anchored VWAP" | Click the anchor bar on the chart to set the start |
| TradingView | Do not use plain "VWAP", it resets each session | The anchored version is a separate tool |
| MetaTrader 4 and 5 | No native anchored VWAP ships with either | Add a free anchored VWAP from the MQL5 code base |
Two honest notes on setup:
- On TradingView the plain “VWAP” and the “Anchored VWAP” are two different indicators. Only the anchored one lets you click a bar to set the anchor.
- MetaTrader has no built-in anchored VWAP, which surprises people, so you install a community script rather than hunting a menu that is not there.
To place the anchor, add the tool, then click the swing high or swing low you want the line to start from. Move the anchor any time by dragging it to a new bar.
What works: three things to remember
If you keep only three points from this guide, keep these.
- The anchor is everything. A line from a pivot the whole market watches has power, a line from a random bar is noise. Anchor to obvious swing highs, swing lows and events.
- Above is bullish, below is bearish. Price over the AVWAP means the average trader since the anchor is winning. A decisive close through the line is the flip worth acting on.
- It is a trend tool, not a range tool. In a clean trend AVWAP is a moving support or resistance you can trade. In a chop it crosses price constantly and gives false levels.
Anchored VWAP will not call a top or a bottom, and it lags a sharp reversal like any level-based read. Used for what it is good at, grading a trend from a pivot that mattered, it is one of the more honest lines you can put on a chart.
Pair it with a trigger and a look at the standard session VWAP for intraday work, and it earns a place on the chart.
Glossary: the key anchored VWAP terms
- Anchored VWAP (AVWAP): the volume-weighted average price of every bar since a chosen anchor point.
- VWAP: volume-weighted average price. The standard version resets each session.
- Anchor point: the single bar you start the line from, usually a swing high, swing low or event.
- Dynamic support: a rising level that price pulls back to and holds inside an uptrend.
- Dynamic resistance: a falling level that caps price inside a downtrend.
- Break and retest: price breaks through the line, then returns to test it from the other side before continuing.
- Confluence: two or more independent levels landing at the same price, which strengthens the signal.
- Tick volume: a count of price changes used as a volume stand-in on spot Forex, where real volume is not reported.
FAQ
What is anchored VWAP, in plain terms?
What is the difference between anchored VWAP and VWAP?
How do you use anchored VWAP?
Where should I place the anchor point?
What is the best timeframe for anchored VWAP?
Does anchored VWAP work on Forex?
How do I anchor VWAP in TradingView?
Is anchored VWAP good for swing trading?
Can I use anchored VWAP on its own?
What does it mean when price crosses anchored VWAP?
Real-time trade setups with entry, stop loss and take profit. Daily market analysis. No subscription, no complicated theory.
🌍 Our recommended brokers


Reader Reviews
Be the first to review this — tell other traders what actually helped, or where it fell short.
Leave a Review

Quant Researcher & Systems Builder
Quantitative researcher who builds the automated systems behind Arxum strategy testing. Works in Python and Pine Script, using AI alongside classic backtesting to validate strategies on years of real data.
