Breakout trading means entering when price closes decisively beyond a key level: a resistance zone, support floor, trendline, or chart pattern boundary. The goal is to ride the initial expansion of a new trend before the majority of traders recognize the move. Done correctly, breakout trading delivers the highest R:R entries on a chart. Done wrong, it places you on the wrong side of a fakeout that reverses within two candles. The difference comes down to three factors: where the level sits (institutionally significant rather than arbitrary), what the breakout candle looks like (strong close, wide range, no opposing wick), and whether the broader context supports continuation (ATR above its 20-period average, clean chart space ahead). After 8 years watching institutional order flow, I can tell you that most retail breakout entries fire too early. The real edge is in confirming the candle close, calculating the measured move target, and knowing which sessions produce lasting breakouts rather than liquidity sweeps.
Why breakout trading attracts serious traders
Breakout trading is the closest retail traders get to entering where institutions do. When price clears a major resistance level, it often triggers a cascade: stop-loss orders above resistance flip to market-buy orders, and momentum-following algorithms pile in. The result is the kind of clean, sustained directional move that turns a modest risk setup into a significant gain.
On the desk, I watched this happen on EUR/USD dozens of times. A level held for three weeks. Then one session, usually London or New York, the level broke decisively on expanding range, and the pair ran 80, 100, 120 pips in a single day. Those entries look obvious in hindsight. In real-time, the challenge is knowing whether you are at the start of a genuine breakout or a liquidity grab designed to trigger stops before reversing.
The answer lies in preparation. Breakout trading rewards patience more than speed.
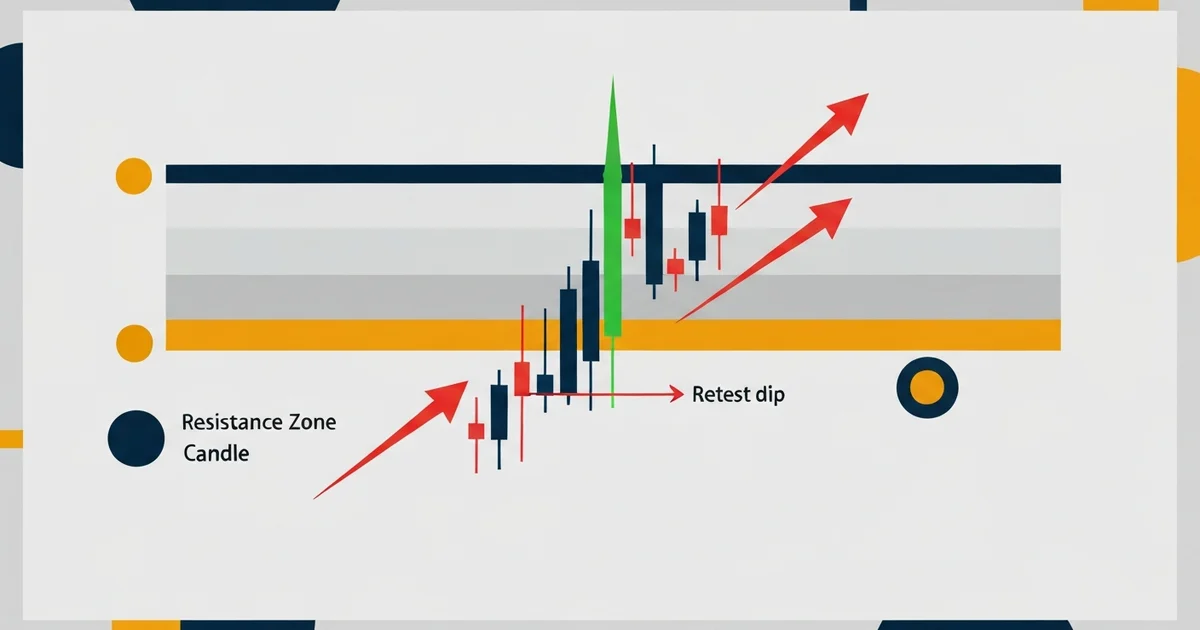
The anatomy of a valid breakout
A breakout is only as good as the level it breaks. Level quality determines whether you are trading a genuine shift in supply and demand or reacting to noise.
Level quality signals:
- Prior tests: the more times price tested and rejected a level, the more significant the eventual break
- Time at level: a level that held for 2-4 weeks carries more weight than one that formed 3 days ago
- Round numbers: institutional orders cluster at psychological levels (1.1000, 1.1050 on EUR/USD)
- Pattern confluence: when a level also marks the neckline of a head and shoulders or the upper boundary of a triangle, its significance compounds
Once you have a quality level, assess the breakout candle itself.
- Candle CLOSES above resistance (or below support), not just wicks through
- Wide-range candle body, at least 1.5× the 14-period ATR for that session
- Close in the upper 25% of the candle range (bullish) or lower 25% (bearish)
- Follows a compression period. Expansion from tight price action is more reliable than a random spike
- Occurs during a high-liquidity session: London (07:00–10:00 UTC) or New York (13:00–16:00 UTC)
A breakout that satisfies four of these five criteria is worth trading. Three or fewer, wait for better structure.
How to enter a breakout trade
The single biggest mistake in breakout trading is entering on the candle that first breaches the level. That candle has not closed yet. It may wick through and close back inside the range — a classic fakeout pattern.
Entry method 1: Close confirmation
Wait for the candle that breaks the level to fully close. Enter on the open of the next candle. You give up a few pips of the move, but you eliminate most fakeouts before they cost you. On the 4H chart, this means you know your entry at the 4H close, no guessing required.
Entry method 2: Retest entry
After a genuine breakout, many levels get retested. Former resistance becomes support. You place a limit order at or near the broken level and wait for price to return. This produces a tighter stop and better R:R than chasing the initial break.
On EUR/USD and GBP/USD on the 4H chart, retest entries occur roughly 40-50% of the time following a valid breakout. When they do occur, they produce the cleanest, lowest-stress entries of any setup I trade. The downside: strong breakouts do not pull back, so you miss the trade entirely if you only trade retests.
A practical approach is to split your position: take half on the close confirmation and hold a limit order for the other half at the retest level. If the retest triggers, you average in at a better price. If it does not, you are still in the trade with your initial half position. Tight entries this close to the level reward a venue with low spreads and real depth, so it is worth taking a moment to check the broker’s execution model before you rely on this at size.
Stop loss placement with ATR
Breakout trades need room to breathe. Tight stops at the breakout level get hunted because institutions and algorithms know exactly where retail traders place them.
The standard approach is ATR-based placement:
Stop = Breakout level minus (1.0 to 1.5 × ATR₁₄)
For example, on EUR/USD 4H with ATR₁₄ of 25 pips: if resistance breaks at 1.1050, the stop goes at 1.1050 minus 30 pips = 1.1020. That placement sits below the natural noise range of the session, wide enough to survive a brief pullback without stopping out before the move develops.
For a deeper explanation of how ATR is calculated and how to apply it across timeframes, the average true range guide covers the formula and practical settings for different pairs and timeframes.
The measured move: your profit target
Breakout trading has a built-in target calculation: the measured move. It is the most reliable profit target method for chart pattern breakouts, grounded in the structure of the setup rather than arbitrary pip counts.
Formula: Measure the height of the prior range or pattern (from support to resistance). Project that same distance from the breakout point.
| Pattern | What to measure | Where to project |
|---|---|---|
| Rectangle or range | Height of range | 1× height above resistance break |
| Ascending triangle | Widest part of triangle base | 1× width from the breakout point |
| Head and shoulders | Head to neckline distance | 1× distance below neckline break |
| Bull flag | Height of the preceding pole | 0.75–1× pole from the flag breakout |
| Cup and handle | Depth of the cup | 1× cup depth from breakout above handle |
In practice, the first profit target at 1.0× is where I scale out 50% of the position. Runners go toward 1.5× and 2.0×. If the stop is 30 pips from entry and the measured move is 60 pips, that is a 2:1 R:R minimum, workable for consistent execution across dozens of trades.
The bull flag pattern is one of the most consistent sources of measured move breakouts on the 1H and 4H charts during trending conditions.
A complete breakout trading strategy
Putting it together, here is the rule set I apply to every breakout trade:
- Identify the level: at least two prior rejections, ideally over 2+ weeks, at a round number or pattern boundary
- Wait for the close: only enter after the candle closes beyond the level
- Assess the candle: strong body, close near the extreme, ATR expanding
- Set the stop: 1.0–1.5× ATR below the broken level
- Calculate the target: measured move from pattern height, first exit at 1.0×
- Check the session: London or New York open increases follow-through probability
- Check the calendar: no active or imminent high-impact news events
This breakout trading strategy framework applies to forex, indices CFDs, and crypto with minimal adjustment. The main variable is ATR size. Wider ATR pairs require smaller lot sizes for the same 1% risk.
What the London breakout taught me
From 2019 to 2022, I traded the London open breakout on GBP/USD as a core setup. The premise: price compresses during the Asian session, then breaks direction at the London open around 07:00 UTC. Trade the initial break with a 20-pip stop, target 40-60 pips.
Win rate across those three years: 62%. Monthly return at 1% risk per trade: around 7-8%. The setup was reliable enough that I ran it as an almost mechanical system.
Then it stopped working.
By mid-2024, algorithmic front-running had changed the character of the London breakout entirely. Price would spike through the Asian range high by 8-12 pips, just enough to trigger stop orders and pull retail breakout entries into the market, then snap back. What used to be a trend-continuation entry became a fakeout machine.
I stopped trading the London breakout in the continuation direction in 2024. Now I watch the same setup, but fade it when the initial break looks overextended relative to ATR. When price spikes through a level on a narrow-bodied candle without meaningful range expansion, that is a stop hunt, not a genuine breakout.
This distinction between a real breakout and a stop hunt is the hardest skill to develop. It took sustained losses on a setup I previously trusted before I could see the pattern clearly.
The lesson: breakout trading requires regime awareness. A strategy that worked during one market structure can invert as algorithms adapt to it. Test your setups on data from the past 12-18 months, not charts from three years ago.
Breakout vs fakeout: key filters
Apply these filters before entering any breakout trade.
| Filter | Valid breakout signal | Likely fakeout signal |
|---|---|---|
| Candle close | Decisively above level | Wick through, close back inside range |
| ATR at breakout | Expanding, above 20-period average | Contracting or at average |
| Session timing | London or NY open, high liquidity | Asian session or news-adjacent |
| Prior level tests | 2+ clean rejections over 2+ weeks | First or second test with little history |
| Chart space ahead | Open for 1× measured move | Next significant level within half the target distance |
The triangle chart pattern demonstrates this filtering process well: the price compression within the triangle creates the ATR contraction, and the breakout produces ATR expansion, exactly the signal these filters look for.
Common mistakes in breakout trading
- Entering on the first candle that breaks the level. That candle has not confirmed. Wait for the close.
- Skipping the measured move calculation. Without a target, exits become guesswork. The measured move provides a rational exit framework tied to the structure of the setup.
- Oversizing on high-ATR breakouts. When volatility expands, position size should shrink proportionally. Fixed 1% risk per trade protects you regardless of how large the ATR gets.
- Trading breakouts against the higher timeframe trend. Breakouts with the daily trend succeed more often. A 4H breakout that aligns with the daily direction has structural tailwind; one that fights it needs much stronger confirmation.
- Ignoring the economic calendar. News events produce breakout-looking price action that frequently reverses within minutes. Do not hold a new breakout position into a high-impact release.
FAQ
What timeframe works best for breakout trading?
How do I tell a real breakout from a fakeout?
Do I need volume to confirm a breakout in forex?
What is the measured move in breakout trading?
Should I trade breakouts at the market open?
Can breakout trading work on crypto?
How much capital do I need to start breakout trading?
🌍 Our recommended brokers
Reader Reviews
The retest entry approach is the most practical improvement I have made to my breakout system. I had been entering on candle close for two years and wondering why my fills were consistently poor on EUR/USD. Shifting to retest entries on 4H cut average risk per trade by roughly 30% while keeping the same measured move targets. Monthly return over the next three months went from 4.1% to 6.4% on identical risk settings.
Applied the breakout framework to XAU/USD daily chart for nine weeks after reading this. My previous gold setups used arbitrary 1:1 targets and I placed stops at the entry candle low - which meant any meaningful retest stopped me out of otherwise valid trades. Changed both: stop below the resistance zone base with a $5 buffer, target at the measured move from the range height. Eight qualifying setups over nine weeks. Six hit the measured move target, two stopped out below the zone - and looking back, both of those had resistance levels tested only once, which this article flags as a quality issue. Monthly return over those nine weeks averaged 7.9% at 1.5% risk per trade, compared to 4.3% in the prior nine weeks using the old stop placement. The $10 ATR false breakout filter on gold was the detail that improved results fastest. Stopped chasing those and the loss frequency on gold setups dropped immediately.
The confirmation checklist before entry is what stopped me overtrading breakouts. I was taking every close beyond a resistance level without checking volume, the higher timeframe trend, or the economic calendar. Running all three conditions before entry cut my setup frequency by roughly half on EUR/USD and GBP/USD combined. The remaining setups produced a 63% win rate over 12 weeks with monthly returns averaging 6.8% at 1.5% risk. Quality improvement was immediate, even before the stats confirmed it.
The stop placement rule - below the level itself rather than below the entry candle - fixed a recurring mistake I had been making without knowing it. I was placing stops at the candle low, which put them inside normal post-breakout volatility. Moved the stop below the actual resistance zone with the 5-10 pip buffer and my hit rate on setups that eventually worked improved noticeably.
Trading forex breakouts for four years and this is the most practically structured guide I have read on the subject. My previous approach was entering on every close above a level and managing trades by gut feel. The distinction between continuation and reversal breakouts helped me classify my setups in a way I had not done systematically before. Going back through six months of trades and categorising them this way revealed that my continuation setups had a 66% win rate while my reversal breakout attempts were at 41%. I was mixing two different strategy types and blaming the results on inconsistency. Stopped taking reversal breakouts except on the daily chart with multiple prior tests at the level, and focused the 4H account on continuation setups only. Monthly return for the three months after restructuring averaged 7.4% at 1% risk per trade, compared to 5.1% in the three months before.
Replicated the EUR/USD 4H test from this article using data from the previous 10 weeks before reading it. My results were close: 60% win rate on candle-confirmation entries versus 46% when entering on wicks. The measured move exit rule is what I had been missing. Before applying it I either closed too early or held through a reversal. Adding a 50% partial close at the measured move and moving stop to breakeven on the rest brought monthly return from 5.1% to 7.2% over the two months after reading this.
The measured move approach to targets is straightforward but I had been applying it incorrectly for months. I was adding the range height to the breakout candle high rather than to the broken level - a small mistake that shifted my EUR/USD targets by 10-15 pips consistently. Correcting this improved my average winning trade to 1.9:1 R:R. Monthly return over two months since the correction averaged 7.1%, versus 5.5% before. The partial close at the measured move target with the remainder running to structure is now my standard exit method.
Ran a side-by-side comparison of break entries versus retest entries over 11 weeks on GBP/USD 4H. I kept the same resistance levels and candle close confirmation filter but decided the entry method based on a predetermined rule, not feel. Break entries: 19 setups, 58% win rate, average 1.6:1 R:R, monthly return 5.9%. Retest entries: 14 qualifying setups, with five setups never pulling back at all, 71% win rate, average 2.1:1 R:R, monthly return 6.7% on deployed capital. Accounting for the five missed moves as breakeven outcomes, the retest group still outperformed at an adjusted 6.2% versus 5.9% for break entries. The article is correct about when to prefer break entries: setups with long compression that historically skip the pullback. I now use consolidation length as the actual decision criterion. Below 12 candles of compression, I use retest entries. Above 20 candles, break entries. The range in between gets a retest entry with a tighter initial stop.
Leave a Review

Forex Analyst & Senior Trader
Former FX desk trader with 8 years in institutional forex. Works in multi-timeframe analysis and order flow, turning desk experience into systematic, testable rules across forex and metals.