What a Triangle Actually Is
A triangle is two converging trendlines, like a wedge, but the slopes are what set it apart:
- A wedge has both lines sloping the same way.
- A flag is a parallel channel, the two lines running side by side.
- A triangle has one line flat and one sloping, or two lines sloping toward each other.
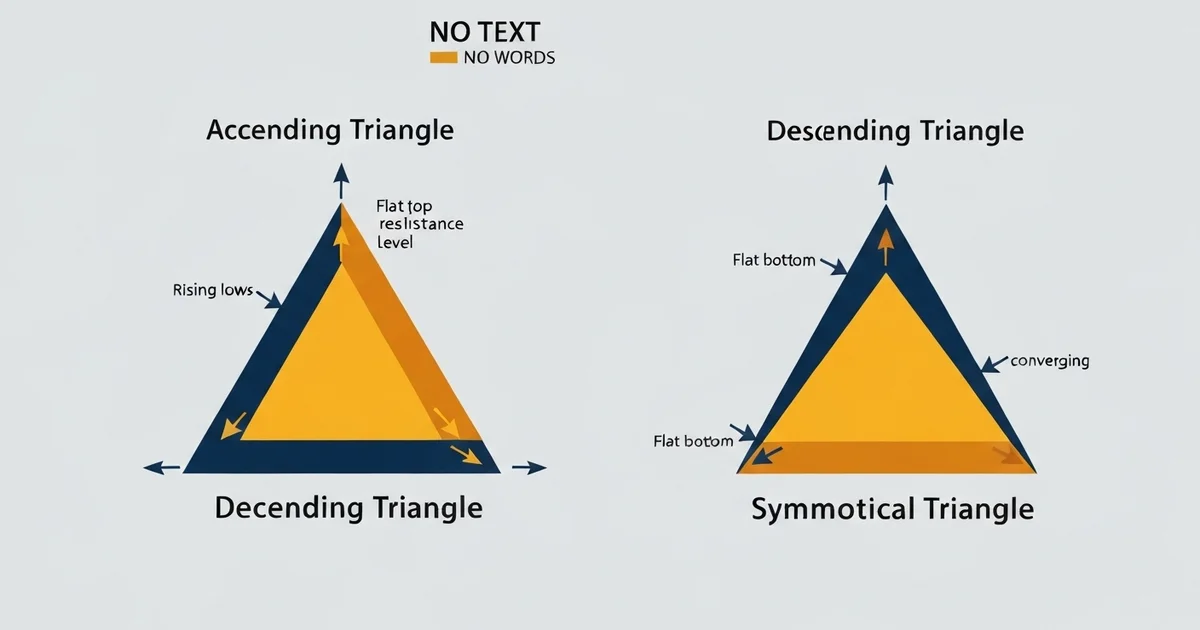
That gives the three types. An ascending triangle has a flat top and a rising bottom. A descending triangle has a flat bottom and a falling top. A symmetrical triangle has a falling top and a rising bottom, meeting at a point.
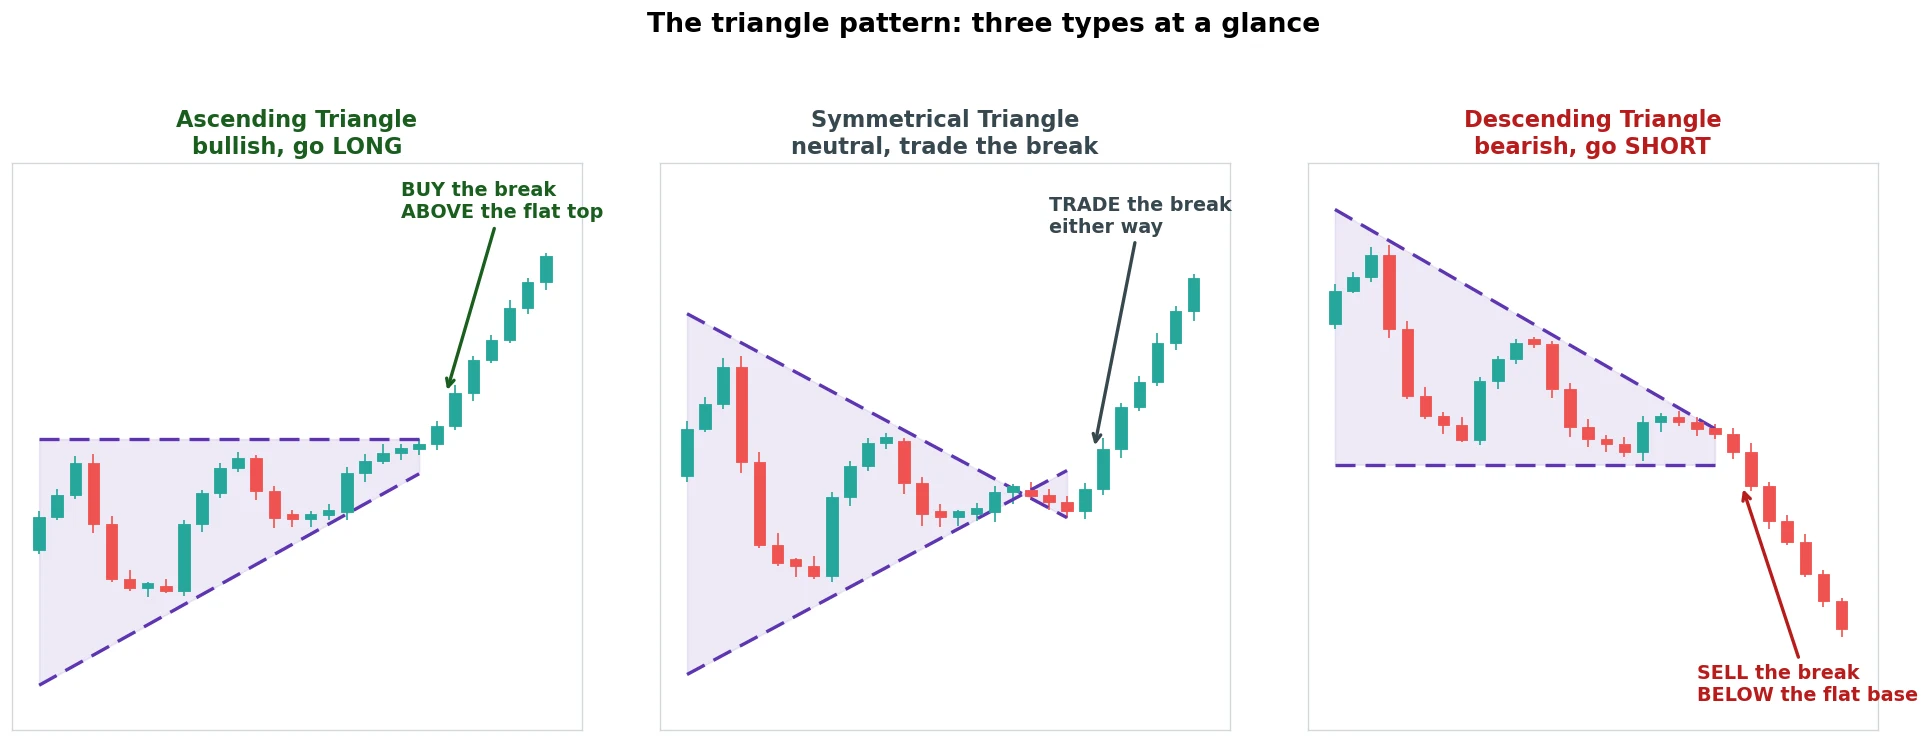
The flat line is the tell. In an ascending triangle, buyers keep pushing price up to the same ceiling and it keeps holding, but each pullback is shallower than the last. That is supply being absorbed at one level.
When the ceiling finally cracks, the people who were selling it are gone, and price runs. The descending triangle is the same story upside down: sellers leaning on a falling line above a floor that eventually gives way.
Eight years on an FX desk taught me to respect which triangle I was looking at, because they are not interchangeable. Rather than repeat the textbook, I tested all three.
How to Draw a Triangle
Getting the lines right is most of the battle, so here is the exact method.
- The flat line: find two or more highs (ascending) or lows (descending) that stall at roughly the same price, and draw a horizontal line through them. That is your resistance or support.
- The sloping line: connect the rising lows (ascending) or the falling highs (descending) with at least two touches.
- They must converge. The gap between the lines has to narrow. If it does not, you have a range, not a triangle.
The quickest way to keep the family straight: a triangle leans on one horizontal level, a wedge has no flat line at all, and a flag runs in a parallel channel. If you cannot find a genuinely flat side with two clean touches, you are probably looking at a wedge or just noise.
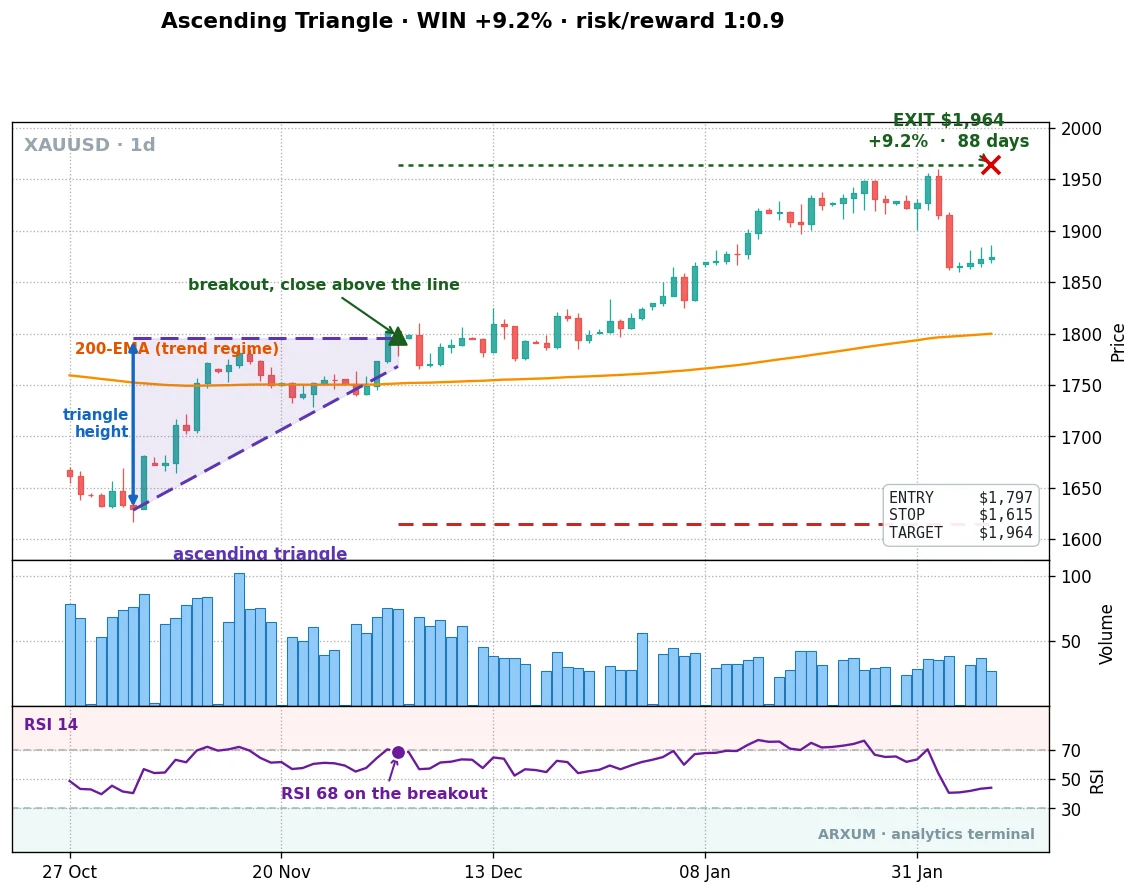
The Anatomy of One Real Trade
Before the statistics, one trade. This is an ascending triangle on gold’s daily chart.
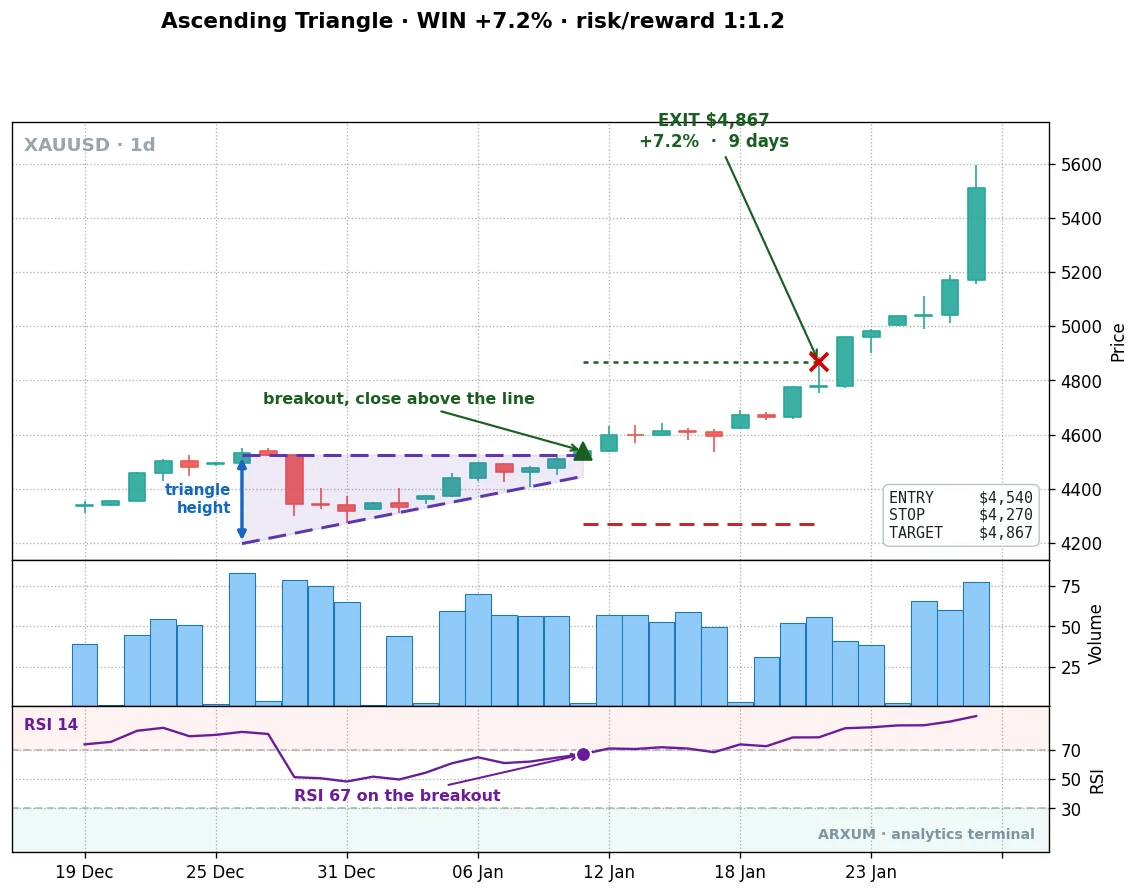
Read it left to right:
- Price tags the same ceiling several times and keeps getting turned back.
- The lows underneath keep rising, so the candles get squeezed into the corner.
- The entry is the first daily close above the flat resistance.
- The stop sits below the rising support, where the pattern would be wrong.
- The target is the triangle height, the full distance between the two lines at their widest, projected up from the breakout.
That trade entered near 4,540 dollars, stopped at 4,270, targeted 4,867, and reached it in nine days for a gain of about 7 percent. One clean example. Now the question that matters: which of the three types repeats, and where?
Where Each Type Actually Pays
I ran the same detector across gold, the euro, the pound, and Bitcoin, for all three types. Triangles form constantly, dozens per market, so frequency is never the problem. Paying is. This is profit factor by type, dollars won per dollar lost.
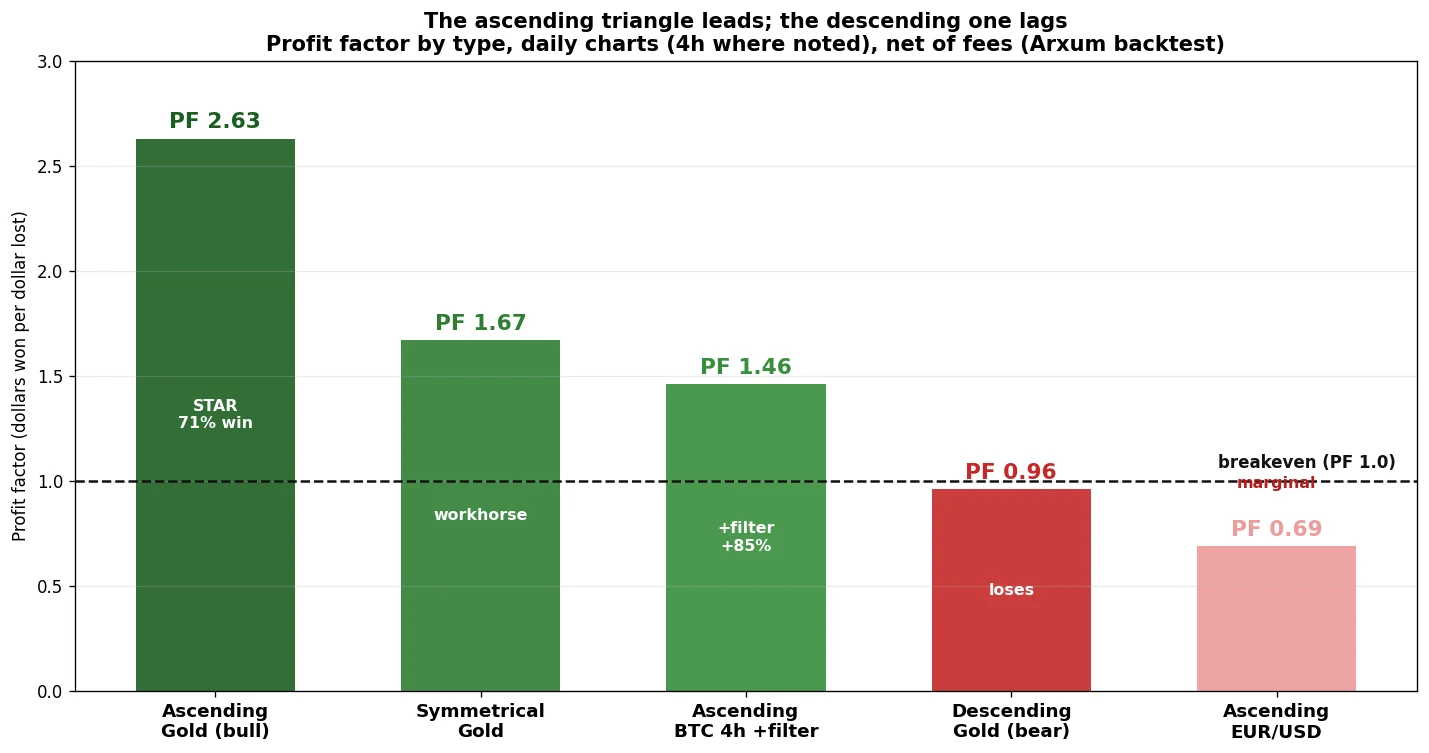
The pattern splits cleanly along its bias:
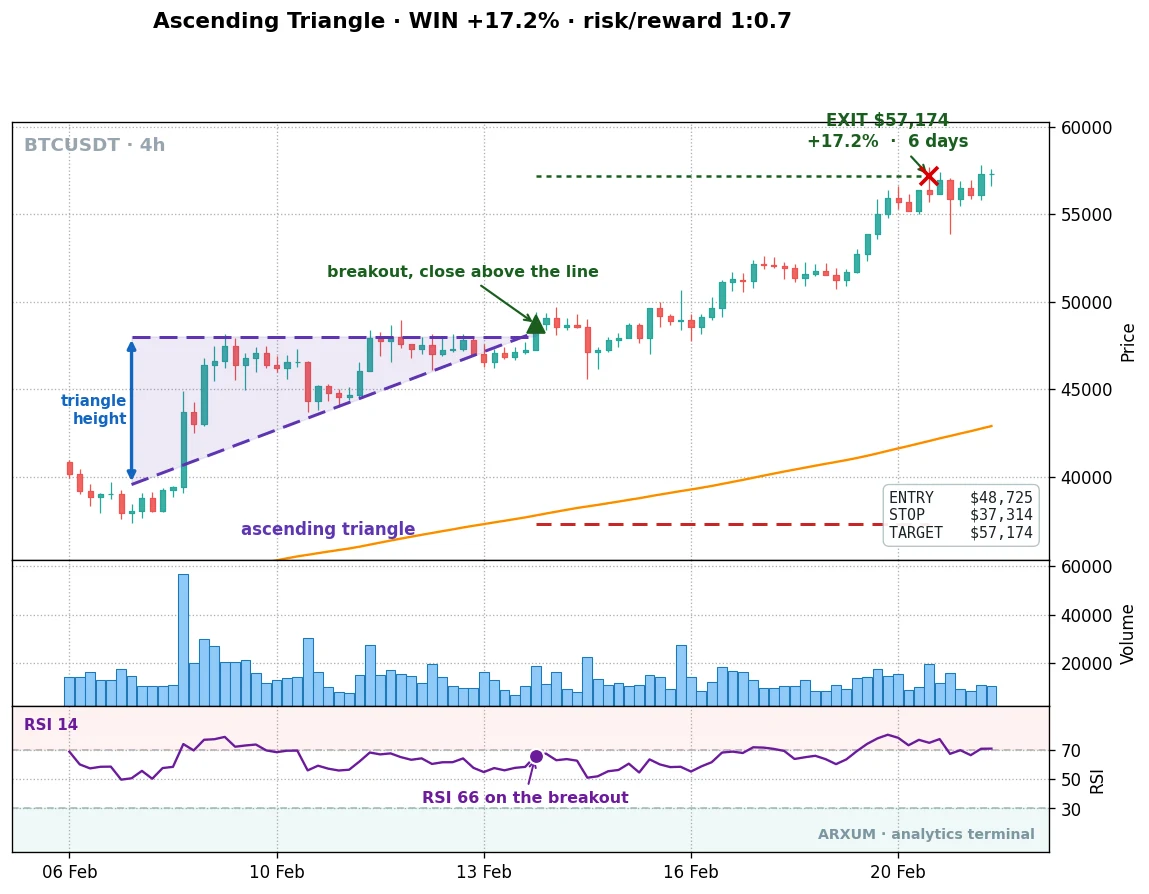
- Ascending (bullish): the best of the three. On gold, profit factor 2.63 and a 71 percent win rate. On Bitcoin it needs the trend filter, but then pays well on the 4-hour (profit factor 1.46, up 85 percent).
- Symmetrical (neutral): the workhorse. Profit factor 1.67 on gold, forms the most often, and trades the break in either direction.
- Descending (bearish): the weak one. It lost money on gold, on Bitcoin, and on the euro.
Why does the bearish triangle lose? Because it is a continuation pattern, and a downward continuation needs a downtrend to continue into. Across this test window gold and Bitcoin spent most of their time grinding higher, so the bearish breaks kept failing while the bullish ones kept working.
The triangle’s edge follows the trend the market is already in. That single idea explains the whole table.
There is a timeframe wrinkle worth knowing. On gold the daily chart is the home of this pattern. On Bitcoin the daily produced too few clean triangles to lean on, while the 4-hour chart gave hundreds, so the faster market wants the faster chart.
The catch is that the raw 4-hour signal is noisy, and the crypto version only paid once I kept the trades to triangles breaking in the direction of the 200-day trend. On gold you can almost ignore that filter; on Bitcoin it is the difference between a coin flip and an edge.
The Setup That Pays Best: the Ascending Triangle on Gold
The ascending triangle on gold’s daily chart is the one I would actually trade. The rules are the ones from the anatomy chart: enter on the daily close above the flat resistance, stop below the rising support, target the triangle height projected up.
Here is what 1,000 dollars does on it, risking 2 percent of the account per trade.
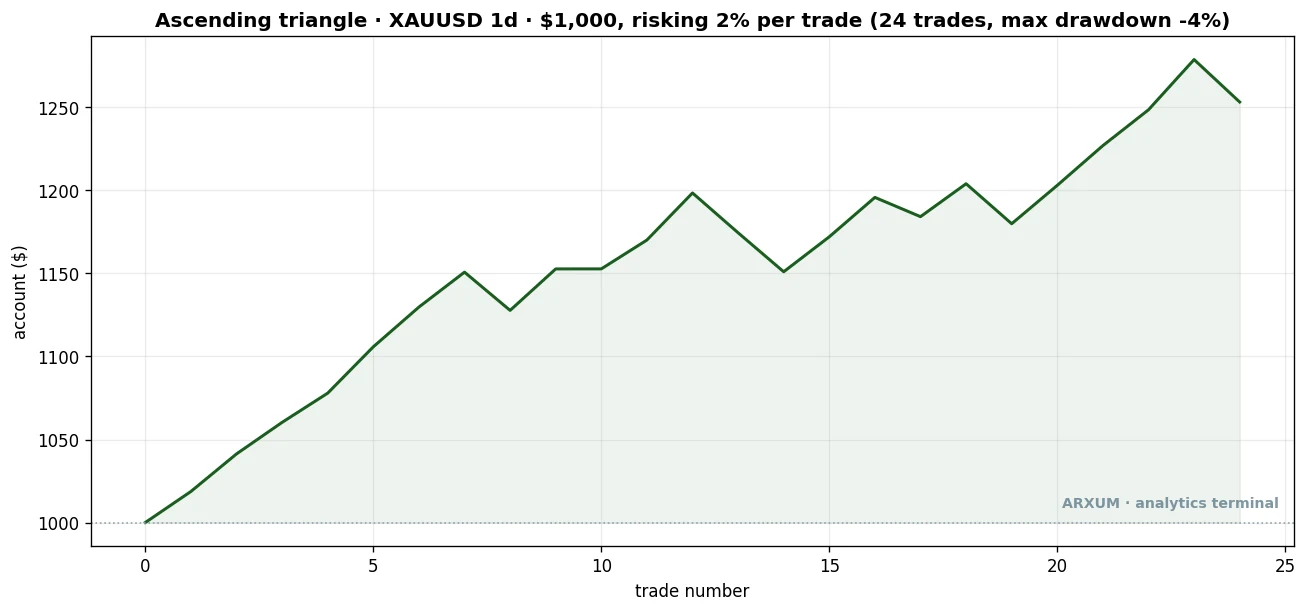
| Trades | 24 |
| Win rate | 71% |
| Profit factor | 2.63 |
| Reward-to-risk | 1:1.0 |
| Total return | +64% |
| Max drawdown | −15% |
| $1,000 at 2% risk | → $1,253 |
The edge here is the win rate (how often it wins), not the size of the winners.
The reward-to-risk (how many dollars each winner makes for every dollar a loser costs) is only about 1 to 1, so the pattern pays by being right seven times in ten and keeping the losses small. That changes how you trade it, which I will come back to.
Does It Hold Up Out of Sample?
A backtest that only looks good on its own history is worthless. So I split gold’s trade history in two: the trades up to mid-2022 to build the case, and everything after, which the pattern never “saw,” to test it.
| Gold ascending triangle | trades | profit factor |
|---|---|---|
| Built on 2018 to 2022 | 14 | 4.13 |
| Tested on 2022 to 2026 (never seen) | 10 | 1.83 |
The edge cooled out of sample, from a profit factor of 4.13 to 1.83, which is exactly what you should expect from an honest backtest.
But it stayed clearly profitable on data it was never fit to, and the worst peak-to-trough dip along the way, the drawdown, was only about 15 percent (that is how far the account fell from a high before recovering). That is a setup you can trust with real money.
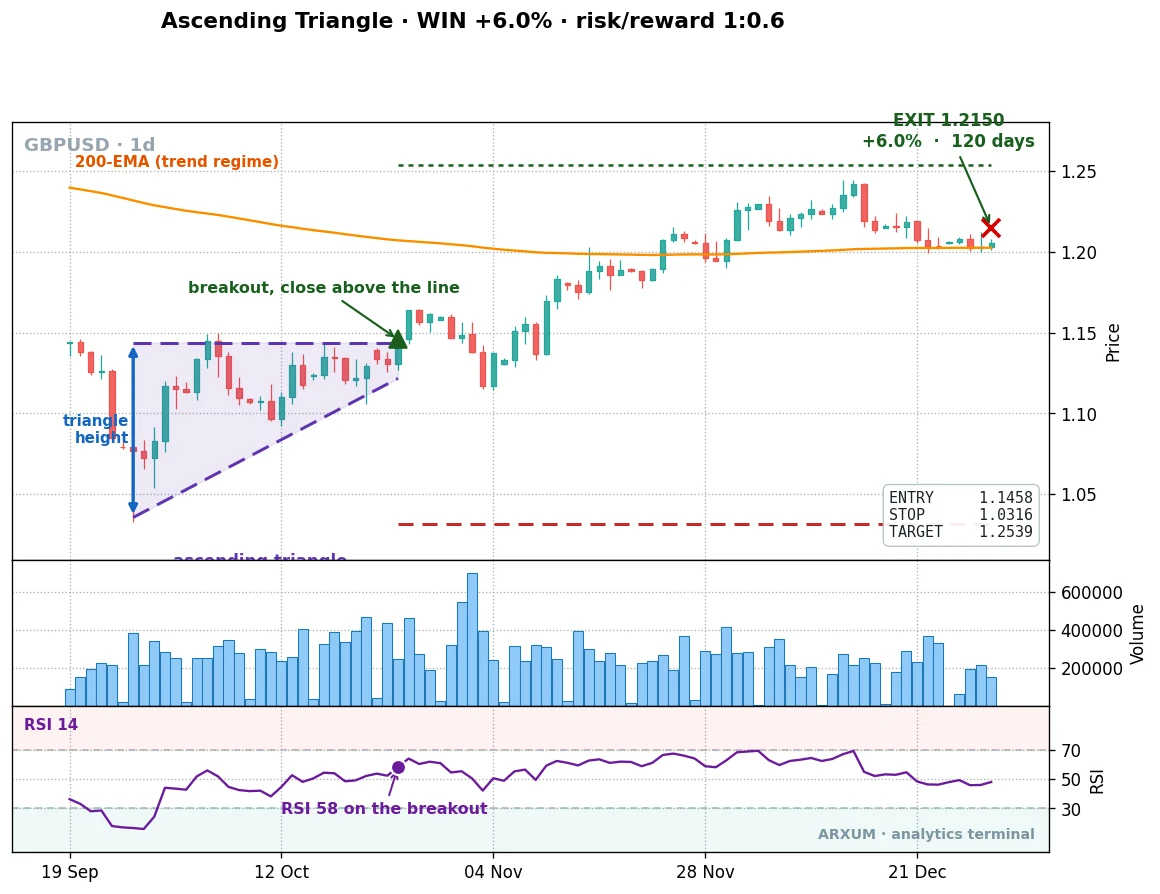
Train Your Eye: a Few More of the Same Trade
The fastest way to learn a pattern is to see it work several times, so your eye starts catching the shape before you think about it. Here are two more ascending triangles, the same setup on different charts.
And one on Bitcoin’s 4-hour chart, where the ascending triangle pattern needs the trend filter to pay but then runs fast when it does:
Notice what is identical across all of them: a level price keeps failing to break, lows that climb toward it, and the entry only on the close above the line, never inside the triangle on a hunch. The market and the speed change, the shape does not.
Once you have seen that shape a few times, you will spot it forming a week before the breakout, which is exactly when you want to be ready, not chasing.
Even the Best Triangle Loses Sometimes
A 71 percent win rate still means almost three trades in ten lose. Here is one of those, on gold.
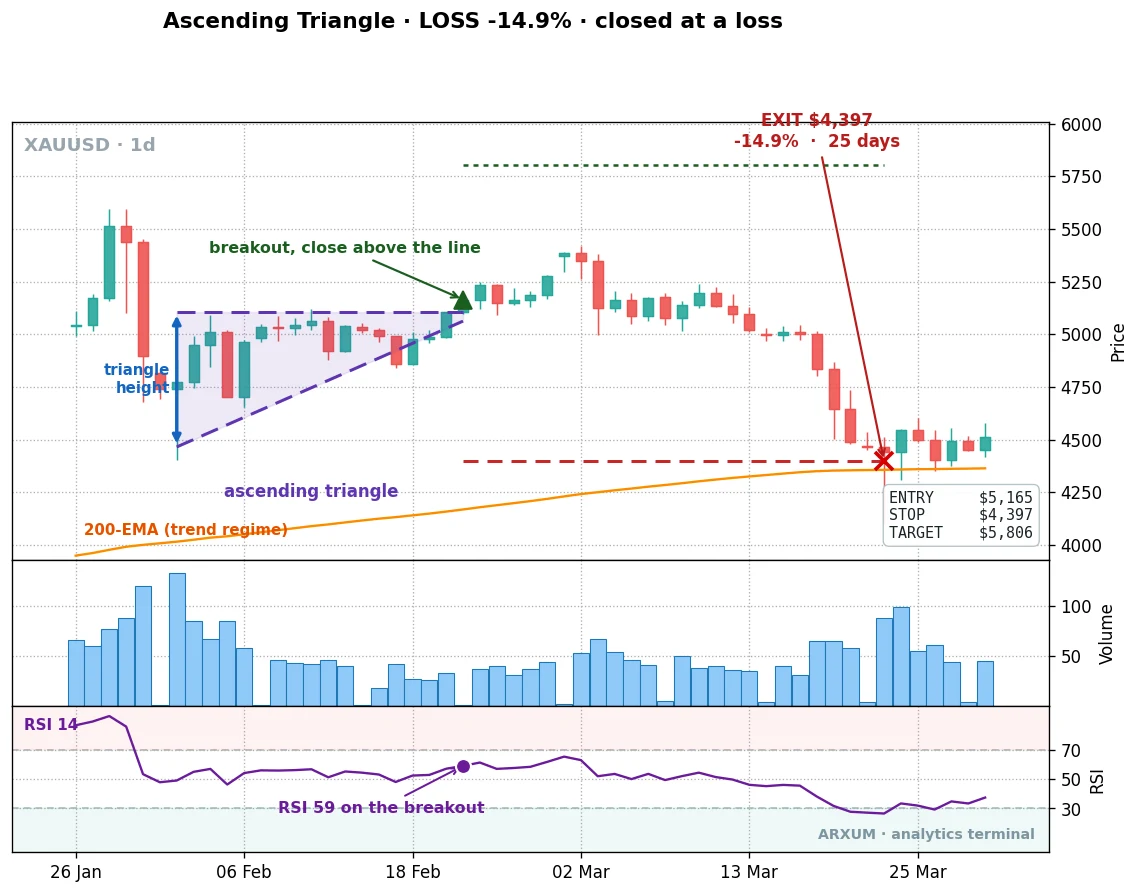
The setup was textbook. The ceiling held repeatedly, the lows rose, the close pushed above the line, the entry triggered. Then price rolled over and hit the stop. Nothing was misread.
With a reward-to-risk near 1 to 1, the whole edge depends on these losers staying small, so the discipline is simple and strict: take the stop exactly where you drew it, and never widen it to give a losing trade room.
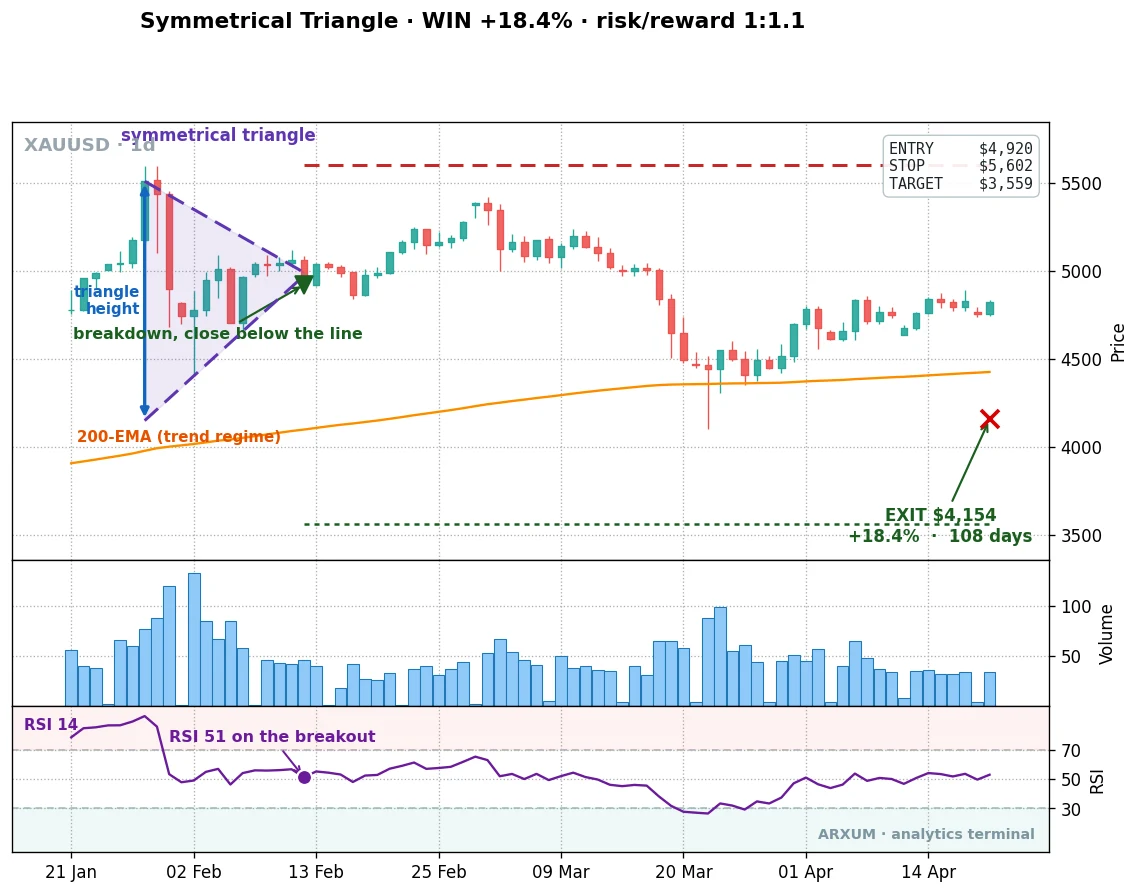
The Symmetrical Triangle: the Workhorse
The symmetrical triangle is the neutral one, both lines sloping toward each other, and it has no bias of its own. You trade the direction it breaks. It also forms more often than either of the others, which makes it the steady earner of the three.
| Trades | 34 |
| Win rate | 44% |
| Reward-to-risk | 1:1.2 |
| Profit factor | 1.67 |
| Total return | +45% |
| First half / second half PF | 1.48 / 1.87 |
It wins less than half the time, but the winners run a little further than the losers, so the math comes out ahead, and the second half of the data was actually better than the first. The rule is to wait for the close beyond whichever line breaks, then stop past the opposite line and target the triangle height in the breakout direction.
Why the Descending Triangle Disappoints
The descending triangle is the bearish one, a flat floor with falling highs, and on paper it should be the mirror of the ascending. In the test it was not.
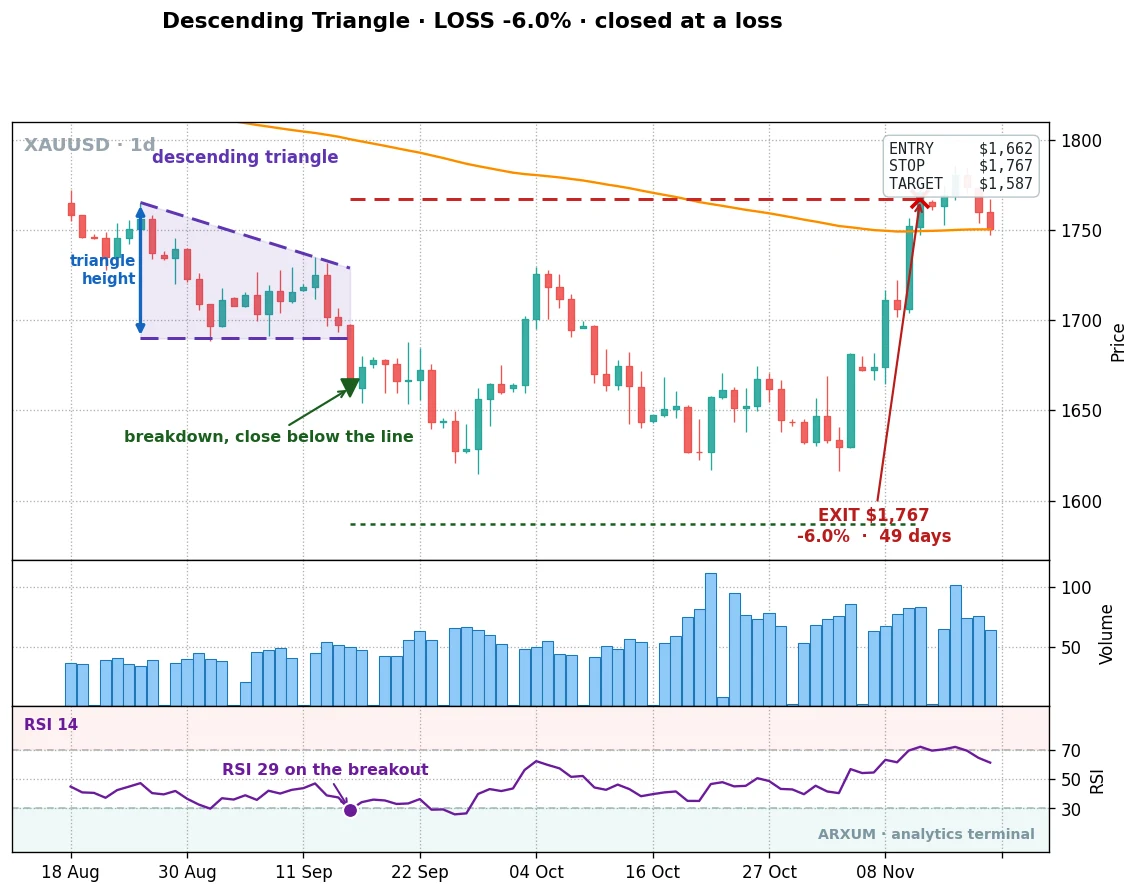
On gold it lost money outright, and it was weak on Bitcoin and the euro too. The reason is the one from the type map: a downward continuation needs the market to already be falling, and across these years gold and crypto mostly rose.
A descending triangle inside an uptrend is usually just a pause before price goes back up, which is the opposite of what you shorted it for. The honest takeaway is to be very cautious shorting a descending triangle in a market that is trending up, and to demand a genuine downtrend before you trust it.
If You Trade Forex
Most people reading this trade currency pairs, so here is the straight version. Triangles form on the euro and the pound all the time, but in this test they were marginal. The ascending triangle was the least-bad of them, slightly positive on the pound and roughly breakeven on the euro with the trend filter, while the symmetrical and descending types lost.
So for a Forex trader, treat a currency-pair triangle as a lower-confidence setup than the same pattern on gold:
- Lean toward the ascending type, in the direction of the bigger trend.
- By the trend I mean the 200-day moving average: price above a rising 200-day line is an uptrend, below a falling one is a downtrend. Take the breakout that agrees with it.
- Or trade the ascending triangle on gold, which sits on every Forex platform and through the same hours you already watch, and which is where this pattern actually paid.
What Separates a Clean Triangle From a Fakeout
Not every triangle is worth the risk, and the difference is visible before you enter. The ones that paid in testing shared a few traits, and they are the same things you can check with your eyes in seconds.
- Touches. The flat line should have at least two clear rejections at the same level, and three is better. Each touch is the market confirming that level matters. A “flat” line drawn through one high and a lot of hope is not a level, it is wishful thinking.
- A real squeeze. The two lines should visibly converge, the range tightening as price works toward the apex. If the lines stay wide apart, you have a box or a channel, and the breakout odds are different.
- The close, not the wick. The entry is a candle that closes beyond the line on the timeframe you are trading. A wick that pokes through and pulls back is the fakeout the patient trader sits out. Waiting for the close is the single biggest filter between the winners and the losers.
- Trend agreement. This is the one the data shouted loudest. An ascending triangle in an uptrend and a symmetrical triangle breaking with the bigger trend were the trades that worked. A descending triangle in an uptrend was the one that bled. Before you take the break, ask which way the market is already leaning.
None of this needs an indicator. It is four quick visual checks, and they turn the triangle from a shape you hope works into a setup you can filter.
How to Size and Place the Trade
The triangle height and the stop give you everything you need before you risk a dollar. Take the gold (XAU/USD) trade from the top of the article.
Most brokers quote gold in dollars per ounce and size it in lots: one standard lot is 100 ounces, one micro lot is one ounce. On a currency pair the arithmetic is identical, you just measure the stop in pips instead of dollars and multiply by your lot’s pip value. Either way the rule is the same: fix what you are willing to lose, and let the stop distance set the size.
- Risk per ounce is the entry minus the stop: 4,540 − 4,270 = 270 dollars.
- Reward per ounce is the target minus the entry: 4,867 − 4,540 = 327 dollars.
Decide what the trade may cost you, then divide by the per-ounce risk. The rule is 2 percent of your account, so on a 1,000 dollar account that is 20 dollars:
20 ÷ 270 = 0.07 of an ounce.
Here is the honest problem most guides skip. The smallest size most brokers let you trade is one micro lot, which is one whole ounce, and 0.07 of an ounce is far below that.
So on a 1,000 dollar account, at a proper 2 percent risk, you cannot take this particular gold trade at all without breaking your own risk rule.
That is not a reason to fudge the numbers. It is the small-account reality with an expensive instrument like gold, and you have two clean options: open an account with a broker that offers cent lots (which let you trade fractions of an ounce), or trade the same pattern on a lower-priced market where 2 percent of your account buys a tradeable size. Never widen the stop or oversize the position to force a trade that does not fit.
To actually place it, in three clicks:
- Entry: a buy-stop order at the breakout price (4,540). A buy-stop only fills if price trades up to it, so you are not in until the line breaks.
- Stop-loss: type 4,270 in the stop field. The platform closes the trade there automatically.
- Take-profit: type 4,867 in the target field, set your lot size, and the trade manages itself.
The Honest Weaknesses
Two things to know. First, the ascending triangle’s edge is a high win rate with a modest payout, near 1 to 1, so a single oversized loss erases several wins. The discipline is the stop, every time. Second, the pattern is trend-dependent: the bullish type pays in uptrends, the bearish type needs downtrends, and trading the wrong one for the market is how the edge turns negative.
Three Ways Traders Blow This Setup
- Trading the wrong type for the trend. Shorting a descending triangle while the market grinds up is the most common way to lose with this pattern. Match the triangle to the trend, or stand aside.
- Entering inside the triangle. The signal is the close beyond the line, not the squeeze. Buying early, before the break, on a feeling it is “about to go,” is how you get caught on the fakeout.
- Forcing a flat line that is not there. If the highs or lows are not genuinely level, it is not a triangle. Two clean touches on the flat side, or you pass.
The Method on a Matchbox
Strip it all away and the tested triangle method fits in three lines:
- Trade the ascending triangle in an uptrend (gold’s daily chart led, 71 percent win rate). The symmetrical is the neutral workhorse, traded in the direction of the break. Leave the descending triangle alone unless the market is genuinely falling.
- Enter on the close beyond the line, stop past the opposite side, target the triangle height. Never enter inside the triangle.
- Respect the stop to the tick. The payout is modest, so the win rate is the edge, and one stretched loss undoes several wins.
That is the pattern. Three shapes that look similar and trade nothing alike, on the markets where each one actually works.
If you are just starting, do not trade it with real money yet. Open a demo account, pull up a daily gold chart, and mark every flat ceiling with rising lows you can find. Take your first one only when a candle closes above the line. A dozen marked examples will teach your eye more than another article will.
FAQ
Is an ascending triangle bullish or bearish?
What is the difference between a triangle and a wedge?
Which triangle pattern is most reliable?
Where do I put the target?
Do triangles work on Forex pairs?
Should I trade the breakout or the squeeze?
What win rate does the ascending triangle have?
How many triangle trades should I expect in a year?
🌍 Our recommended brokers
Reader Reviews
Be the first to review this — tell other traders what actually helped, or where it fell short.
Leave a Review

Forex Analyst & Senior Trader
Former FX desk trader with 8 years in institutional forex. Works in multi-timeframe analysis and order flow, turning desk experience into systematic, testable rules across forex and metals.