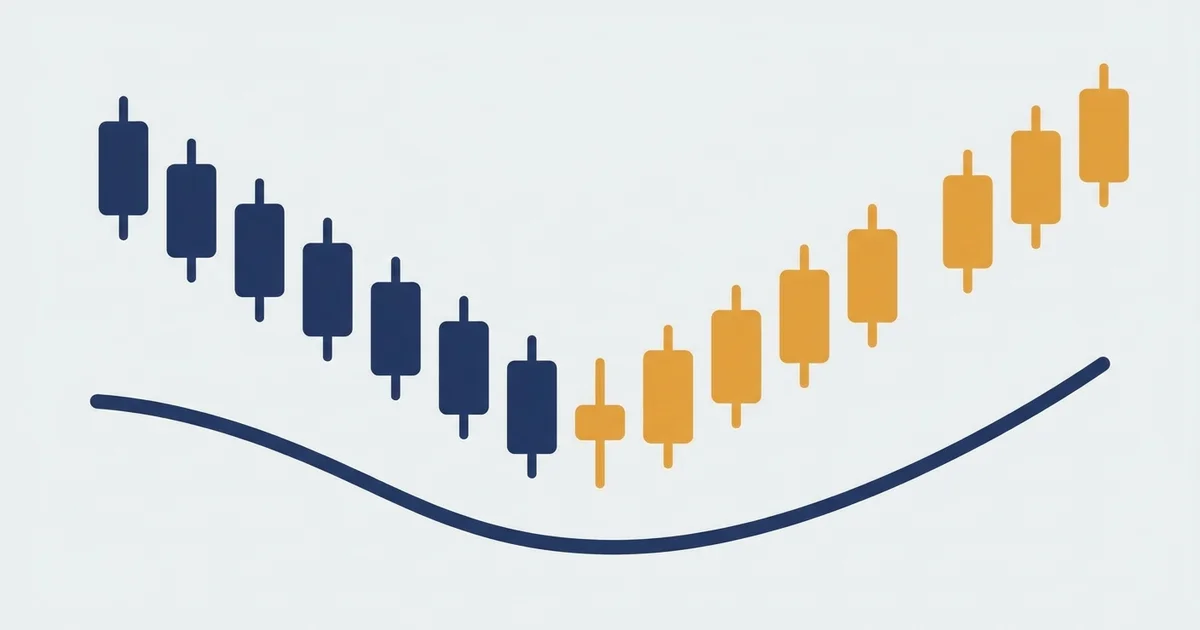

What Heikin Ashi candles actually are
Before any results, look at the thing itself. Heikin Ashi takes the ordinary open, high, low and close and blends them, so each candle carries a little memory of the last one.
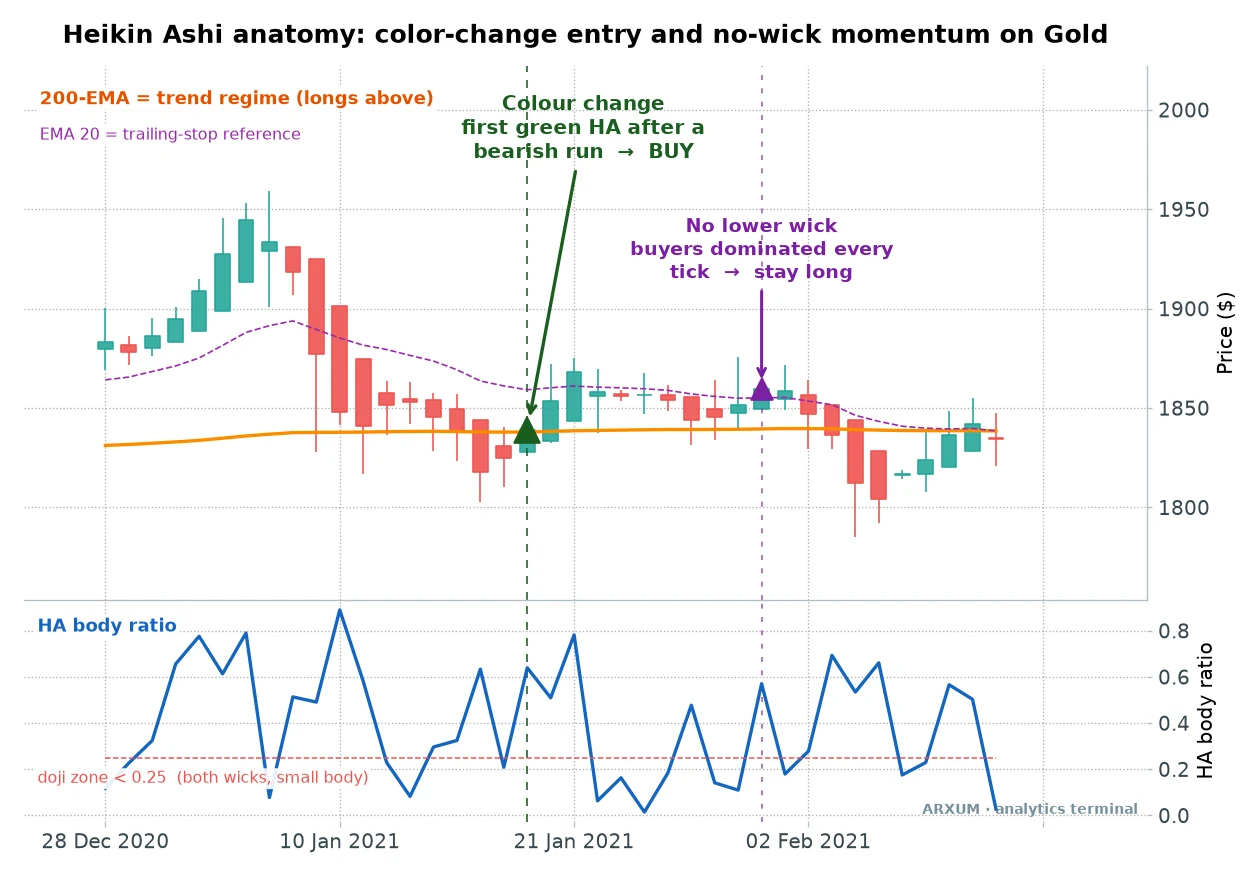
Two formulas do the whole job, and you never type them yourself since the chart draws them for you. The HA close is the average of the bar’s open, high, low and close.
The HA open is the midpoint of the previous HA candle.
That small change has one large effect. Because every candle leans on the one before it, a choppy patch that would print red-green-red-green on a normal chart often prints as one smooth colour on Heikin Ashi.
The noise gets averaged away.
So the difference from a regular candlestick is not cosmetic. A standard candle shows you exactly what one bar did; a Heikin Ashi candle shows what the last two bars did together, which is closer to what a trend actually is.
If you want the full primer on reading them, the Heikin Ashi candles guide walks through construction step by step.
The trade-off is honest: HA smooths, so it also lags. The averaged close is not the real close, and your actual entry fills at the real market price, not the tidy HA level.
Keep that in the back of your mind through everything below.
The three candle shapes that matter
Once the chart is redrawn, three candle shapes carry almost all the information. Learn these and the rest of this article is just showing you where each one paid.
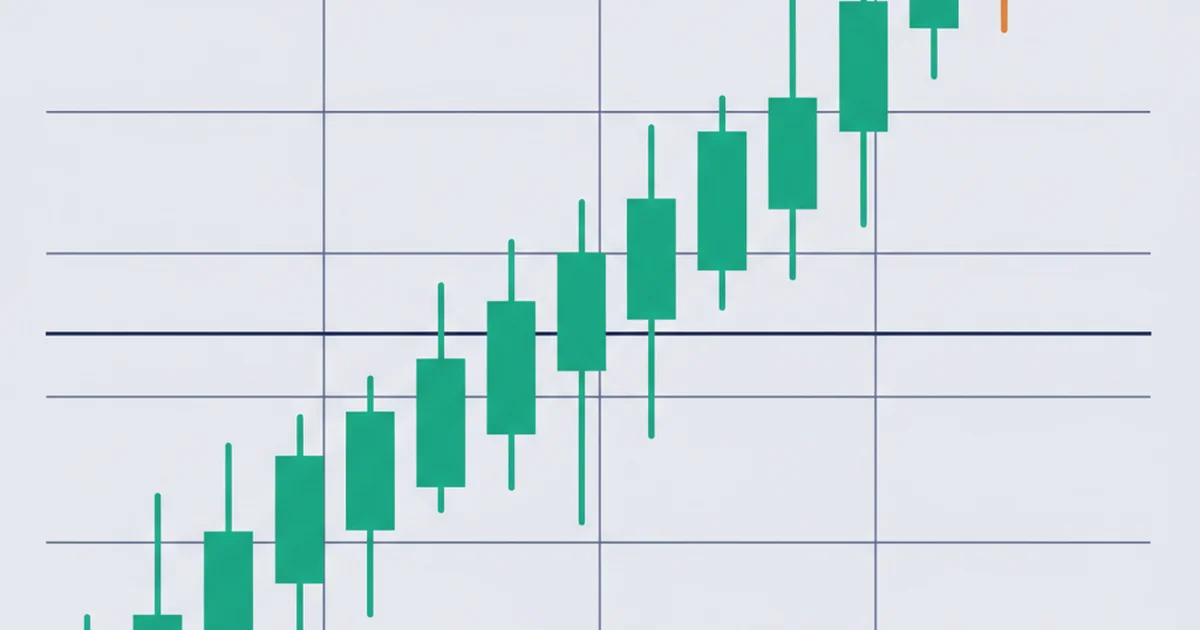
Here is what each one tells you:
- No opposing wick, big body. A green candle with no wick underneath means buyers ran the whole session. That is the cleanest momentum read Heikin Ashi gives you.
- The first flip after a run. A single green candle after several red ones is the market changing its mind. That is the trend-entry signal.
- A doji, a tiny body. After a long coloured run, a candle that shrinks to almost nothing means the trend is out of breath. What comes next often reverses.
Each shape became a setup. We built all three, sized every trade to a fixed 1:2 reward, and ran them long and short across roughly eight years of daily data on gold, EUR/USD and Bitcoin, net of fees.
Gold leads the story because gold is what has been trending.
Setup one: riding a no-wick run on gold
Start with the workhorse, because it trades the most and it is the easiest to see. The rule is plain.
On spot gold (XAU/USD), when a Heikin Ashi candle prints with no lower wick and a full body while price is above its long-term trend, you buy the close and ride.
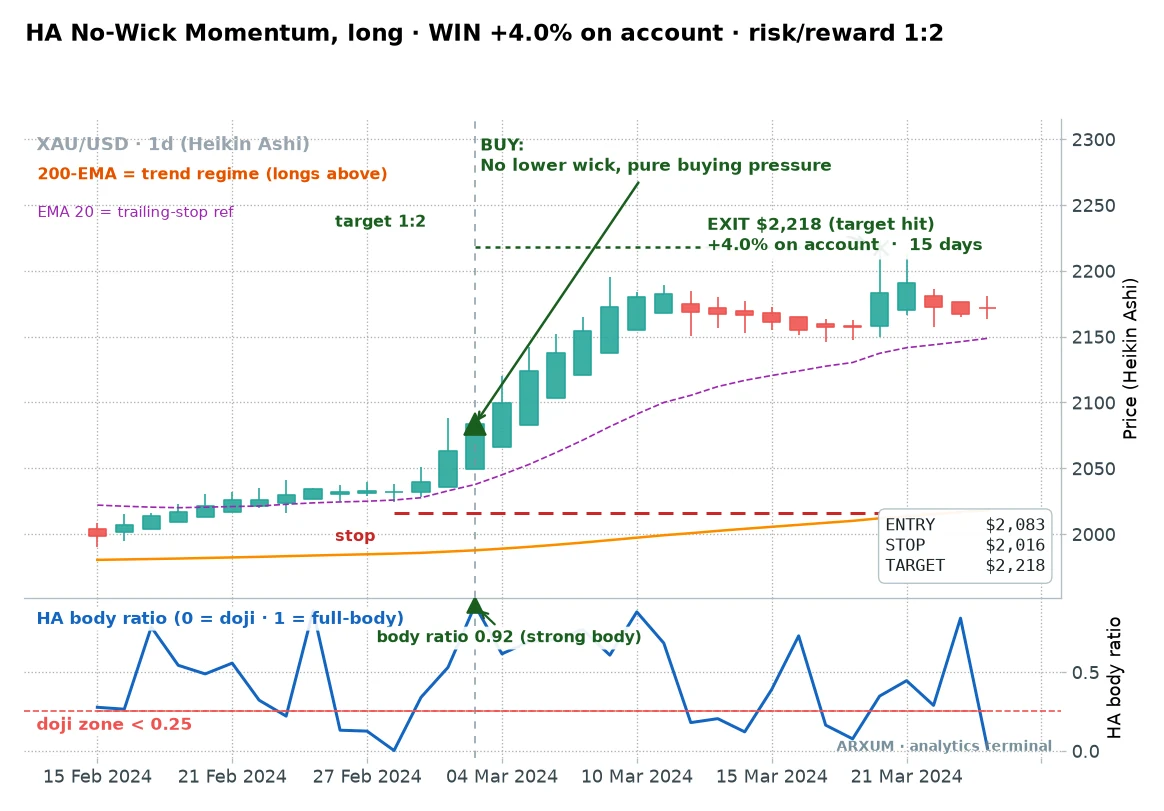
Trace it. The candle closed with no wick under it, so sellers never showed up all session.
You bought that close, put your stop under the recent swing low, and set a target twice as far away as the stop. Price walked up to the target.
That 1:2 reward-to-risk is the number to get comfortable with first. Written 1:X, the 1 is your risk, the distance from entry down to your stop, and the X is the reward, how many times that risk the trade aims to make back.
A 1:2 means the target sits twice as far as the stop, so a winner pays double what a loser costs. The risk-reward-ratio guide shows how to read that on any trade.
One thing to clear up before you look at the charts. Every price chart below carries a purple 20-EMA line marked “trailing-stop reference.” That is an optional exit, a way to let a big winner keep running by trailing your stop up along that line instead of closing at the target.
Every number in this study used the plain fixed 1:2 target, nothing fancier. So if you are starting out, trade the fixed target and treat that purple line as a later option, not a second rule you have to follow.
Here is a second one, in a different stretch of the same bull market, so you see it is not a one-off shape.
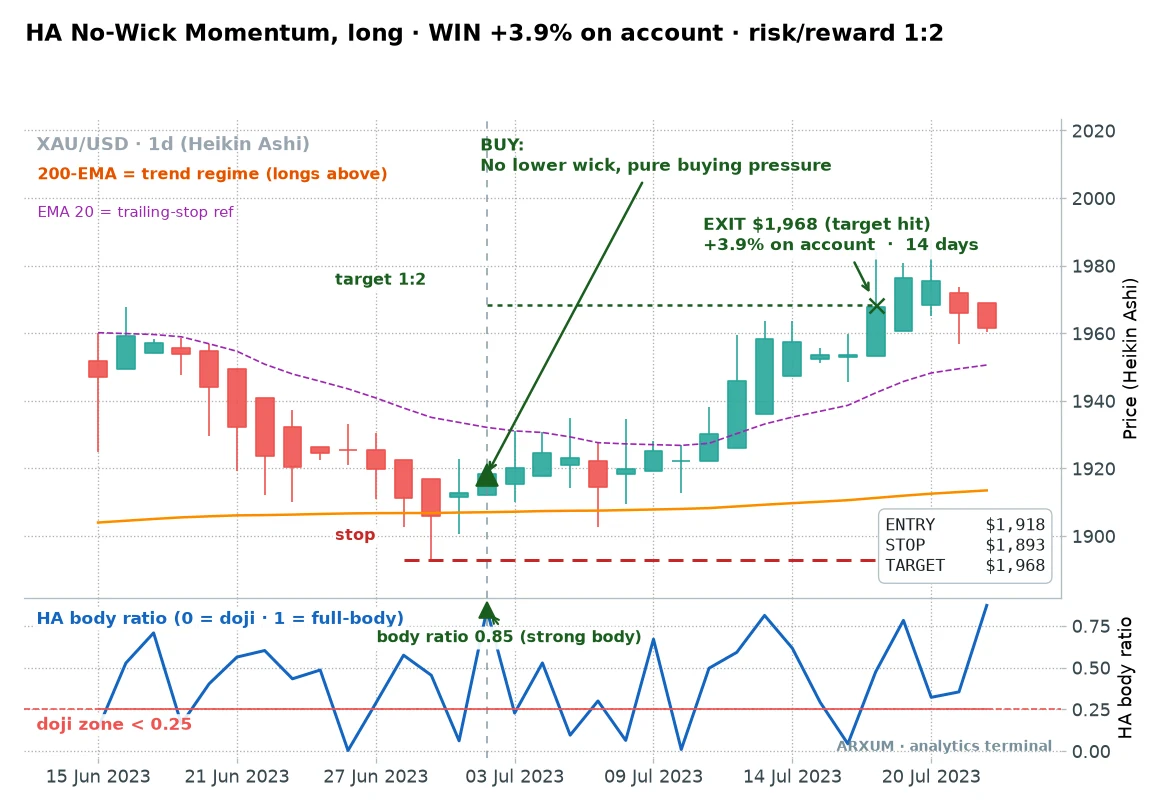
Same read, calmer entry. A no-wick body, a stop under the swing low, a target at twice the risk.
On the account, at 2% risk per trade, each of those winners is worth about +4%, and each loser costs about 2%.
Two winners are anecdotes. What matters is the whole run, losers included, so here is the balance across every no-wick trade.
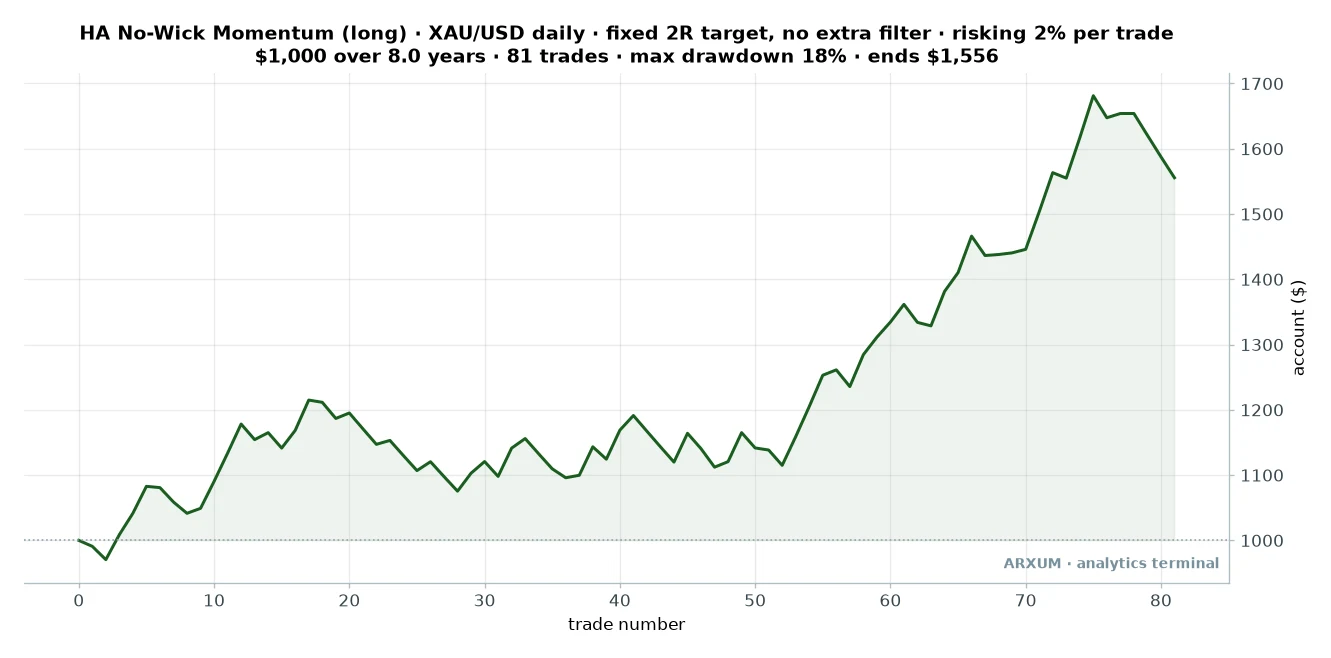
| Trades | 81 |
| Win rate | 54% |
| Reward-to-risk | 1:2 |
| Profit factor | 1.65 |
| Max drawdown | 18% |
| Net return on $1,000 | +56% |
A word on profit factor, since it runs through every table here. It is every dollar the setup won divided by every dollar it lost, so above 1.0 it makes money and 1.65 means it won a dollar sixty-five for every dollar given back.
Max drawdown is the deepest fall from a high point along the way, the worst stretch you would have had to sit through.
Read the shape, not just the end point. The account grinds sideways early, then the recent bull run does the heavy lifting.
A 54% win rate, a lot of small give-and-take, then a back half that carries it.
The filter that lifts it: a calm market
The base setup works. A single filter makes it noticeably better, and it is the opposite of what most traders reach for.
The instinct is to demand heavy volume, to only trust a big candle when lots of contracts traded. On gold no-wick longs, that instinct is wrong.
Screening for volume spikes at or above 1.5 times the recent average dropped the profit factor to 0.70, a loser. A full no-wick candle on a volume spike is often the last gasp of a move, not the start of one.
One honest note on that volume read. Spot gold has no central exchange, so the volume your chart shows is your broker’s tick count, a retail proxy for activity rather than true contract volume.
Read it as direction, more trading or less, not as an exact figure. It still tells you when a candle is unusually busy, which is all this filter needs.
What lifted it was calm. Take the no-wick candle only when the market is quiet, and the profit factor rose from 1.65 to 2.60.
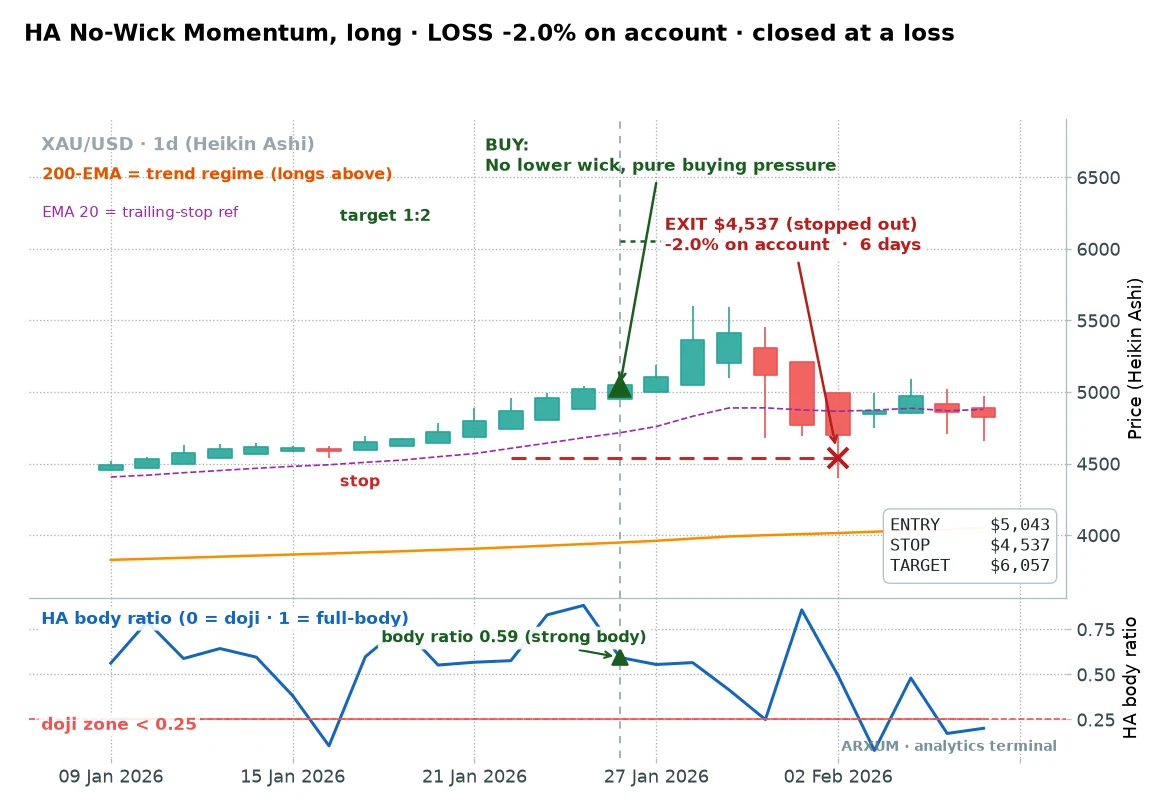
That loss is the case for the calm filter. The candle came on a loud, stretched push into resistance, price rolled straight over, and it closed down hard.
On the method’s 2% sizing that is a 2% hit to the account, though a fast move can cost a touch more, which is what happened here.
You can read “calm” two ways. By eye, the daily candles get smaller and the range tightens before the setup.
With one number, use ATR. Average True Range measures the size of the typical daily swing, and when today’s ATR sits below its recent median, the market is in its quiet half.
That reading is your green light.
The rule of thumb: take the no-wick candle in a calm market, and skip it when volume is spiking. Loud momentum candles lie more often than they lead.
One more filter earns a mention, because it repeats across all three setups. Price above the 200-day EMA, and the 50-day EMA above the 200 as well, lifted this setup to 2.04.
That double-agreement of the medium and long trend is the single most reliable condition in the whole study.
Setup two: the trend flip entry
The second setup trades the turn rather than the run. After a stretch of red Heikin Ashi candles, the first green one is the market flipping, and you take it, as long as the bigger trend is up.
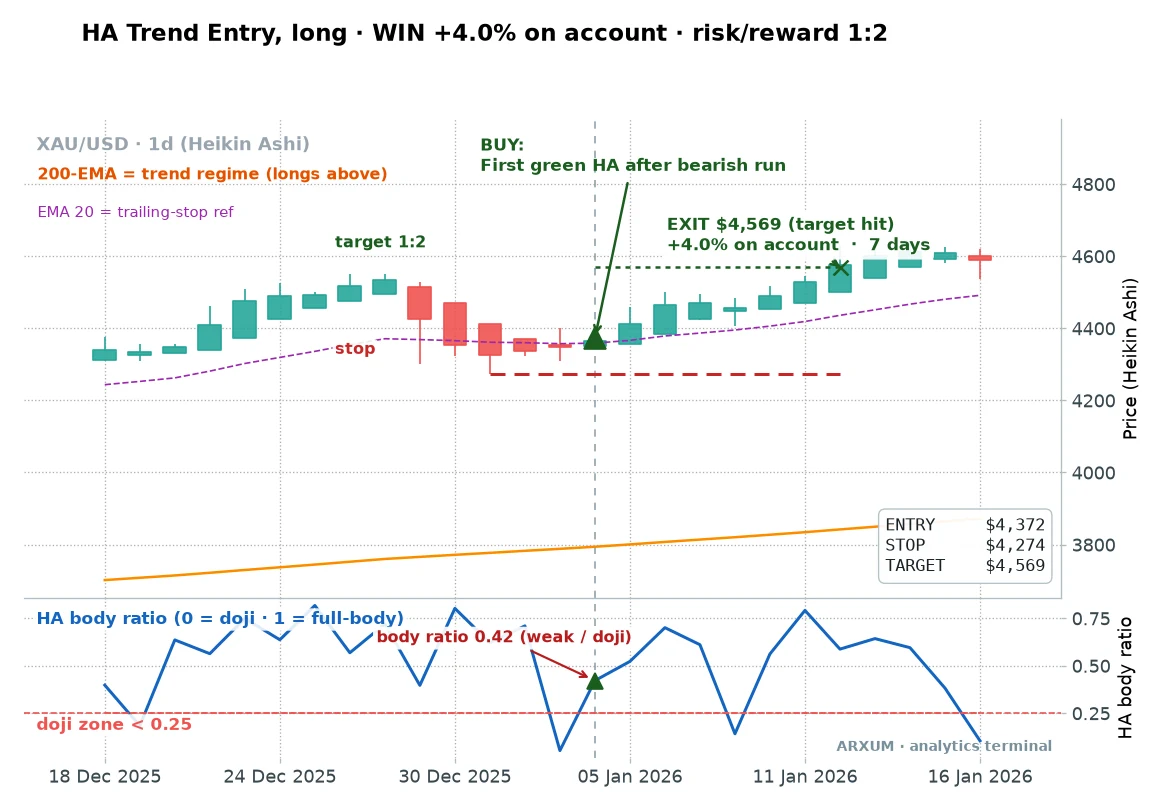
This is the most recent of the worked trades, so it answers the real question: does this still work now, not just years ago. The bearish run exhausted, the first green candle printed, and gold pushed into a clean trending day.
Stop under the swing low, target at twice the risk, done.
The regime read here is the 200-day EMA, a slow average of the last 200 closes. Price above a rising one means the trend is up, so you take longs only.
It is free on any chart, and the exponential moving average guide explains why the exponential version reacts a little faster than a plain average.
Here is a second flip, on a bigger breakout leg.
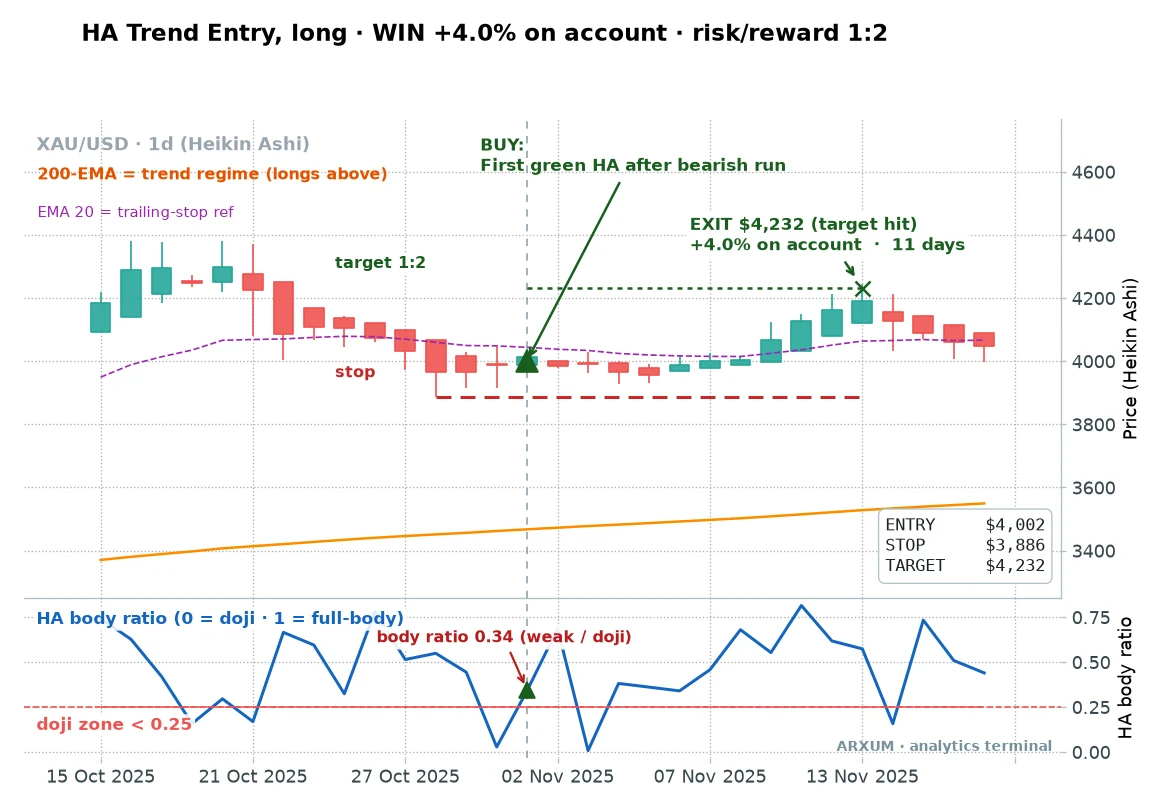
Same mechanics, more room. The flip caught the start of a strong leg with clear distance from the 200-EMA, which is exactly the condition you want.
When price hugs the average, flips whipsaw; when it is stretched above it, the trend has conviction.
The full trade history shows the honest face of it.
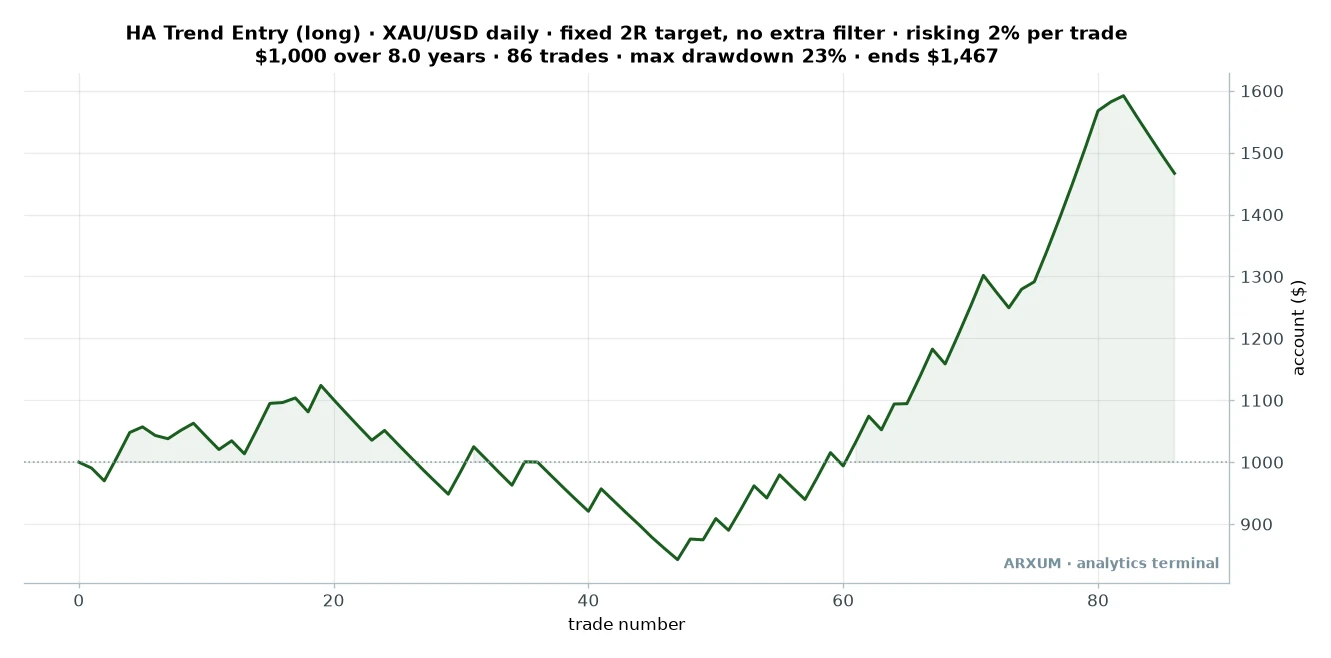
| Trades | 86 |
| Win rate | 48% |
| Reward-to-risk | 1:2 |
| Profit factor | 1.59 |
| Max drawdown | 23% |
| Net return on $1,000 | +47% |
A 48% win rate with a 1:2 reward still makes money, because the winners are twice the size of the losers. That is the whole point of trading the reward-to-risk, not the win rate.
This setup wants calm too. Screening for the quiet half of the range lifted the profit factor from 1.59 to 2.10, and the EMA50 double-agreement lifted it to 2.01.
The trend flip is cleaner when the market is not thrashing around the turn.
And it fails, plainly, when you catch a flip inside a downtrend that the trend filter should have blocked.
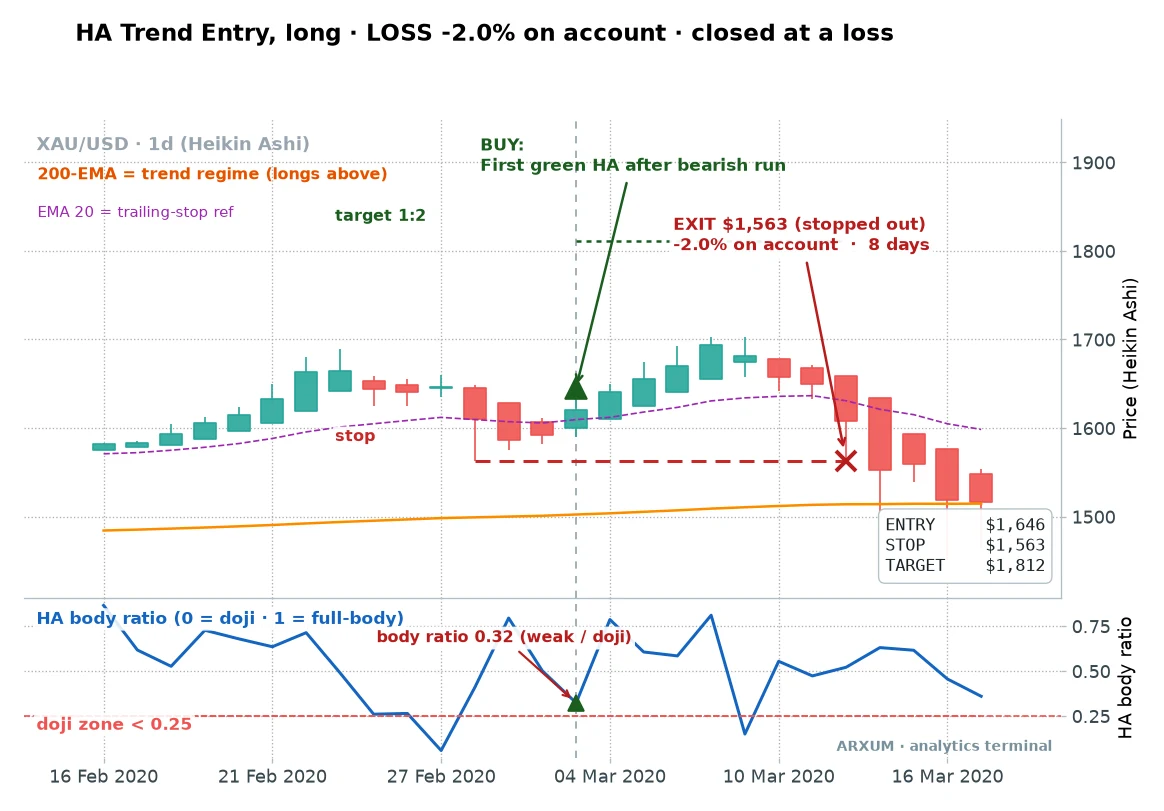
The green candle printed during an extended slide, a brief recovery that did not hold. Price closed back below and the stop did its job.
That is a normal loss, and the 200-EMA filter cuts most of these, but not every one.
Setup three: the doji reversal, the sharpest edge
The third setup is the one worth the read. It trades exhaustion, and on gold it posted the strongest numbers in the whole study by a wide margin.
The rule: after at least three same-colour Heikin Ashi candles, watch for a doji, a candle whose body shrinks to almost nothing. That is the trend running out of fuel.
When the next candle flips colour, you take the reversal.
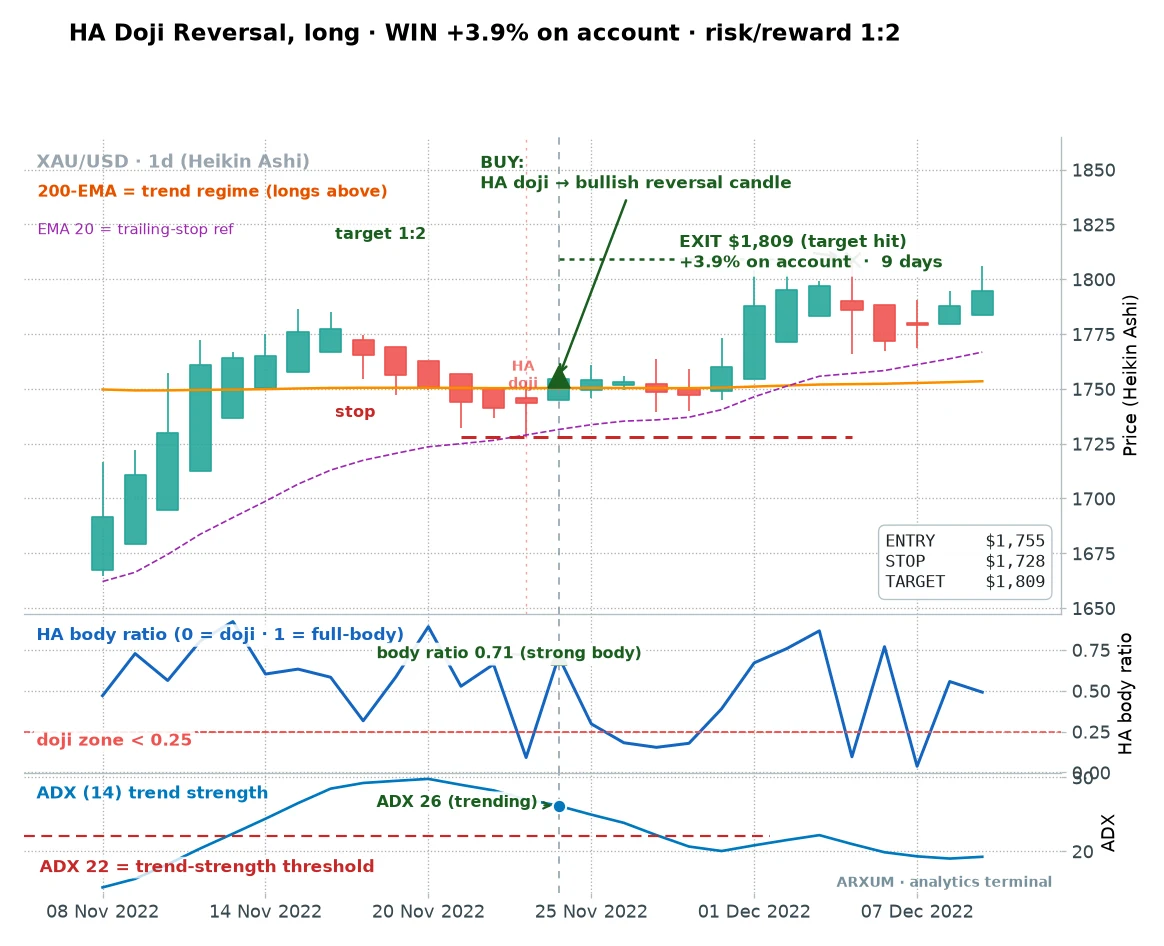
You can see the whole story in three candles. A bearish run pushed price down, the body then collapsed into a doji, and the next candle turned green.
You bought the reversal, stopped just beyond the doji’s low, and targeted twice the risk. Because the stop sits so close to the doji, the risk is tight, which is why this setup can pay handsomely when it works.
A doji is a specific candlestick shape. The doji candlestick guide covers how to spot it on any chart.
Here is a second, more recent one.
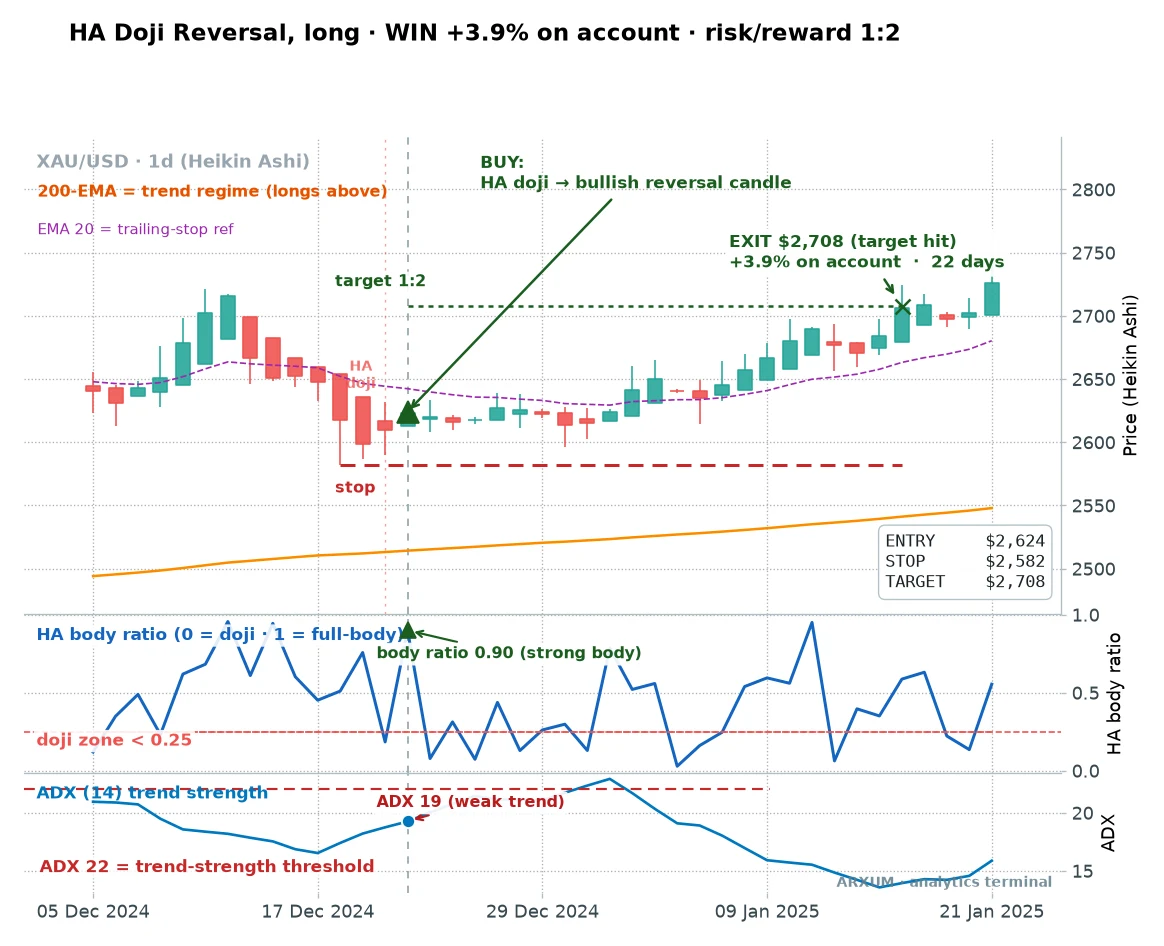
Same three-candle shape, cleaner exhaustion. The bearish run stalled into the doji, the reversal candle confirmed, and momentum turned back up.
Tight stop, target hit.
The trade history is small but its shape is beautiful.
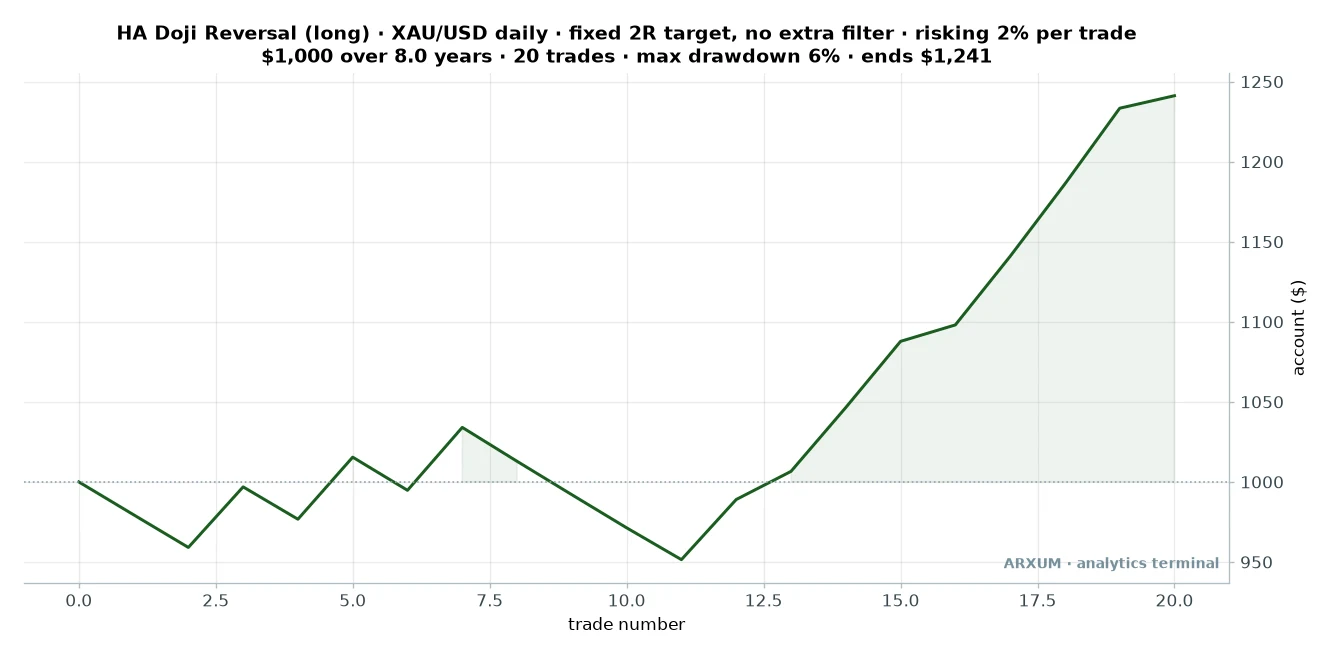
| Trades | 20 |
| Win rate | 60% |
| Reward-to-risk | 1:2 |
| Profit factor | 3.41 |
| Max drawdown | 6% |
| Net return on $1,000 | +24% |
Look at the drawdown: 6%, the calmest ride of the three. The catch is the trade count.
Twenty trades over eight years is roughly two or three a year, so this is not a setup you trade every week. It is a sniper’s tool, not a machine gun.
One practical heads-up before these numbers pull you in. The gold version needs a big enough account to place at all.
On a small $500 to $1,000 account, gold’s wide dollar stop pushes the position below your broker’s smallest size, so you would run this same exhaustion setup on EUR/USD instead. The full sizing math is worked out at the end, in the practice section.
The twist: doji reversals want a loud market
Here is the finding that makes this article worth your time. The doji reversal wants the exact opposite market conditions to the other two setups.
The no-wick run and the trend flip both pay best when the market is calm. The doji reversal pays best when the market is volatile.
The base profit factor for the doji reversal is 3.41. Here is how each filter moved that one number, so you can see which ones matter:
- Loud half of the range: lifted it to 6.65.
- Calm filter, the one that helps the other two setups: dropped it to 1.36.
- RSI aligned with the new direction: lifted it to 5.29.
- ADX above 22: also helped. ADX is a 0 to 100 gauge of how strong a trend is.
The reason is mechanical once you say it out loud. A doji is only meaningful if the run before it was real momentum.
In a volatile market, three hard candles down then a sudden stall is genuine exhaustion, a stretched move snapping back. In a quiet market, the same doji is just drift, and there is nothing to reverse.
Both RSI and ADX say the same thing in different words: the underlying push has to be strong for the exhaustion to be tradeable. The ADX indicator guide shows how to read that gauge.
The rule of thumb: trade the doji reversal when the market is loud and stretched, and leave it alone when it is drifting. That is the reverse of everything you were told about the other two.
It has an honest loss, too, when the “reversal” candle turns out to be a pause rather than a turn.
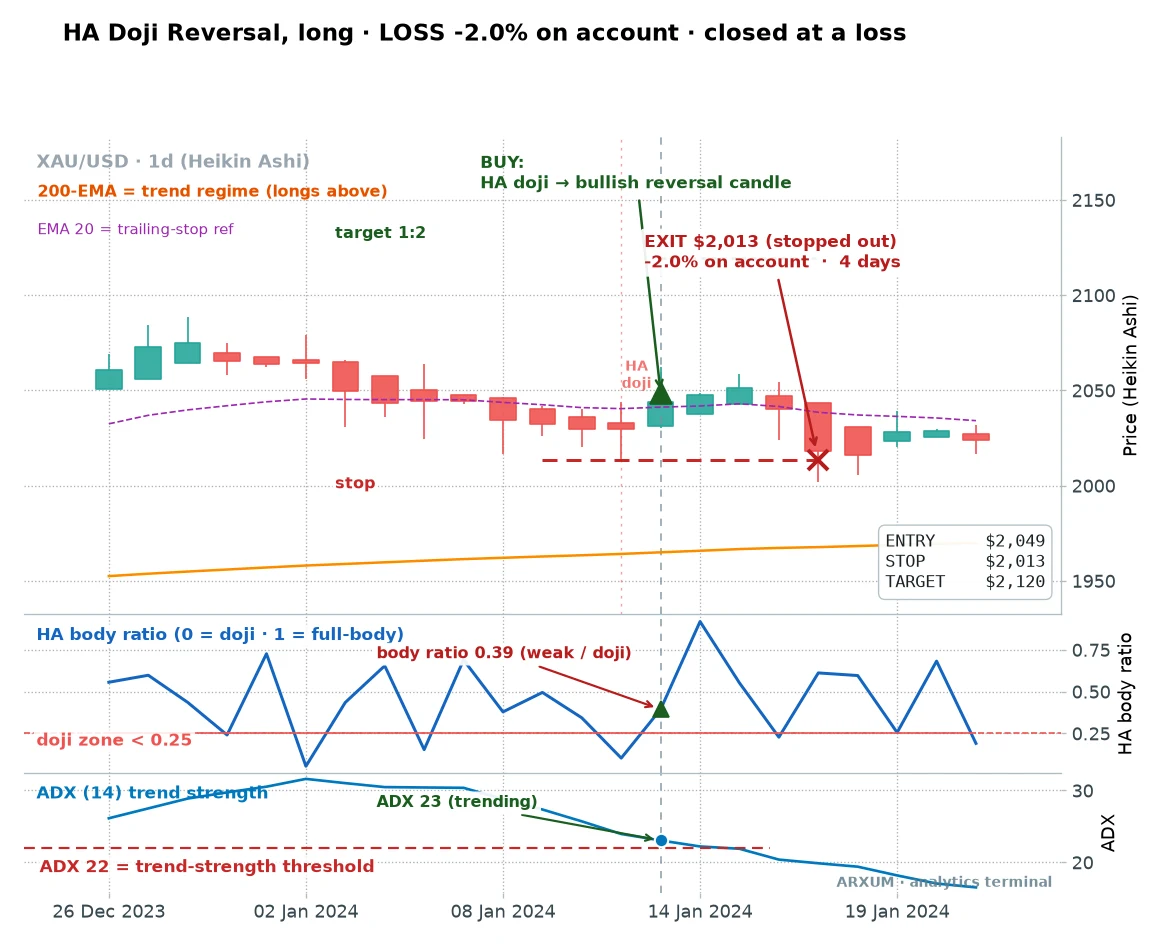
The body barely cleared the threshold to count as a reversal, price never followed through, and it stopped out. The loss was small because the stop was tight, which is the trade-off of this setup: it loses often enough, but each loss is cheap and the winners are worth twice the risk.
The key finding, on one chart
Put the three setups against the three markets and one picture tells the whole story of where Heikin Ashi has an edge and where it does not.
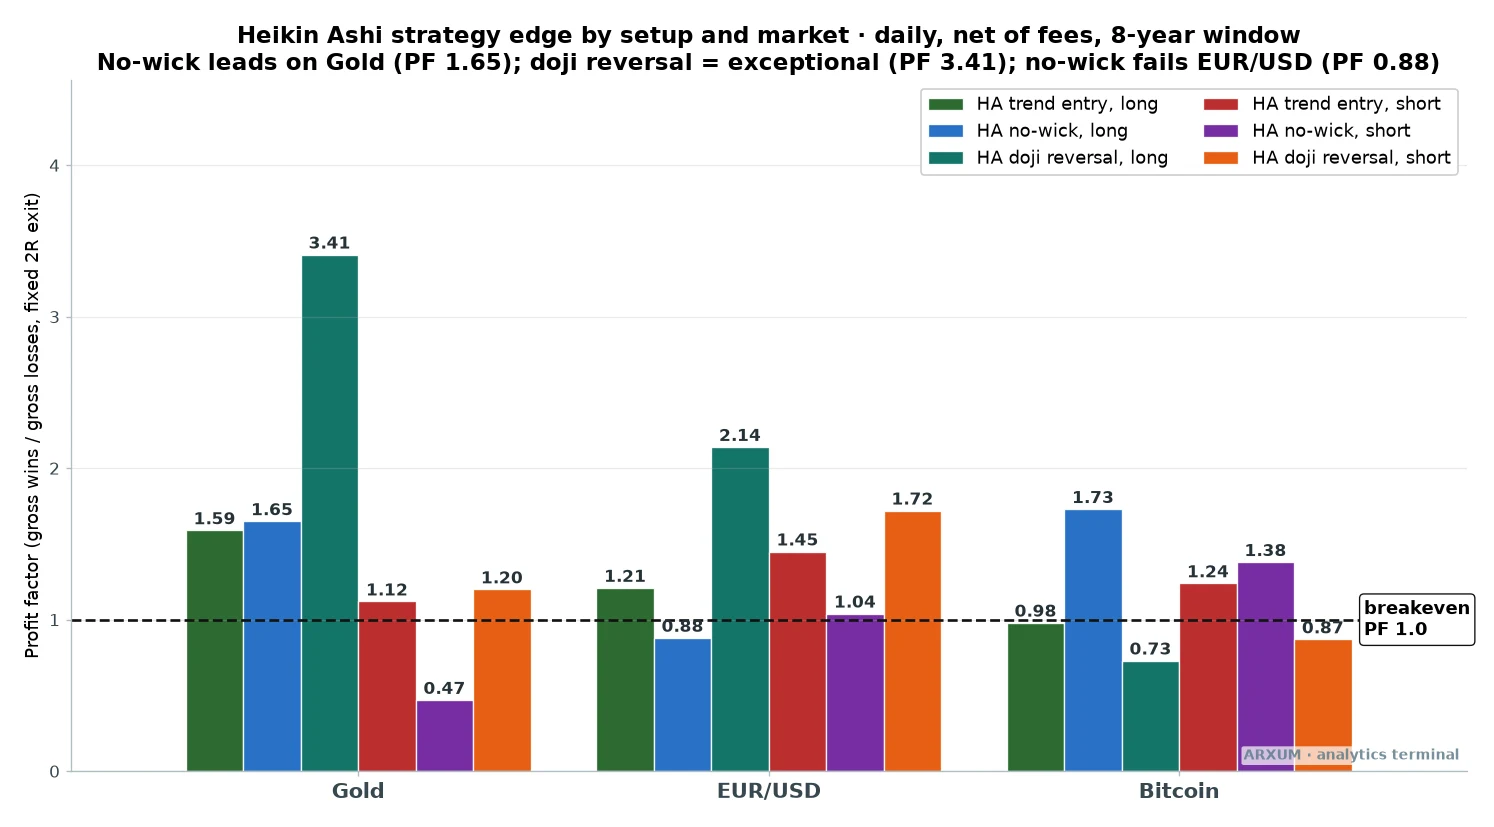
| Market | Doji reversal | No-wick run | Trend flip |
|---|---|---|---|
| Gold (XAU/USD) | 3.41 | 1.65 | 1.59 |
| Bitcoin (BTC) | 0.73 | 1.73 | 0.98 |
| EUR/USD | 2.14 | 0.88 | 1.21 |
The pattern is not random. Gold, in a record bull run, rewards all three long setups.
Bitcoin, which trends hardest of the three, rewards the pure momentum no-wick run above everything. The euro, which chops more than it trends, only really pays the doji reversal, its mean-reverting setup.
The lesson: match the setup to how the market moves. A trending market wants the momentum setups; a rangier one wants the reversal.
The candle shape is only half the trade. The market’s character is the other half.
Does the edge survive beyond gold?
A finding on one market is a coincidence. The reason to trust the no-wick run is that it paid on the market that trends hardest of all, Bitcoin (BTC).
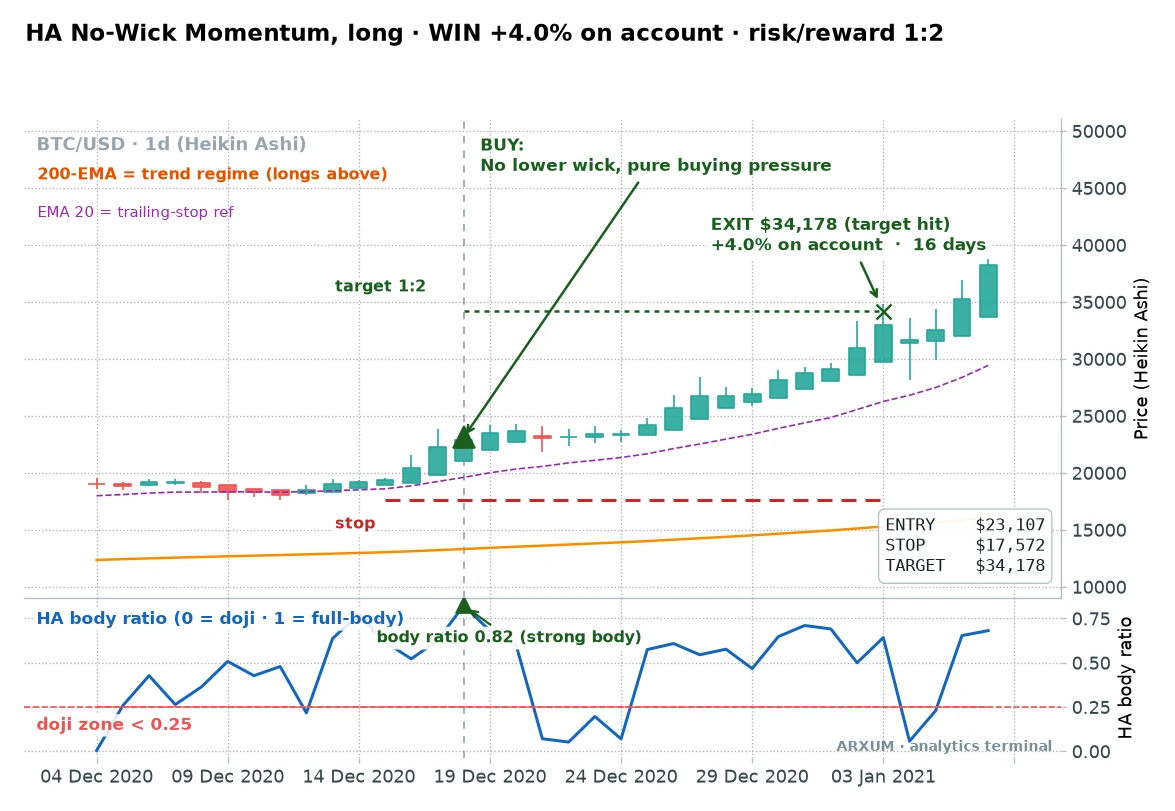
Bitcoin makes the longest, cleanest trends in the study, so a momentum candle there can catch an enormous run. The no-wick setup posted a 1.73 profit factor across 79 trades on BTC, the best raw number for that setup on any market.
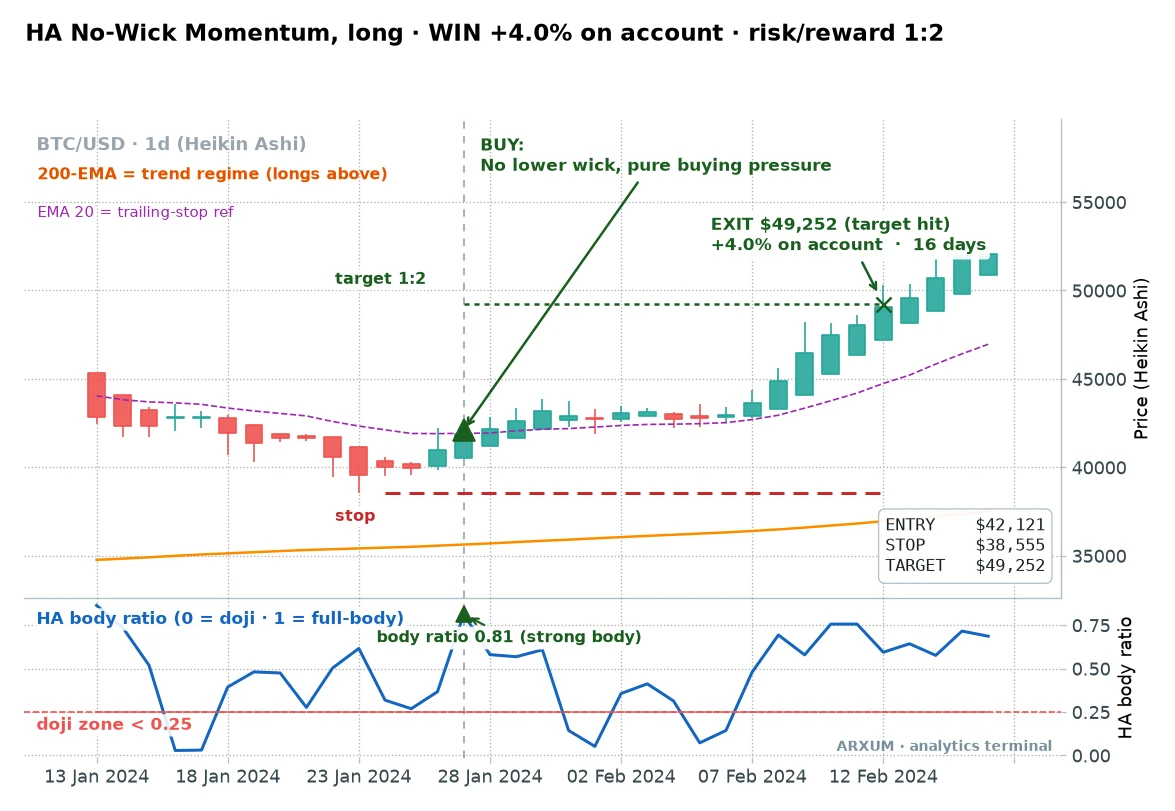
There is a real caveat, and it is worth stating plainly. Bitcoin’s no-wick edge was strong in the early crypto bull and cooled to a slim 1.16 profit factor on the recent unseen data.
It held up when we added a MACD confirmation, taking the candle only when momentum agreed. The MACD indicator guide covers that filter.
Bitcoin also has no trading sessions and its volume data is patchy across venues, so treat crypto signals with a little more caution than gold.
The euro tells the honest opposite story. Its doji reversal held a 2.14 profit factor, but its short-side trend setup was the clearest failure in the study.
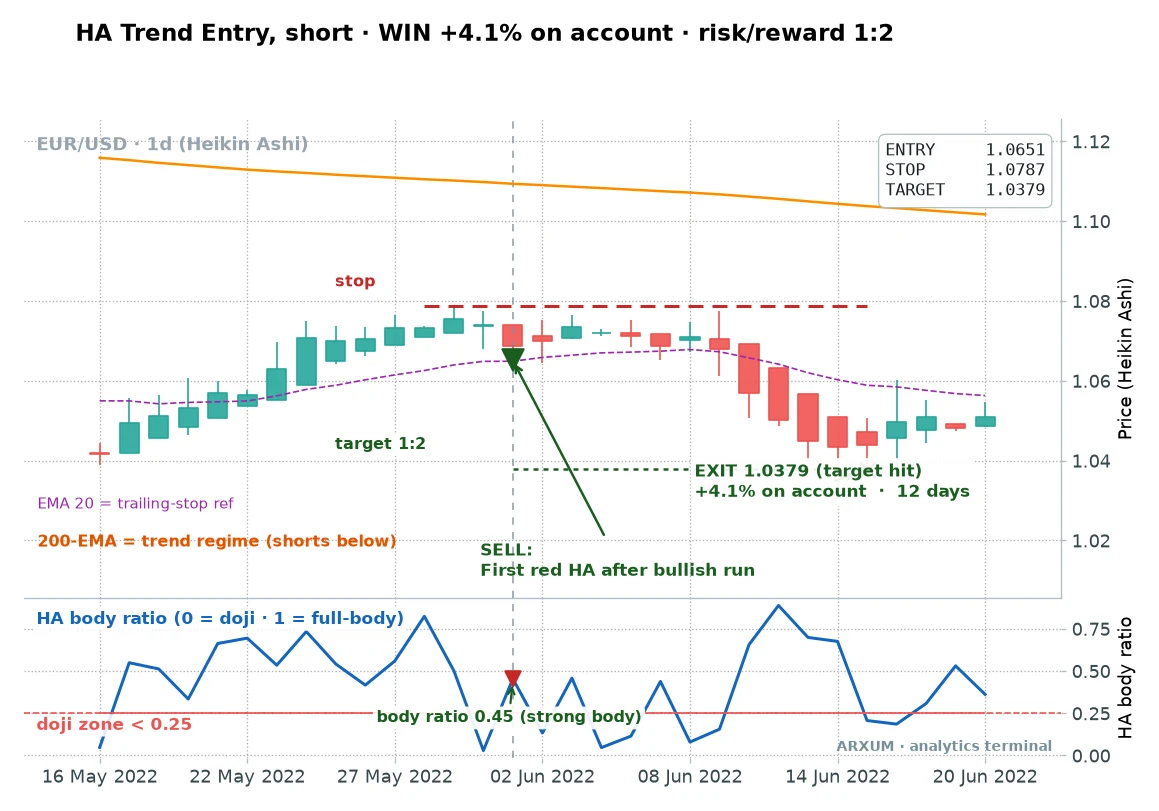
That trade won. The problem is it did not repeat.
On the earlier half of the data the EUR/USD short looked excellent, then it fell apart on the recent unseen half, dropping below break-even. Here is one of the losers.
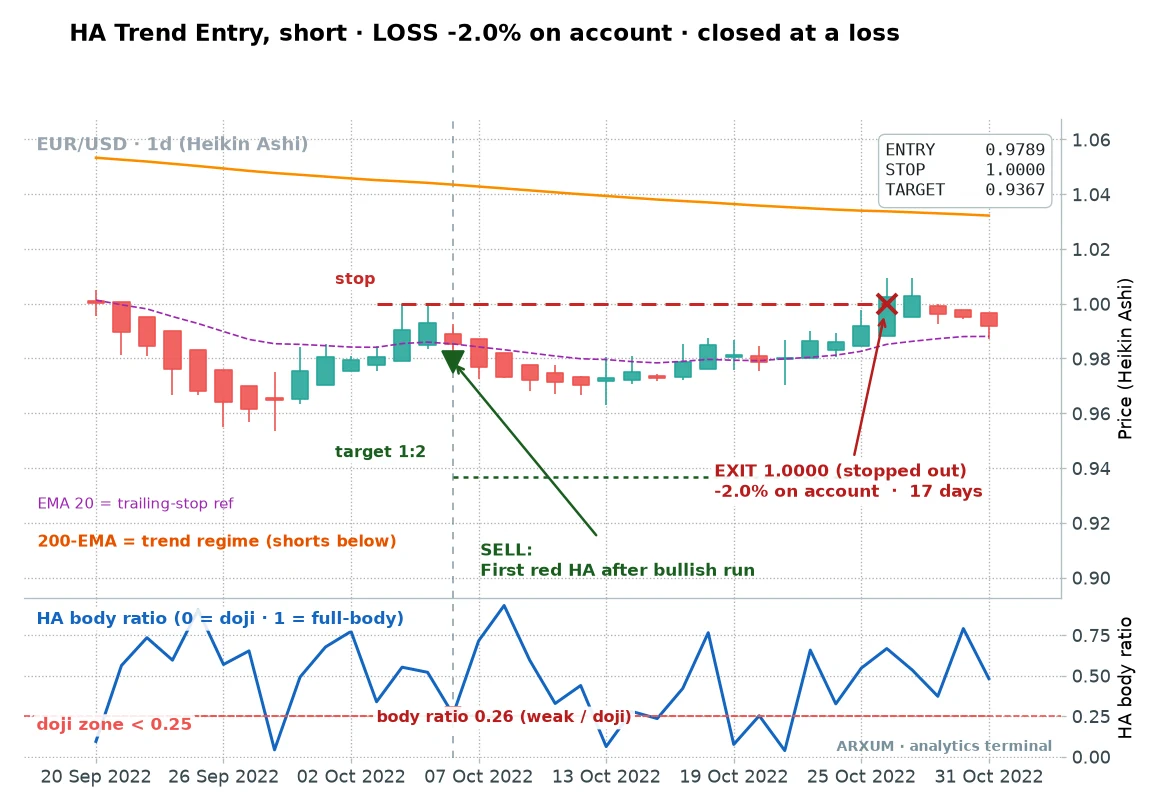
The euro’s short-lived flips kept snapping back. A setup that shines on old data and dies on new data is not an edge, it is a curve fit, and the euro short is a textbook example.
Trade the euro’s doji reversal if anything, not its trend shorts.
The honesty test: does it survive out of sample?
This is the test that separates a real edge from a number fitted to the past. We built the setups on the first four years, then checked whether the later four years, which the rules never saw, paid the same way.
| Setup | Built on early years | Tested on later, unseen years |
|---|---|---|
| Doji reversal | 0.97 | 6.70 |
| No-wick run | 1.22 | 1.99 |
| Trend flip | 0.76 | 2.26 |
Read this carefully, because it cuts both ways. An edge you can trust is one that survives data nobody tuned it to, and all three setups got stronger on the unseen years, not weaker.
That is the good news.
The honest news is why. All three improved because gold entered its record bull run in the later years, and these are trend and momentum tools.
They were quiet in the choppy early years and came alive when a real trend arrived.
So the edge is genuine, but it is a bull-market edge. If gold spends a year going sideways, expect these setups to grind, not gallop.
That is not a flaw to hide; it is the condition they need, and knowing it is what keeps you from trusting them in the wrong weather.
Where it breaks: the short side
The clearest failure across the whole study was the short side. On every market in the study, selling Heikin Ashi signals lost money or barely broke even.
The gold no-wick short lost 28% over the eight years. The euro trend short died out of sample, and Bitcoin shorts lost on both setups.
The reason is not subtle. Gold and Bitcoin were in strong bull runs, you cannot fade a bull run, and every short was a bet against a trend that kept going.
This is where the 200-EMA earns its keep as a switch, not just a filter:
- Take longs only while price is above a rising 200-EMA. That is where all the edge in this study lived.
- The short side opens only when price is genuinely below a falling 200-EMA. In a real downtrend the mirror setups should work, but the test period never gave gold or Bitcoin one to prove it.
Match the tool to the market. Heikin Ashi in this era was a long-only story, because the markets were.
Which timeframe
Everything here is the daily chart, and that is deliberate. Heikin Ashi smooths, and smoothing needs enough bars to mean something.
Drop to a 15-minute or 1-hour chart and the averaging works against you. The candles lag the fast moves, you enter late, and the noise the method is supposed to remove comes flooding back through sheer bar count.
On the desk, the smoothing that helps a swing trade quietly bleeds a scalp.
If you want fewer, higher-quality signals, the daily is the home for these setups. The 4-hour is a reasonable middle ground for the no-wick run if you want more trades, but expect more false starts.
How to trade the Heikin Ashi strategy in practice
Here is the whole method in concrete steps, with a real sizing example so the numbers are not abstract.
- Switch your candles to Heikin Ashi. On the free tier of TradingView, open the chart style menu in the top toolbar and pick Heikin Ashi. On MT4 or MT5, add the built-in “Heiken Ashi” indicator from Insert, Indicators, Custom. Set the daily timeframe.
- Add the trend and volatility tools. Add the “Moving Average Exponential” set to length 200, and a second at length 50. Add “Average Directional Index (ADX)” at length 14, and “Average True Range” at length 14. These are all one-click built-ins; do not hunt for custom scripts.
- Check the regime first. For longs, price must be above the 200-EMA. Best of all is when the 50-EMA is also above the 200-EMA, the double-agreement that lifted every setup.
- Pick the setup that fits the market. Calm and trending: take the no-wick run or the trend flip. Loud and stretched after a long run: take the doji reversal. Read “calm” off ATR sitting below its recent median, “loud” off ATR above it.
- Place the order. Enter at market on the signal candle’s close. Set the stop-loss field just beyond the recent swing low for longs, or beyond the doji’s extreme for a reversal. Set the take-profit field at twice the stop distance.
- Sit on your hands. These are daily setups. Once the order is placed, you check it once a day, not once an hour.
Now the sizing, worked from the account down. Take a gold no-wick long, entry near $3,400, stop under the swing low at $3,290.
Risk 2% of a $1,000 account.
- Risk budget: 2% of $1,000 = $20.
- Risk per ounce: $3,400 entry minus $3,290 stop = $110 per ounce.
- Position size: $20 risk budget ÷ $110 per ounce = 0.18 ounces.
Gold trades in lots, not loose ounces: a standard lot is 100 ounces, a micro is 1. So 0.18 ounces is below even a single micro lot.
The honest read: on a $1,000 account at 2% risk, you cannot take this gold trade at all. The dollar stop is too wide for that account.
You would need a broker offering cent-lot or fractional sizing, or a larger account, before gold is tradeable at this risk.
So here is one that actually fills, the doji reversal on EUR/USD, where the stop is tight in pip terms and the position is small in dollar terms.
- Sell, or in this case buy the reversal, entry at 1.0850, stop beyond the doji low at 1.0790 = 60 pips.
- Risk budget: 2% of $1,000 = $20.
- Risk per micro lot: 60 pips at $0.10 per pip = $6 per micro lot.
- Position size: $20 ÷ $6 = 3.3 micro lots, so round down to 3 micro lots, risking about $18.
- Target: twice the stop, 120 pips, at 1.0970.
Three micro lots is about €3,000 of position, roughly 3 times a $1,000 account, so an effective leverage near 3:1. Your broker’s 1:30 headroom is just what lets you hold that size; it is not extra risk.
The 2% you put at risk already caps the downside.
That is a trade a $500 or $1,000 account can genuinely place. Size always bends to the risk, never the other way around, and you never widen the stop to force a bigger position.
To save you flipping back, here are three ready configurations from the study:
- Gold, daily, no-wick run. Full-body no-wick candle, price above the 200-EMA, ATR below its median. Stop under the swing low, target 1:2. Skip it on a volume spike.
- Gold, daily, trend flip. First green candle after a red run, price and the 50-EMA both above the 200-EMA, calm range. Stop under the swing low, target 1:2.
- Gold or EUR/USD, daily, doji reversal. At least three same-colour candles, then a doji, then an opposite-colour flip, in a loud market with ATR above its median and RSI agreeing. Stop beyond the doji, target 1:2.
What this costs you, and the discipline that pays
Heikin Ashi setups earn their money the way every trend tool does. A middling win rate, a string of small losses, and a run of 1:2 winners that carry the year.
You have to sit through the flat stretches to be there for the payoff.
That shapes the discipline, and none of it is filler:
- Expect losing streaks. The trend flip wins 48% of the time, so three or four losses in a row is ordinary variance, not a broken method. The doji reversal, at 60%, still hands you back-to-back losers. Do not abandon a setup after two whipsaws like the gold losses above.
- Six losses in a row is the warning. That is beyond normal, and a signal to check whether gold has stopped trending and slipped into a chop. Chop is the one condition that switches all of these edges off.
- Do not chase, do not revenge-trade. The daily timeframe protects you here. One decision a day, placed and left alone, is far harder to sabotage than a chart you stare at every hour.
Keep a calm eye on your live results against these numbers. If your trading runs a little worse over a handful of trades, that is normal variance, not a verdict.
If it runs much worse across a real sample, the market has probably shifted out of the trending regime these setups need. Step back and check conditions before adding risk.
Only ever trade money you can afford to lose. Heikin Ashi is a tool that works in trends, not a machine that prints in all weather.
Where to go from here
Two natural next steps build directly on this method:
- The Heikin Ashi candles guide is the deeper primer on how the candles are built and read, if you want the mechanics before you trade them.
- The risk-reward-ratio guide locks in the 1:2 framing every setup here leans on, so you size the next trade with the reward already in view.
FAQ
What is Heikin Ashi, in plain terms?
Does the Heikin Ashi strategy actually work?
What is the difference between Heikin Ashi and regular candlesticks?
What are the best Heikin Ashi settings?
Which Heikin Ashi setup is best?
Which markets and timeframe work best?
Can I use Heikin Ashi for day trading on lower timeframes?
Can I trade the short side with Heikin Ashi?
Why do doji reversals want a volatile market but the other setups want a calm one?
How much money do I need to start?
How many losses in a row should I expect?
What do the key terms mean?
Real-time trade setups with entry, stop loss and take profit. Daily market analysis. No subscription, no complicated theory.
🌍 Our recommended brokers


Reader Reviews
Be the first to review this — tell other traders what actually helped, or where it fell short.
Leave a Review

Forex Analyst & Senior Trader
Former FX desk trader with 8 years in institutional forex. Works in multi-timeframe analysis and order flow, turning desk experience into systematic, testable rules across forex and metals.
