What a pin bar looks like
Before any numbers, here is the shape. Bullish pin on the left, bearish pin on the right, the way a textbook draws them.
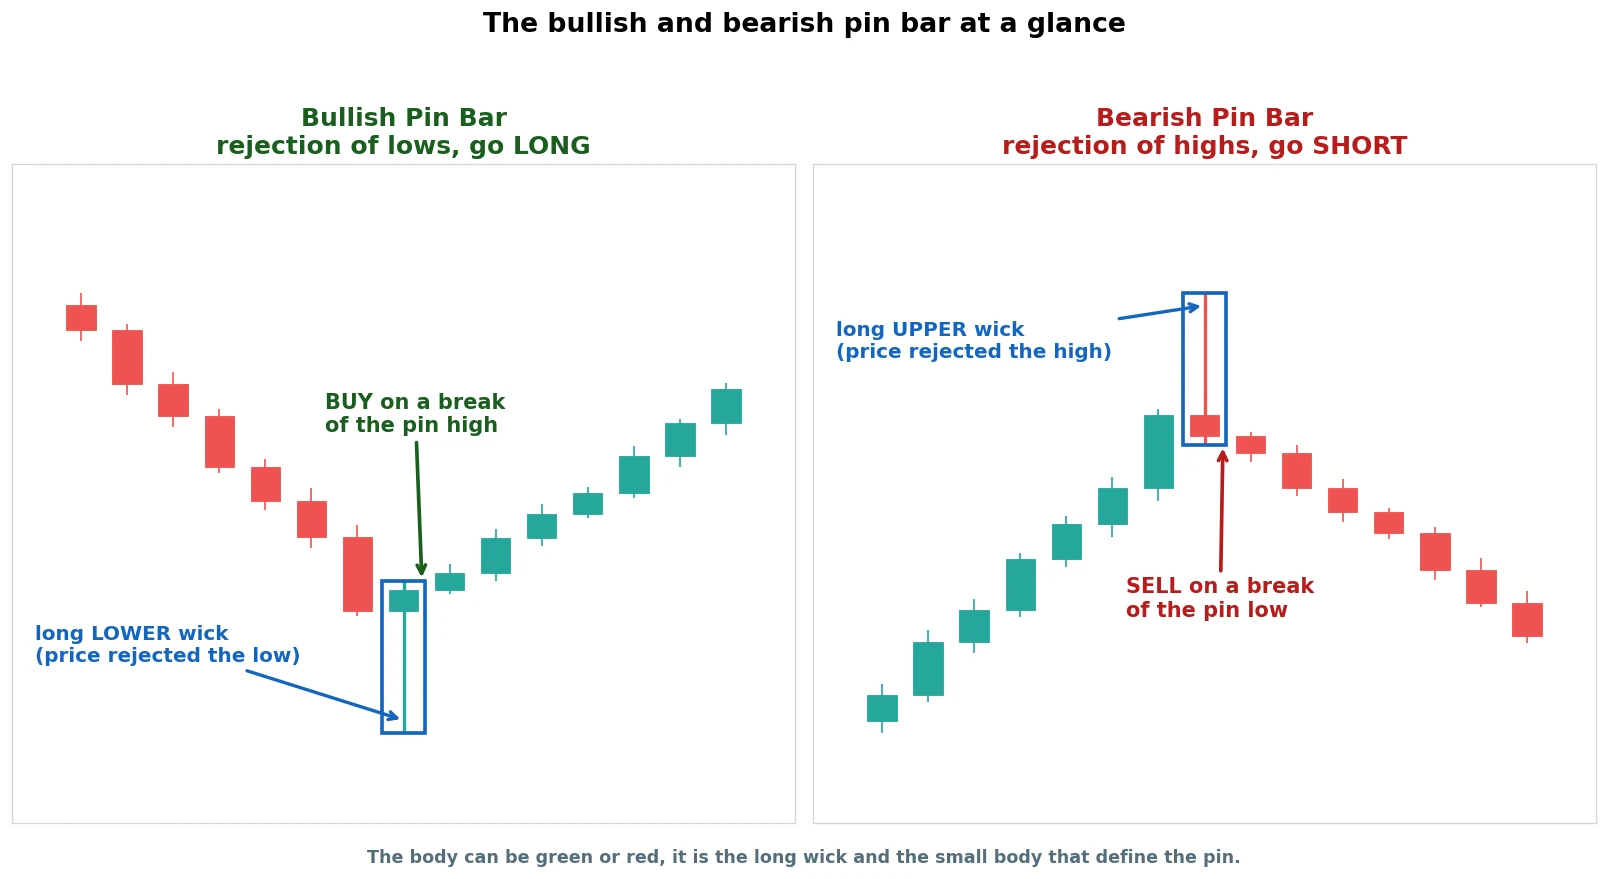
A bullish pin bar is one candle with a long lower wick and a small body sitting up near the top. Price sold off hard inside that candle, then buyers slammed it back up before the close. That long tail is sellers being rejected. The pin bar candlestick works as a turn signal because the move down failed in plain sight.
A bearish pin bar is the mirror. A long upper wick, a small body near the bottom. Price spiked up, got rejected, and closed back near where it started. Buyers tried and failed.
The single candle has a few nicknames. Some call it a pinocchio bar, because the long wick is the lie the market told before the truth came out. Whatever you call it, the read is the same: a long wick is rejection, and rejection at the right spot can mark a turn.
That is the textbook. It is also where most people stop, and it is exactly where the trouble starts.
By the end of this you will have the one filter that turned this coin-flip candle into a real, tested edge, the markets it works on, and a trade you can size on a small account. First, the honest problem.
The honest problem: the raw pin bar is a coin flip
Here is the catch nobody puts in the headline. A long wick on its own does not tell you much. Wicks happen all the time, in the middle of ranges, inside trends, at the top of news spikes. Most of them lead nowhere.
We tested the plain pin bar across four markets on the daily chart, eight years each, every signal taken, fees included. The geometry was strict: the wick had to be at least twice the body, the body small and parked at the opposite end, and the candle had to sit at the extreme of a prior move it might reverse. No discretion, just the rule.
The raw result was almost nothing. On gold the pin bar finished at a profit factor of 1.06. Profit factor is the whole strategy in one number: every dollar won divided by every dollar lost, so above 1.0 it makes money and below 1.0 it bleeds. A 1.06 means you scraped back a dollar and six cents for every dollar you lost, a coin flip with the lights on.
Silver came in at 1.05. Oil was a little better at 1.23. Bitcoin looked great at 2.16, but that number is a trap I will come back to. Three of the four markets sat right on the breakeven line.
So the pin bar is not a strategy. It is a starting point. The interesting question is what turns it into one.
The fix: trade the pin bar with the trend
We did not bolt on the usual filters. The honest way to find what helps is to sweep a whole menu and keep only what the data rewards. So we ran the pin bar through volume, moving-average trend, RSI levels, momentum, volatility, wick size, and trend strength, and watched what each one did to the edge.
Most of them did nothing, or worse. Demanding a longer wick actually hurt. So did entering only when RSI was stretched. The popular advice, in other words, made the pin bar worse.
One filter stood out across every market: trend strength, measured by ADX, in the direction of the trend.
Two terms do the work from here on, so here they are upfront. Both are free, built-in indicators you add to any chart on TradingView in a couple of clicks.
- ADX is a trend-strength gauge. It runs from 0 to 100 and ignores direction. A low reading means the market is drifting sideways; a higher reading means it is trending. Traders draw the line at 20 or 25; we use 22 because that is the level the edge actually showed up at in testing. Above 22, the market is moving with purpose; below it, the market is just chopping and the pin is noise.
- The 200-EMA is a moving average that smooths the last 200 days of price into one line. Price above a rising line is an uptrend, price below a falling line is a downtrend. It is the simplest way to name the regime you are in, and it tells you which side to take: longs above it, shorts below.
This chart is the one the whole piece turns on. It scores the bullish pin bar two ways, raw and filtered, across four markets.
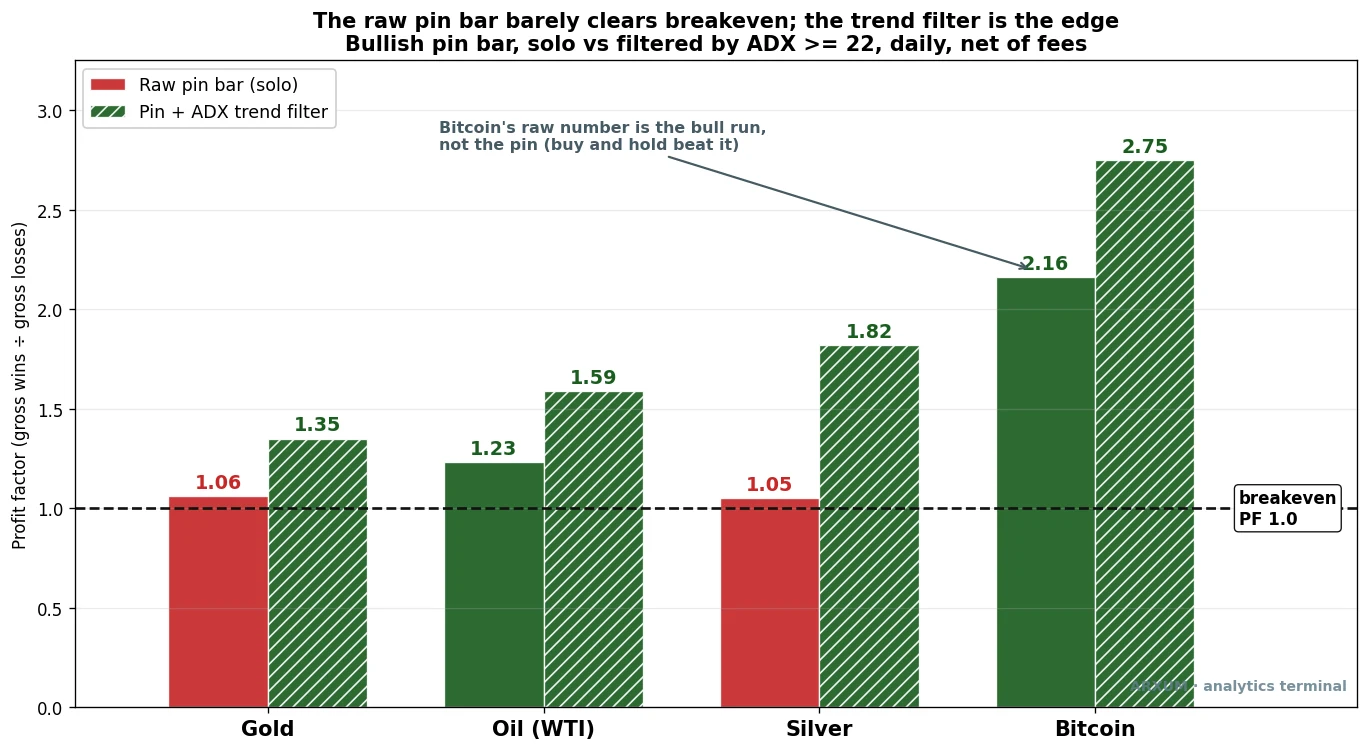
The lift is consistent across every market. The hatched bars are the pin taken only when ADX is above 22, and every one of them clears the raw bar. That is just the first filter, on its own.
One honest flag on this chart. Silver’s filtered bar looks the tallest at 1.82, but that number did not survive a fairness test we run later, so do not read it as the best market here. Treat silver as a warning, not a winner, and lean on gold and oil, which held up.
Put the two filters together and the rule is short. Take a bullish pin bar only when price is above the 200-EMA and ADX is above 22. Adding that second condition, the 200-EMA regime, on top of the ADX filter is what takes gold from the 1.35 on the chart up to a 1.58 profit factor. The pin then becomes a pullback that got rejected, in a market that was already going your way.
That is the key. A pin bar is not a reversal signal you throw in front of a freight train. It is a continuation signal. It catches the moment a trending market shakes out the weak hands and resumes, usually right at a level of support and resistance the trend was leaning on.
How to read the rules off a chart
Here is the ideal version, with every rule numbered on it, so the bullets above have a picture to map onto.
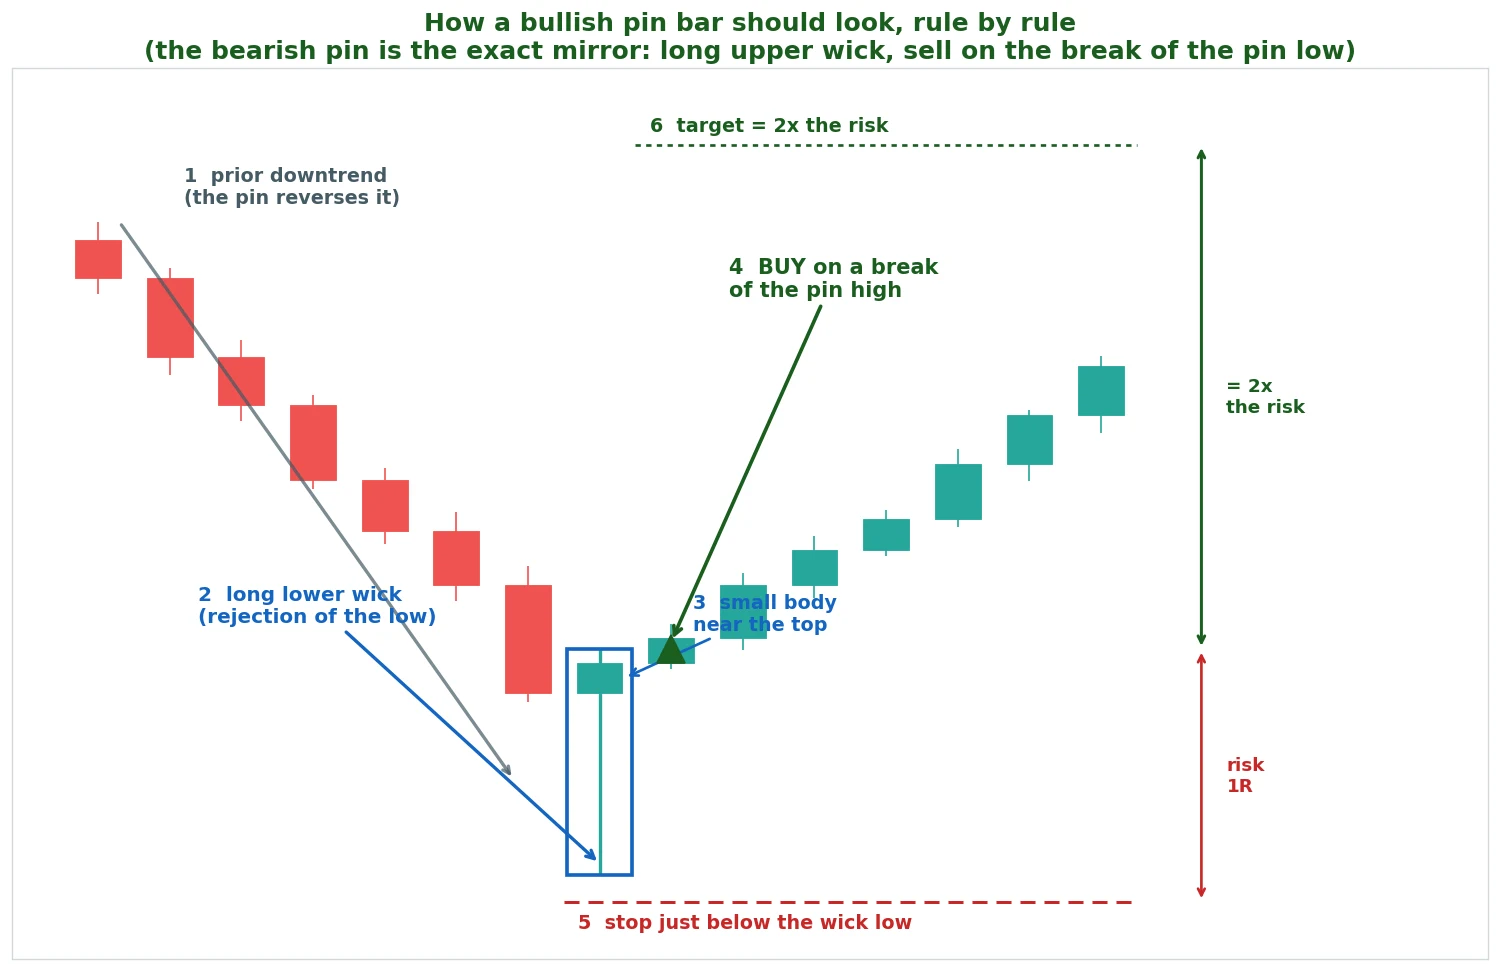
Walk it in order:
- A prior move into the pin. The candle has to sit at the end of a run, not in the middle of a range. For a bullish pin, price was pulling back.
- The long lower wick. At least twice the body. This is the rejection.
- A small body near the top. The close came back strong, near the high of the candle. A close stuck in the middle is a weak pin.
- Entry on a break of the pin high. You do not buy the pin itself. You wait for price to trade above the pin’s high, which confirms the rejection held.
- Stop just below the wick low. If price comes all the way back through the wick, the rejection failed and you are out.
- Target at twice the risk. Measure entry to stop, that is one unit of risk, and set the target two of those above entry.
The bearish pin is the same picture flipped: a long upper wick at the top of a rally, a small body near the bottom, sell on a break of the pin low, stop above the wick.
One thing to train your eye on. The wick is the signal, not its length. A pin with a wick three or four times the body is not better than one twice the body, our test was clear on that. What matters is where the pin sits and which way the trend points, not how dramatic the tail looks.
The method on gold
Gold is the cleanest example of the rule working, so we lead with it. Spot gold (XAU/USD) spent most of the test period grinding higher, which makes it a perfect home for a with-the-trend pin: buy the dip-rejections, never fight the climb.
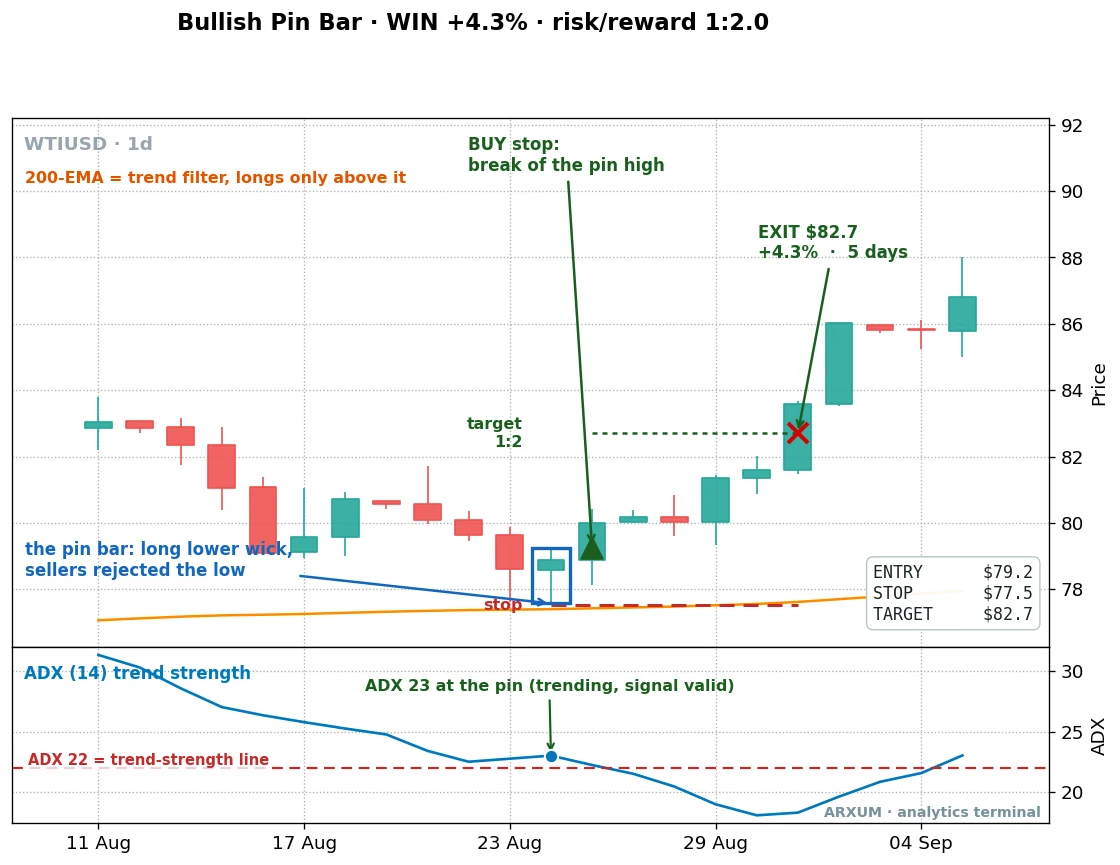
Here is a recent one.
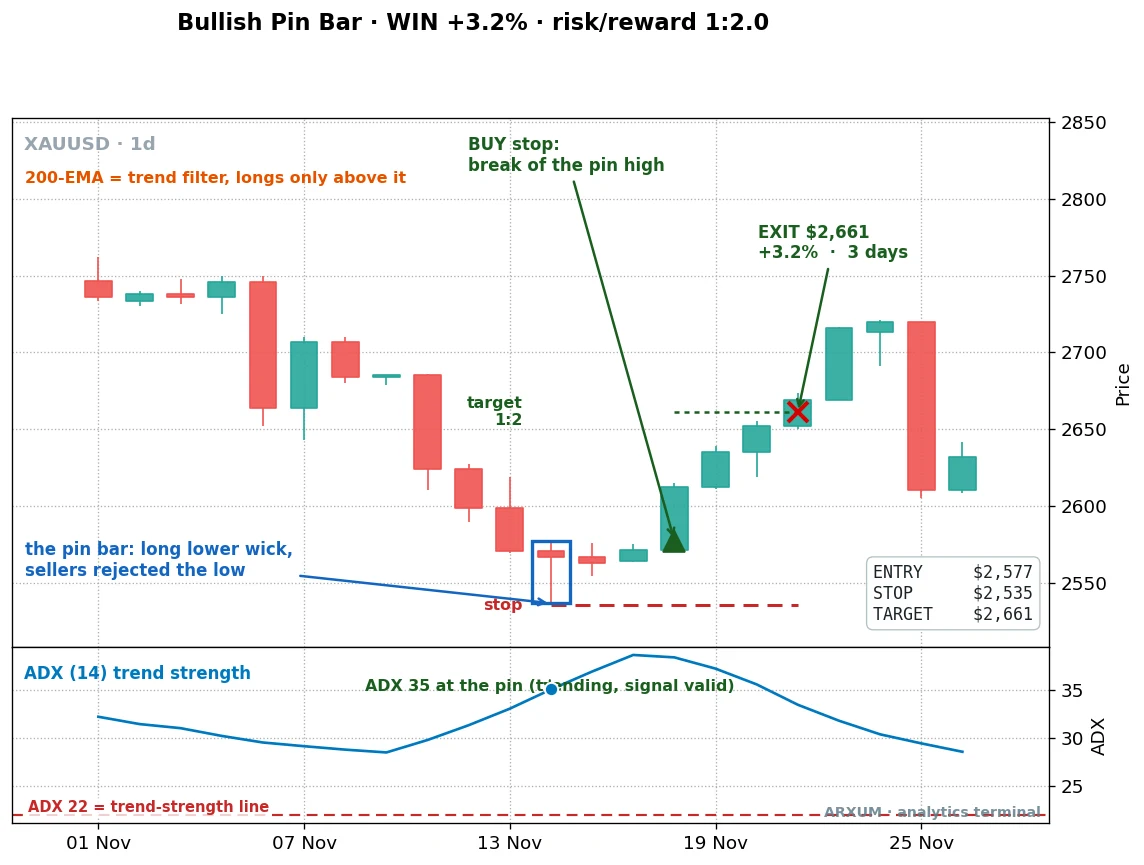
Read it left to right. Gold was in an uptrend, pulled back for a week, and printed a pin with a long lower wick right at the low of the dip. The ADX panel underneath read 35, well above the 22 line, so the trend was strong.
Entry came on the break of the pin high at $2,577, the stop just under the wick at $2,535. Target sat at twice that risk, $2,661, and price got there in three days. That is a reward-to-risk of 1:2, meaning the winner made two dollars for every dollar the stop risked.
Reward-to-risk and profit factor are different tools. Reward-to-risk is one trade: how much a winner makes versus what a loser costs, and the risk-reward ratio guide walks through the 1:X math in full. Profit factor is the whole strategy across every trade. You can have a modest win rate and still come out ahead if the winners are twice the size of the losers, which is the whole idea here.
Here is a second gold pin, a year earlier, same rule.
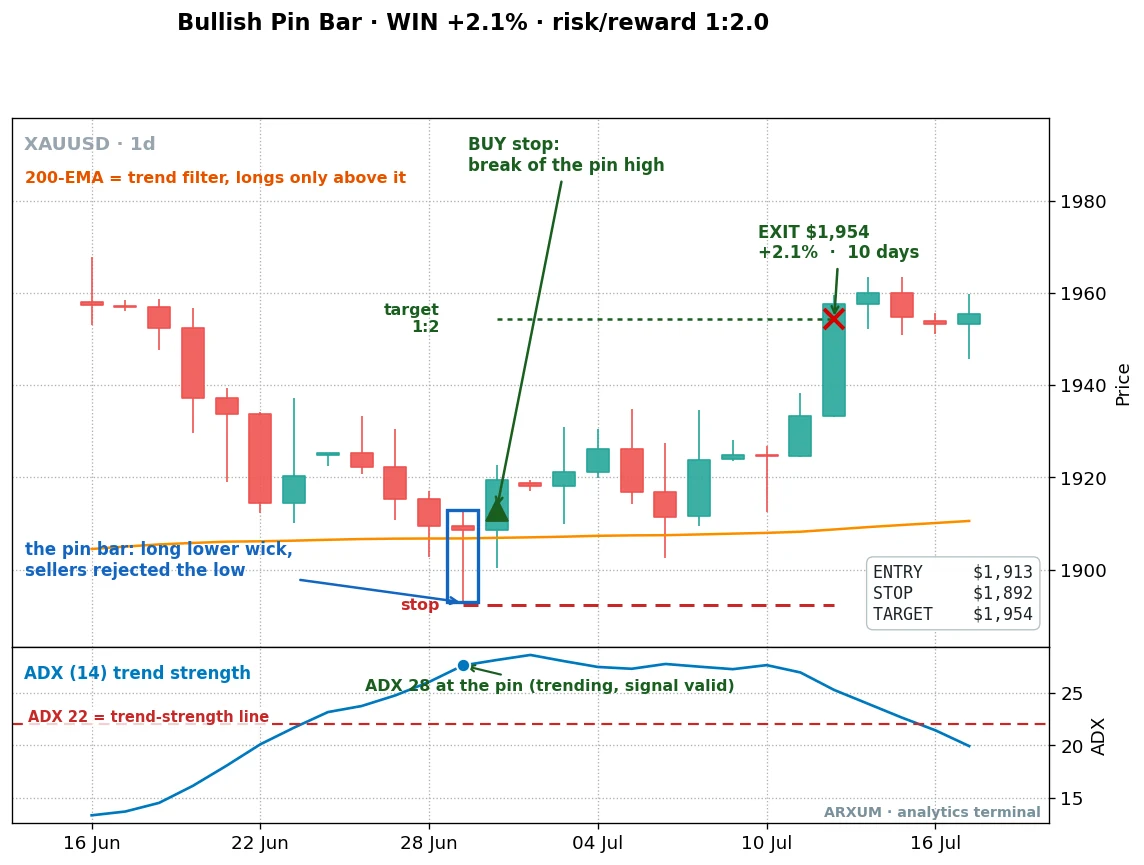
Same shape, same logic. A pullback in an uptrend, a long lower wick, ADX above the line, entry on the break, target at twice the risk. It took ten days to fill.
Nothing flashy, and that is the point. The gold pin is a slow, repeatable setup, not a lottery ticket.
Now the proof it pays over time, not just on two cherry-picked charts.
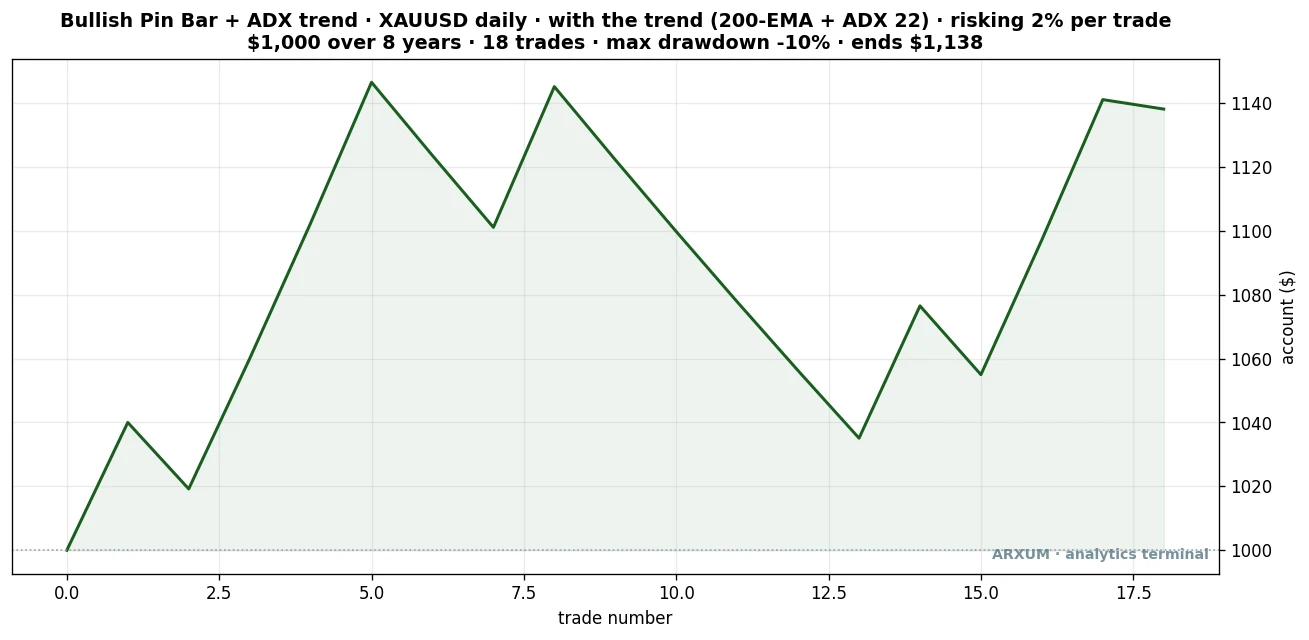
A balance curve is just your account over time, one step per trade, so read it as a story rather than a number. This is exactly what the gold method does: every bullish pin above the 200-EMA with ADX over 22, $1,000 to start, risking 2% a trade across eight years.
Notice the jaggedness and the dip of about 10% in the middle, that is the losing stretch you have to sit through. The line ends near $1,138 across eighteen trades, a slow climb that only pays if you take every signal. Here are the numbers behind it.
| Trades | 18 |
| Win rate | 44% |
| Reward-to-risk | 1:2.0 |
| Profit factor | 1.58 |
| Max drawdown | −10% |
| Net return on $1,000 | +13.8% |
A 44% win rate that still makes money tells you the reward is doing the heavy lifting. Most of these trades lose small. A handful run to the 1:2 target and carry the rest.
Does the edge survive on data it never saw?
A backtest can fit itself to the past. The check that matters is out of sample, which just means testing the rule on data it was never built on. So we split the eight years in half, built the picture on the first stretch, and tested it on the second, which the rule had no way to know.
On gold the pin bar held up. The first half ran a profit factor of 1.71, the second half, the unseen data, came in at 1.46. An edge that survives data it was never fit to is one you can trust.
It dropped a little, which is honest and expected, but it stayed clearly profitable. That is the difference between a real pattern and a curve-fit story.
The short side: where the bearish pin actually pays
Now the question every guide ducks. The bullish pin works in an uptrend. Does the bearish pin work in a downtrend?
It depends entirely on the market, and this is the second big lesson. Gold, silver and Bitcoin all spent the test period climbing, so their bearish pins kept firing into a rising market and getting run over. Shorting a pin in a one-way bull run is fighting the tide. The data is blunt: the Bitcoin bearish pin finished at a 0.66 profit factor, a clear loser.
The short side needs a market that genuinely turns both ways. Oil is exactly that. Crude (WTI/USD) is cyclical, pushed up and down by supply decisions, inventories and geopolitics, so it reverses in both directions. That is where the bearish pin has a home.
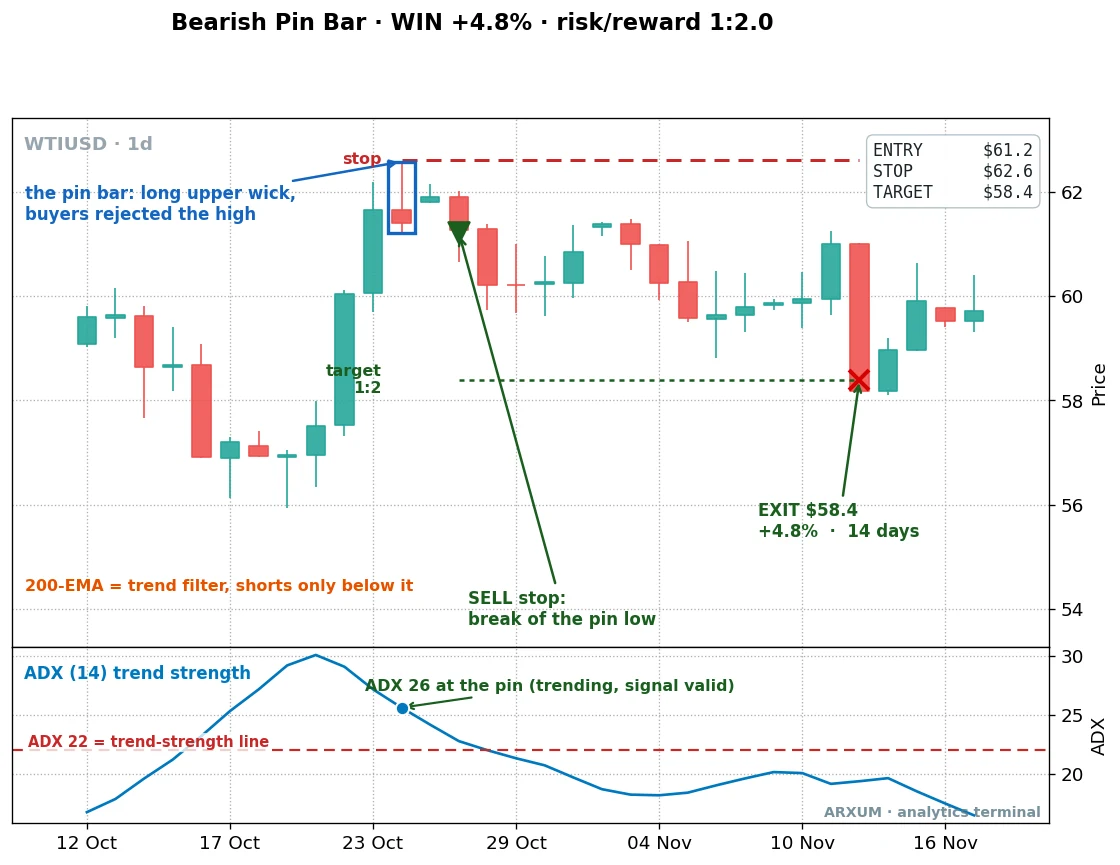
Read this one as the mirror of the gold trade. Oil rallied, then printed a pin with a long upper wick right at the high. The rejection was clear, the ADX was above the line, and the entry came on the break of the pin low at $61.2.
The stop went above the wick at $62.6, the target at twice the risk, $58.4. Price got there in fourteen days for a short that made +4.8% at 1:2.
Across the full eight years, the oil bearish pin with the trend filter ran a profit factor of 1.88 at a 50% win rate, and it survived out of sample. The second-half number even came in a touch higher than the first, though with only a couple of dozen trades that is more likely small-sample luck than a promise of better days ahead.
What matters is that it stayed clearly profitable on data it never saw. The short side is real. It just needs the right market under it.
Oil pays on the long side too, which is the tell that the market itself reverses both ways.
Same setup as the gold pins, on the long side of oil. A pullback, a long lower wick, ADX over the line, a clean run to the 1:2 target in five days. Now the full trade history of the oil short, curve first.
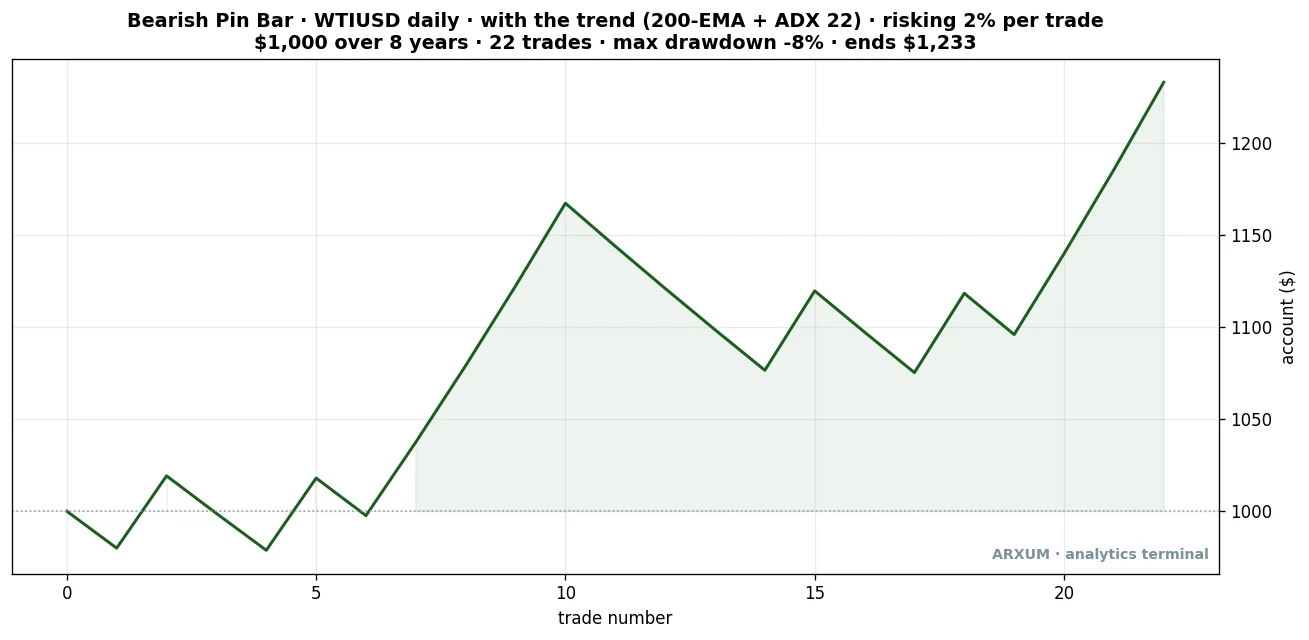
Read this the same way as the gold curve: every bearish pin below the 200-EMA with ADX over 22, $1,000 risking 2% a trade across eight years. The line is choppy early, then steps up as oil cycles down off its highs, ending near $1,233 across twenty-two trades. The deepest dip is about 8%, shallower than gold’s, because the oil short caught cleaner reversals. Here are the numbers.
| Trades | 22 |
| Win rate | 50% |
| Reward-to-risk | 1:2.0 |
| Profit factor | 1.88 |
| Max drawdown | −8% |
| Net return on $1,000 | +23.3% |
A stronger edge than gold, because oil reverses both ways and the moves are bigger. The trade-off is that crude swings hard, so the individual trades are wider.
The pin reads the same on Forex
Most readers trade Forex, so a fair question: does this work on the majors? The honest answer is that the pin bar reads identically on a pair like EUR/USD, the long wick, the small body, the trend filter, but in our eight-year test the majors threw up too few clean, trending pins to call it a standalone edge. The setup is sound; the sample is thin.
That does not make Forex useless here. A Forex major is the cheapest, most accessible place for a small account to learn this pattern, because a micro lot of EUR/USD is tiny and the spreads are low. EUR/USD spent the back half of the test sliding lower under a falling 200-EMA, so the with-trend setup there was a bearish pin, a short. Here is a clean one so you can see it obeys the same rule as the gold and oil pins.
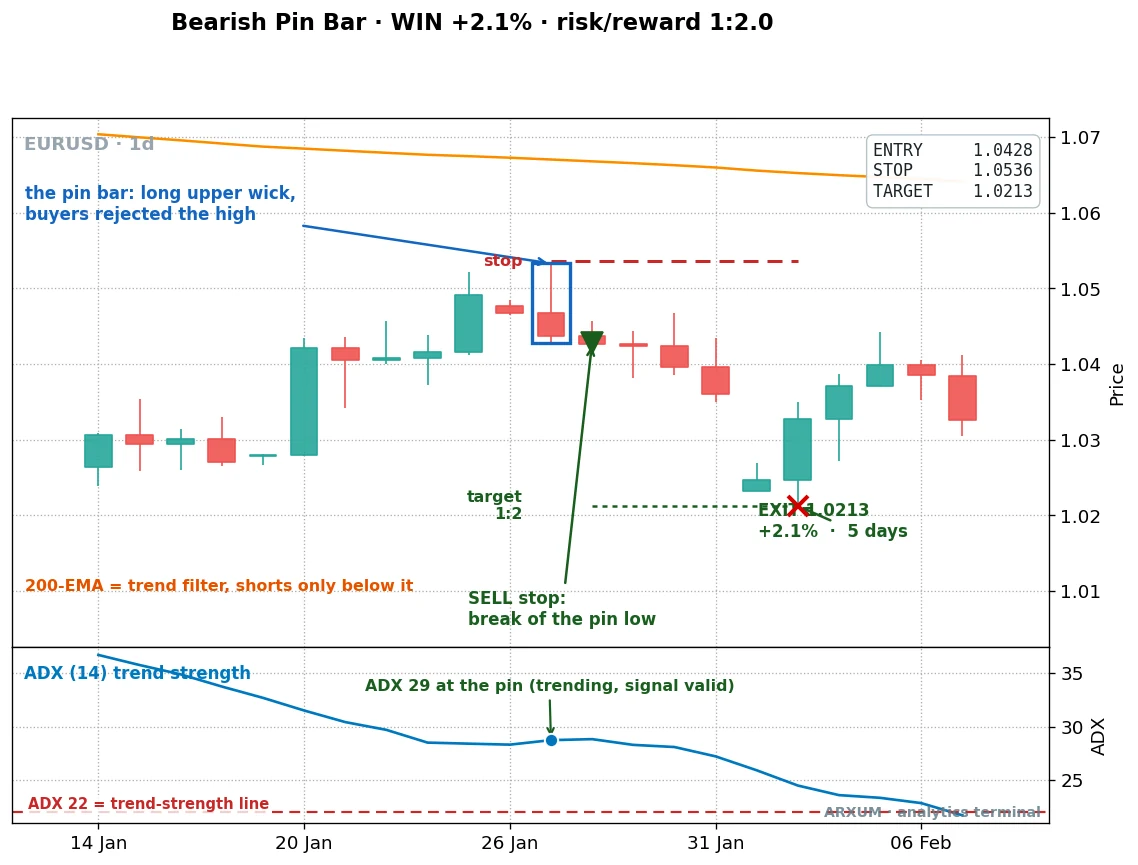
Exactly the same rule, flipped for the short. Price was below a falling 200-EMA, the pin printed a long upper wick rejecting a minor high, ADX read 29, and the entry came on the break of the pin low, the target twice the risk below. With price under the 200-EMA only the bearish pin obeys the rule, so this is a with-trend short, never a counter-trend long. Treat the majors as your practice ground for the setup while you lean on gold and oil for the tested edge.
When the pin bar fails
The honest scope matters as much as the wins, so here is a loser, a textbook-clean one.
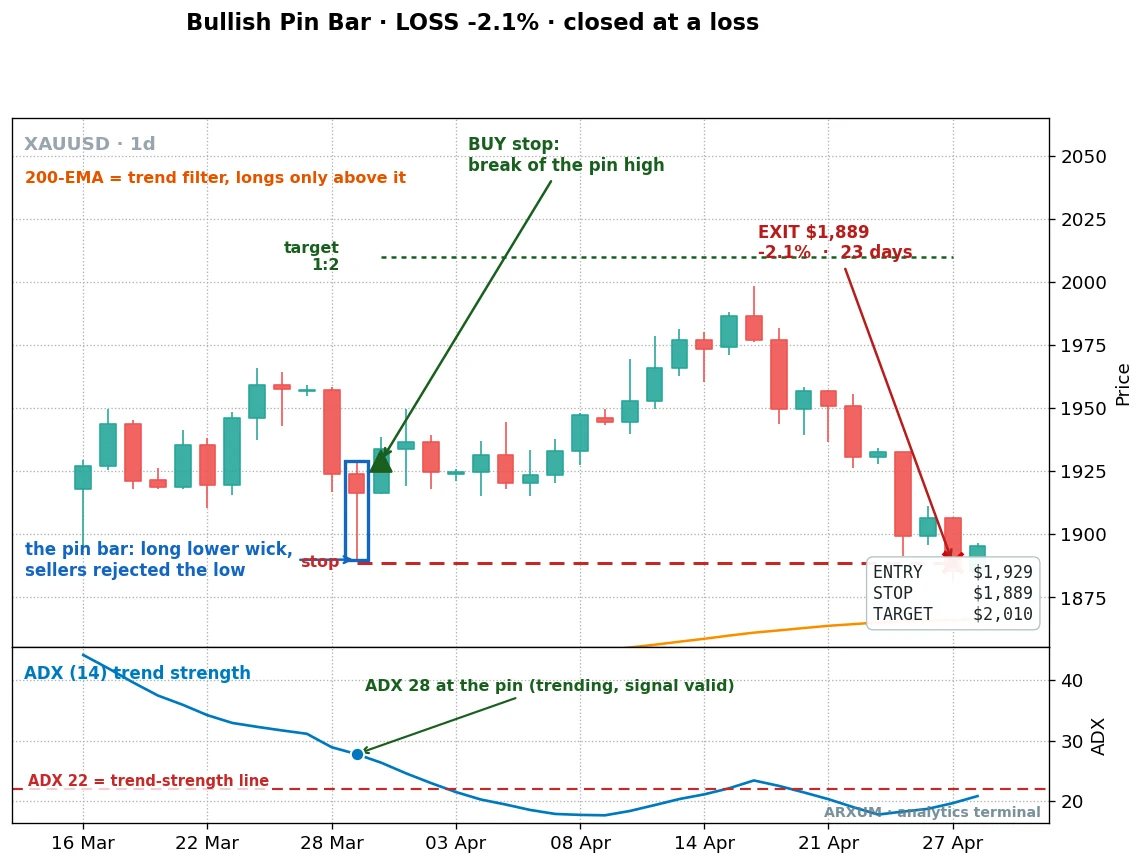
This pin was perfect on paper. Long lower wick, small body, ADX over the line, a clean break of the pin high. It even rallied toward the target.
Then the move ran out of fuel, price rolled back through the entry, and the stop did its job at $1,889 for a small loss. No drama, just a controlled exit.
That is the whole point of the stop below the wick. A clean shape is a good entry, never a promise. The losers are how a 44% win rate stays alive: small, capped, and frequent enough that you stop expecting every pin to pay.
Here is the full list of what the data rejected, so you do not waste time on it:
- The raw pin alone. A coin flip. The trend filter is the edge, not the candle.
- Counter-trend pins. Fading the trend with a pin was the worst result we got. On gold, every one of the four counter-trend attempts lost, so the profit factor rounded to nil. Do not pick tops and bottoms with this.
- Pins in a dead market. When ADX was below the line, the pin lost. No trend, no edge.
- The longer-wick myth. Demanding a wick three or more times the body made gold worse, not better.
- RSI timing. Only taking pins when RSI was stretched also hurt. The trend filter beats the oscillator here.
A word on Bitcoin
Remember that 2.16 profit factor from the raw test? Here is the trap. Bitcoin returned almost 600% over the test window. In a market that goes up that hard, almost any long-biased signal looks like a genius, because the market did the work, not the pin.
That is why we filter out beta. A long edge is only real if it beats buy-and-hold, or at least earns its keep on a risk-adjusted basis. The Bitcoin pin number is the rising tide, not the boat. Treat any spectacular long backtest on a one-way bull market with suspicion, and check it against simply holding the asset.
Position sizing, in plain dollars
Knowing the setup is half of it. Sizing it so one bad run does not wreck you is the other half. The rule is simple: risk a fixed slice of the account on each trade, and let the distance to your stop decide how big the position is.
Use 2% per trade. On a $1,000 account that is $20 of risk. You trade these markets in lots, not loose ounces or barrels, so a quick primer on lot sizes first.
A standard lot is the full contract, a mini lot is a tenth of it, and a micro lot is a hundredth, the smallest most brokers let you click. On gold a micro lot is one ounce; on oil a micro lot is one barrel; on a Forex major like EUR/USD a micro lot is 1,000 units, where one pip (a 0.0001 move) is worth about ten cents. These are all normal, widely offered account types, so a micro or cent-lot account is easy to open.
Now walk the gold pin from the chart above, in lots:
- Account $1,000, risk budget at 2% is $20.
- Entry $2,577, stop $2,535. Risk per ounce: $2,577 − $2,535 = $42.
- Size: $20 ÷ $42 = 0.48 ounces, which is below even one micro lot.
That is the honest snag with gold on a small account. At honest 2% risk, the position lands below the smallest lot a normal broker offers, because gold is expensive and its stops are wide in dollars. You would need a fractional or cent-lot account, where lots are sliced even finer, or a larger balance.
So here is the trade a $1,000 account can actually place: the oil short from earlier. Oil is a fraction of gold’s price, so the same $20 risk reaches a real position.
- Account $1,000, risk budget at 2% is $20.
- Entry $61.2, stop $62.6. Risk per barrel: $62.6 − $61.2 = $1.40 (140 points on oil).
- Size: $20 ÷ $1.40 = 14 barrels.
- On oil, one micro lot is one barrel, so 14 barrels is 0.14 of a standard lot, or 14 micro lots. That fills on any micro-lot account.
- Target $58.4, twice the risk below entry. If it hits, the 14 barrels make about 14 × $2.80 = $39, a clean 1:2.
And if you would rather practice on Forex, the cheapest home for a small account, here is the EUR/USD short from earlier, sized the same way:
- Account $1,000, risk budget at 2% is $20.
- Entry 1.0428, stop 1.0536. Risk: 1.0536 − 1.0428 = 0.0108, which is 108 pips.
- At about $0.10 per pip on a micro lot, one micro lot risks 108 × $0.10 = $10.80.
- Size: $20 ÷ $10.80 = about 2 micro lots. That fills easily, with low spreads.
Do not solve a too-small gold size by widening the stop or oversizing. The size bends to the risk, never the other way. The real fix is to pick a market your account can afford, which is why a small account is better off on oil or a Forex major than on gold.
How to place the trade
Once you have a valid pin and a size, the order is three fields on the ticket. For the bullish pin:
- Buy-stop at the pin’s high, so you only get filled if price confirms the rejection by breaking out.
- Stop-loss just below the wick low.
- Take-profit at twice the risk above your entry.
Set all three at once and leave it. For a bearish pin, flip it: a sell-stop at the pin low, the stop above the wick, the target twice the risk below. Most charting tools, including the free tier of TradingView, let you drag these three levels onto the chart and read the reward-to-risk before you commit.
The discipline that keeps you in the game
A 44% win rate means more than half your pin trades lose. That is the shape of the edge, not a flaw, so expect losing streaks: three or four stops in a row is ordinary variance, not a broken system. The trap is reacting to them by widening the next stop, doubling size, or grabbing the first pin you see to win it back. Follow the plan, take the next valid signal at the same 2% risk, and let the sample play out.
There is one real line worth watching. The pin bar lives and dies on the trend behind it, so if you suddenly get far more signals than usual, or hit six losses in a row, that is the tell that the market may have stopped trending and slipped into a range, the condition that flips this edge off. Step back and check the regime before the next trade. One bad week is noise; a sustained run of failures in a market that has gone sideways is the signal to wait, and to only ever risk money you can afford to lose.
The bottom line
Here is the whole thing on a matchbox:
- Take the pin in the direction of a trending market. Bullish pin above the 200-EMA, bearish pin below it, ADX above 22.
- Enter on the break of the body end, stop beyond the wick, target twice the risk.
- Pick the market for the side you want. Long pins on a trending asset like gold. Short pins on a two-way market like oil. Never short a one-way bull run.
- Risk 2% per trade, take every valid signal, and respect the losing streaks.
The pin bar candlestick is not magic. The raw signal is a coin flip, and the popular filters make it worse. The edge is the trend behind the candle: a pin is a pullback that got rejected, and it pays when the market was already moving and resumes. Match it to the right market, in the right direction, and a coin flip becomes a slow, honest edge.
Where to go from here
If you want to use this yourself, the natural next steps are the tools and markets the method leans on. Support and resistance is how you spot the levels a pin tends to form at. The average true range guide helps you judge whether a market is calm or volatile, which feeds the same trend-strength read the ADX filter uses.
For the cousin candles that work the same way, the hammer candlestick and the shooting star candlestick are close relatives of the bullish and bearish pin. And to make sure your 1:2 targets are doing the work, the risk-reward ratio guide explains the math the whole strategy rests on.
FAQ
What is a pin bar, in plain terms?
Does the pin bar pattern actually work?
What is the difference between a bullish and a bearish pin bar?
What confirmation should I add to a pin bar?
Is a pin bar a reversal or a continuation signal?
What is the win rate of the pin bar strategy?
Which markets and timeframes work best for pin bars?
Why does the bearish pin work on oil but not on gold or Bitcoin?
Does a longer wick make a better pin bar?
How do I place a pin bar trade?
How much money do I need to start?
How many losses in a row should I expect?
What do the key terms mean?
🌍 Our recommended brokers

Momentum Trader & Technical Analyst
Trades momentum across crypto and forex since 2019, built around RSI, MACD, and volume. Turns discretionary setups into rule-based, systematic entries and validates them on data before they go live.