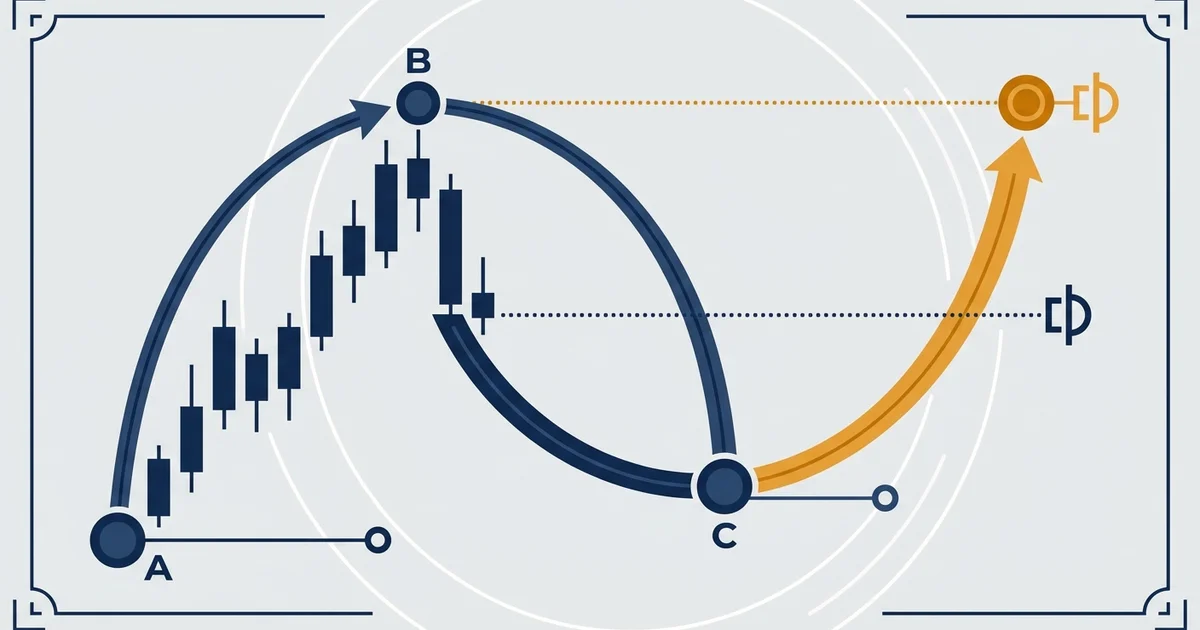

The Fibonacci extension, by the textbook
Here is the thing you came to see. This is a Fibonacci extension drawn the way every charting tool draws it, on real gold data.
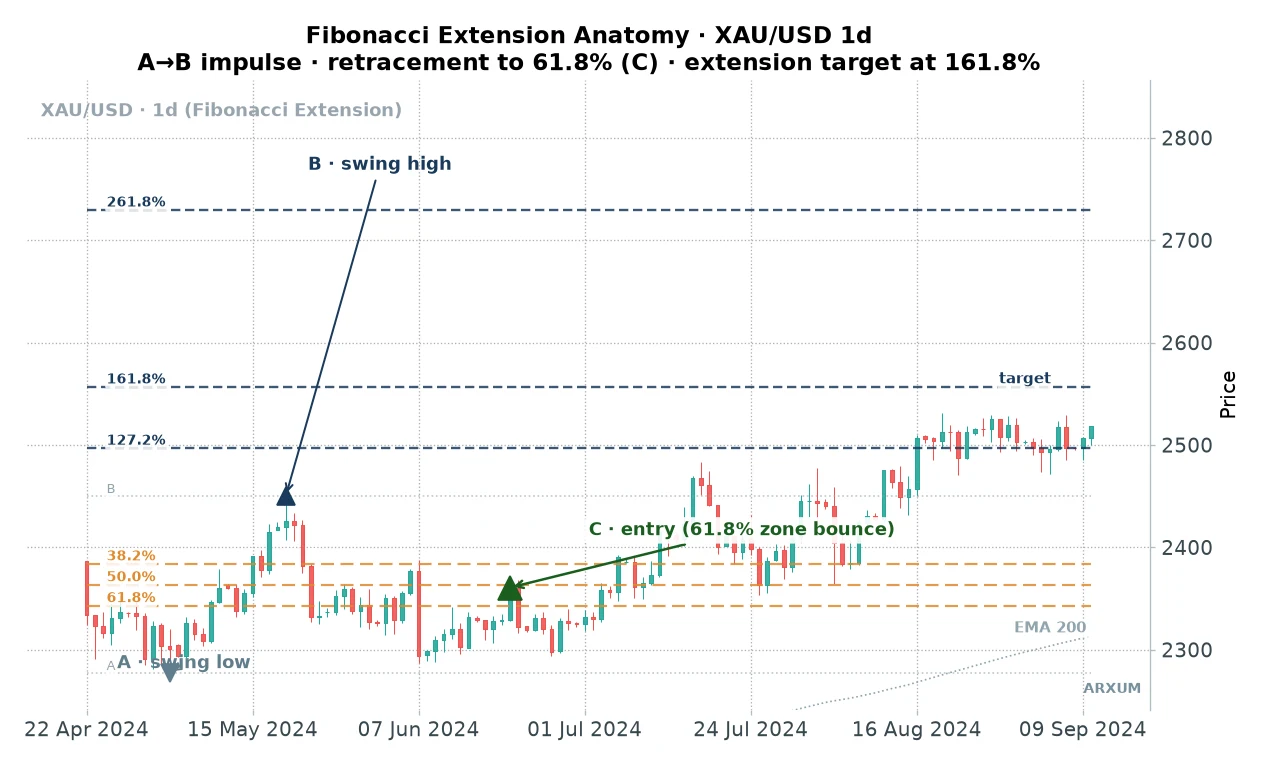
Three points build it. A is a swing low, B is the swing high that follows, and the move from A to B is your measuring stick.
The tool then multiplies that distance and projects it above B.
The orange lines below B are the retracement, the pullback zone where you look to enter: 38.2%, 50% and 61.8%. The navy lines above B are the extension targets.
The standard set runs 127.2%, 161.8%, 200% and 261.8%; the chart draws the three most watched, 127.2%, 161.8% and 261.8%.
Two of those numbers do the heavy lifting. The 61.8% level is the golden ratio, the deep pullback where strong trends often find their footing.
The 161.8% level is the golden ratio pointed forward, the target most traders watch for the next leg.
The core idea: a retracement tells you where to get in on a dip, an extension tells you where that move might reach if the trend resumes. Same math, opposite direction.
How to draw a Fibonacci extension
The click order matters, so keep it simple:
- Find the impulse. A clear swing low (A) followed by a clear swing high (B), in an uptrend. On a downtrend you flip it, high to low.
- Anchor the tool from A to B. That sets your 100% distance and prints both the retracement and the extension grid.
- Wait for the pullback to C. Price drifts back toward the 61.8% line inside the A-to-B range. That is your entry zone.
- Read the target off the grid. The 161.8% line sitting above B is where you plan to take profit.
That is the whole tool. The interesting part is not the drawing.
It is whether price actually reaches those projected lines, and that is a data question, not an opinion.
The setup we run, and the indicators it needs
We did not test “does gold respect Fibonacci.” That question is too vague to answer. We built one specific, mechanical setup and ran it, so every rule is fixed and nothing is left to the eye.
The tables below rate each version by profit factor (PF), so it helps to know that number first. Profit factor is the whole strategy’s dollars won divided by dollars lost.
Above 1.0 you made money, and 2.85 means about $2.85 came back for every dollar the losers cost. It answers “which version makes money,” and it is not the same as reward-to-risk, which is per trade.
Here are the rules, on the gold daily chart (XAU/USD, one bar per day):
- Regime filter first. Only take longs when price is above its 200-period exponential moving average. The EMA200 is a slow moving average that smooths price into one trend line; above it, the trend is up, and we only trade with it.
- The impulse. A swing low (A) then a swing high (B), where the A-to-B move is at least 1.5 times the average true range. That average true range, or ATR, is just the size of a typical daily bar, so this rule demands a genuinely large swing, not a wiggle.
- The entry (C). Price pulls back and closes back up through the 61.8% retracement of A-to-B. That deep dip, then a close back in the trend’s direction, is the trigger.
- The stop. Just below the swing low at A. If price closes under A, the whole setup is void, so that is your line in the sand.
- The target. The 161.8% extension, measured up from A. Reward-to-risk on that target runs about 1:2 to 1:2.6. The plan risks one to make two or more.
- The time-out. If neither the stop nor the target hits within 60 trading days, close the trade where it sits.
One number decides more than any other: how significant a swing has to be before it counts. We swept that, and the answer reshaped the whole strategy.
The finding: bigger swings, deeper pullbacks
The pullback level and the swing size are the two dials. We ran every combination on gold’s eight years.
The pattern is clean and one-directional.
| Small swings, 50% entry | PF 1.01 |
| Small swings, 61.8% entry | PF 1.19 |
| Large swings, 50% entry | PF 1.92 |
| Large swings, 61.8% entry | PF 2.85 |
Read the table top to bottom and two things jump out.
- The 61.8% entry beats the 50% entry every time. The deeper pullback filters out shallow dips that were never real tests of the trend. When price gives back nearly two-thirds of the move and still holds, the buyers who step in mean it.
- Bigger swings beat smaller ones. Demanding a large A-to-B impulse throws away minor squiggles and keeps only significant structure. Fewer signals, cleaner ones.
What counts as a “large swing” has a precise definition. Each turning point has to be a 20-bar pivot: the swing high is the highest price for 20 bars on either side of it, and the swing low the lowest for 20 bars on either side.
That is the “20-bar pivot” label you will see on the equity chart below, and it is what filters the noise out.
The takeaway: the strongest version is the fussiest one. Deep 61.8% pullbacks on large, confirmed swings only.
That combination is what every number below is built on.
What it actually did, over eight years
Selective is an understatement. This setup took ten trades in eight years, a little over one a year.
That is the honest price of only taking the cleanest swings.
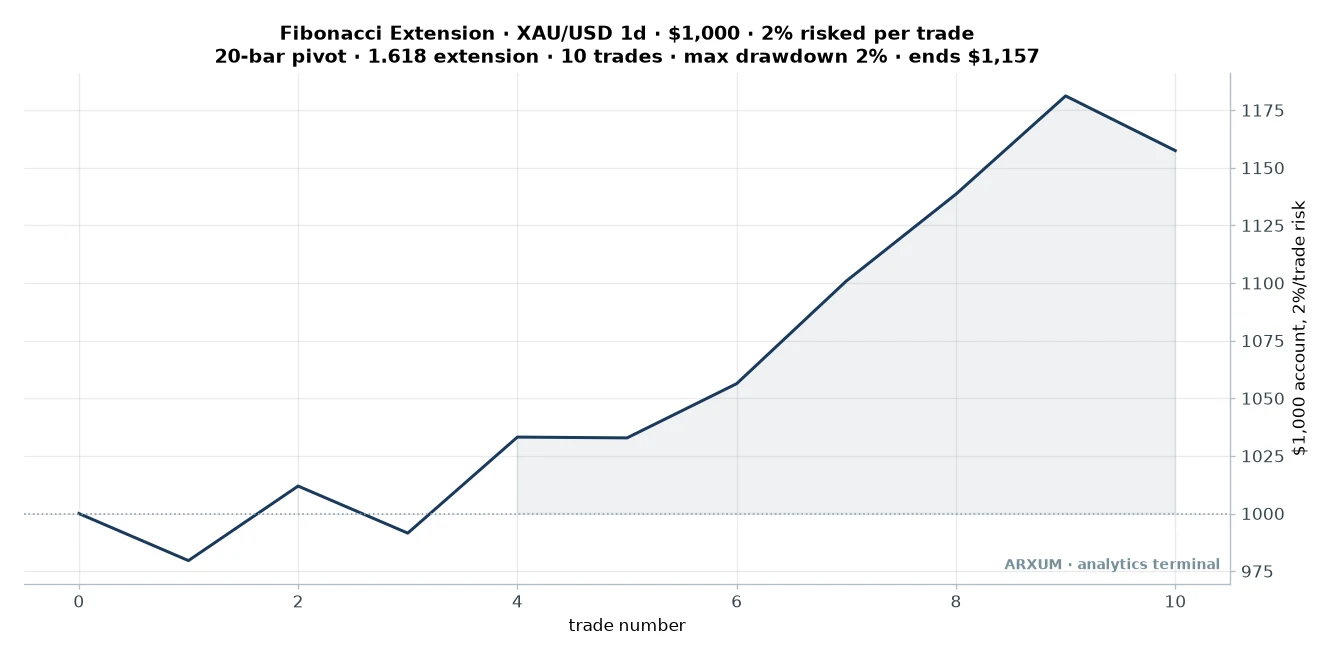
Read the curve honestly. It moves in steps, flat for long stretches, then a jump when a setup finally appears and works.
That staircase is what a low-frequency, high-conviction edge looks like on a chart.
The curve above is the risk frame our reader trades: a $1,000 account, 2% of it risked on each trade, position sized to the stop, fees taken out. A stop-out costs 2% of the account.
A full target, which sits at 1:2 to 1:2.6 depending on how deep the pullback ran, pays a little over double that.
The 2% maximum drawdown in the caption is just that: drawdown is the worst dip the account ever took from a high point. Here it never lost more than 2 cents on the dollar before recovering.
| Trades | 10 |
| Win rate | 60% |
| Reward-to-risk | 1:1.9 avg |
| Profit factor | 2.85 |
| Max drawdown | −2% |
| Avg hold | about 8 weeks |
| Net return on $1,000 | +16% |
Sixteen percent over eight years sounds thin, and on raw return it is. Gold itself rose about 227% across the same stretch, so buying and holding the metal beat this setup on the scoreboard by a mile.
That comparison misses the point, and here is why. Buy-and-hold rode a 27% drawdown to get its number, while this setup’s deepest dip was 2%.
One is a bet on gold going up forever. The other is a selective, risk-controlled way to press a specific, repeatable pattern.
They are not the same product, so do not judge them on the same ruler.
Two trades that paid
The setup wins by catching the resumption of a strong uptrend at a deep discount. Here is what that looks like in practice.
First, a gold long from about a year back. Price had run up, pulled all the way to the 61.8% line, then closed back up through it while holding above the EMA200.
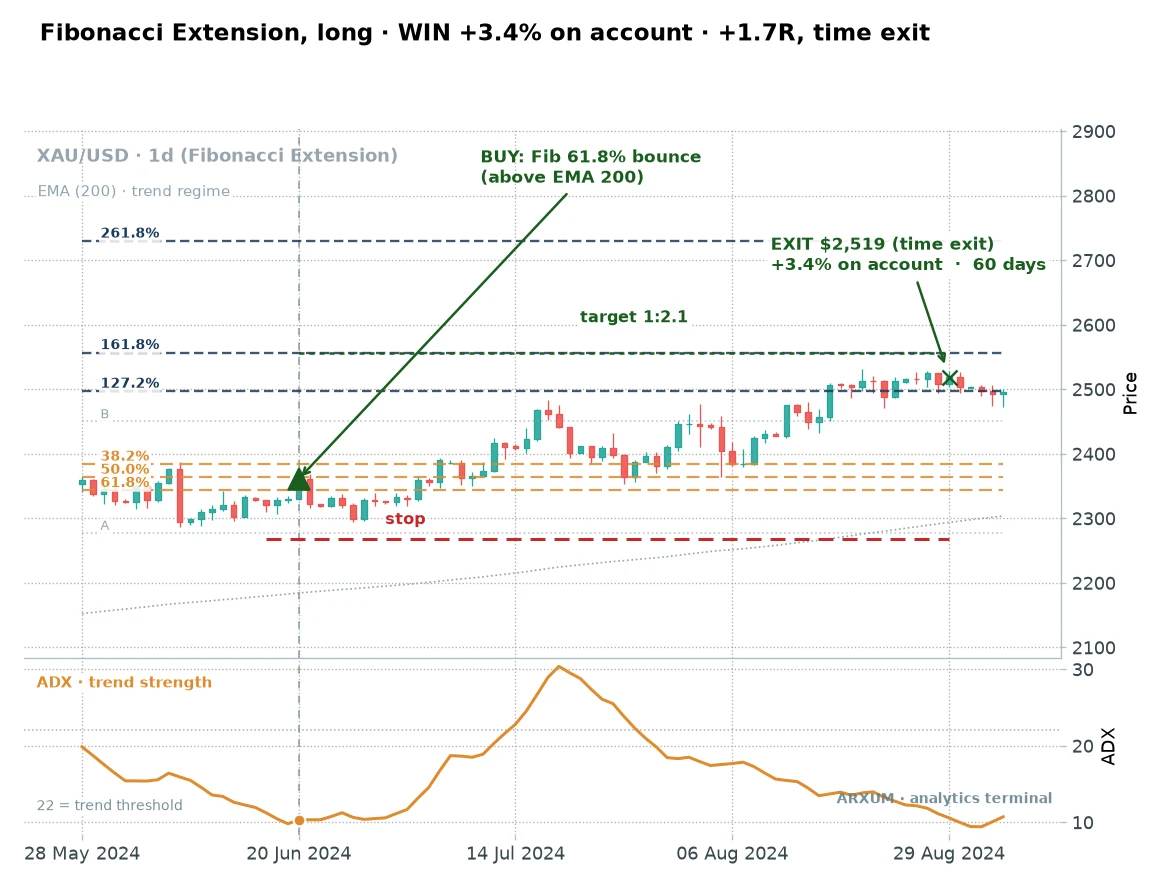
Entry sat right on the 61.8% zone, marked by the green arrow, and the ADX panel below read low. ADX is a trend-strength gauge; the 22 line on the panel is our threshold, and readings under it mean a calm, quiet market. This entry fired in exactly that calm, which is the friendliest condition for the setup.
Price then climbed steadily toward the 161.8% target. It did not quite get there.
The 60-day clock ran out first, and the trade closed near $2,519 for a solid gain, about +3.4% on the account. On the chart that same result also carries the tag “+1.7R,” trader shorthand meaning the gain was about 1.7 times the 2% the trade risked.
That is the pattern to expect: a time exit in profit, not a clean tap of the target.
The second winner tells the same story on a different stretch of chart.
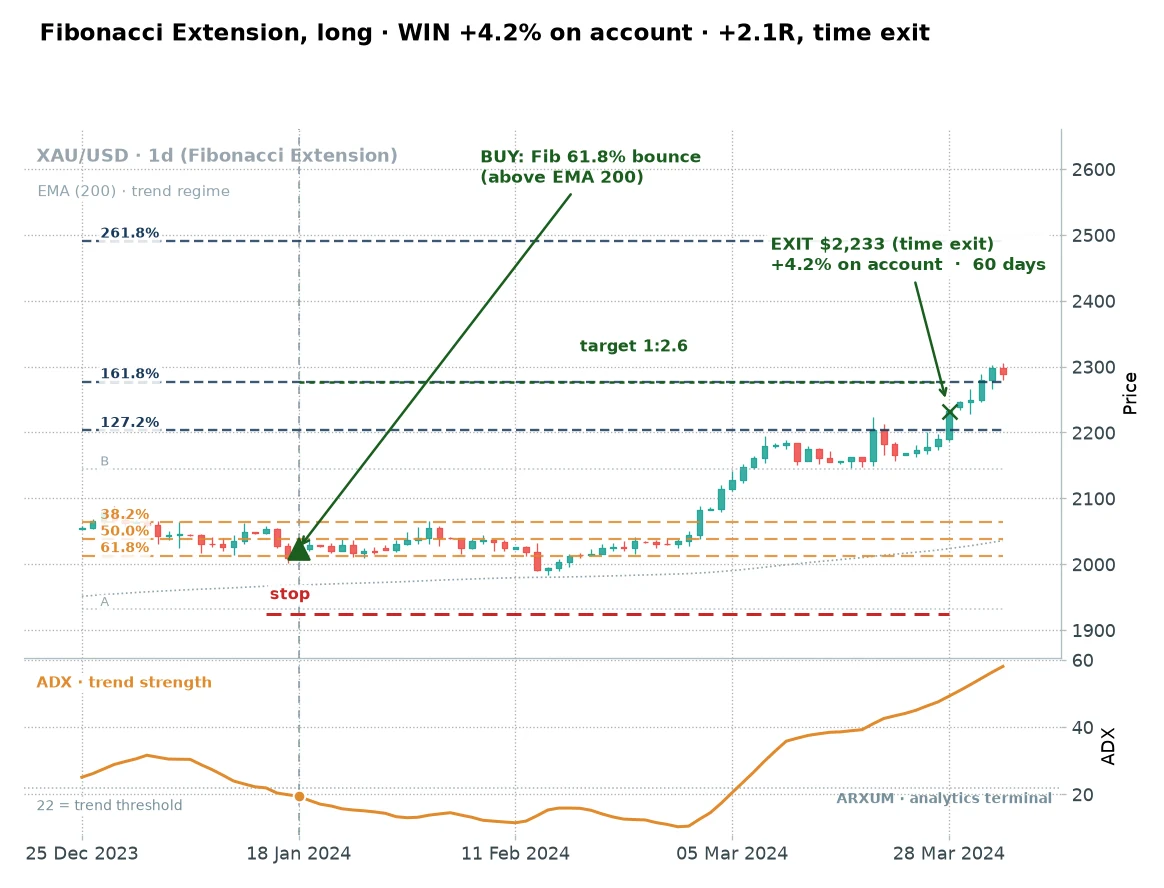
Same trigger, same deep pullback, same result shape. Price entered near $2,023, ground higher for two months, and exited near $2,233 on the time-out.
Its 161.8% target sat at about 1:2.6 reward-to-risk, so the +4.2% on the account, tagged “+2.1R” on the chart because it made about 2.1 times the 2% the trade risked, was still short of a full hit but well into profit.
The honest lesson in both: the 161.8% target is a direction, not a promise. The setup makes its money by getting long a strong trend cheap, then riding it.
Whether price stamps the exact extension line is almost beside the point.
Managing the exit: target, trail, or the clock
Both winners timed out short of the 161.8% line, which raises a fair question. If price rarely taps the full target, how should you actually exit?
You have three honest options, and none of them is wrong:
- Take the target. Set the take-profit on the 161.8% line and let it fill. Simplest, but you leave trades open that stall just short and hand profit back.
- Trail the stop. Once price clears the 127.2% level, ratchet your stop up under each higher swing low. You bank a stalled trend instead of waiting on a level that may not come.
- Use the clock. Close at a fixed limit, 60 trading days in our test, wherever price sits. That is what produced the two winners above.
The trail and the clock both beat stubbornly holding for a target that, on this setup, price reached less than half the time. Pick one before you enter, not while the trade is open.
Where it breaks
A setup you only trust when it wins is useless. Here is a loss, and it teaches more than either winner.
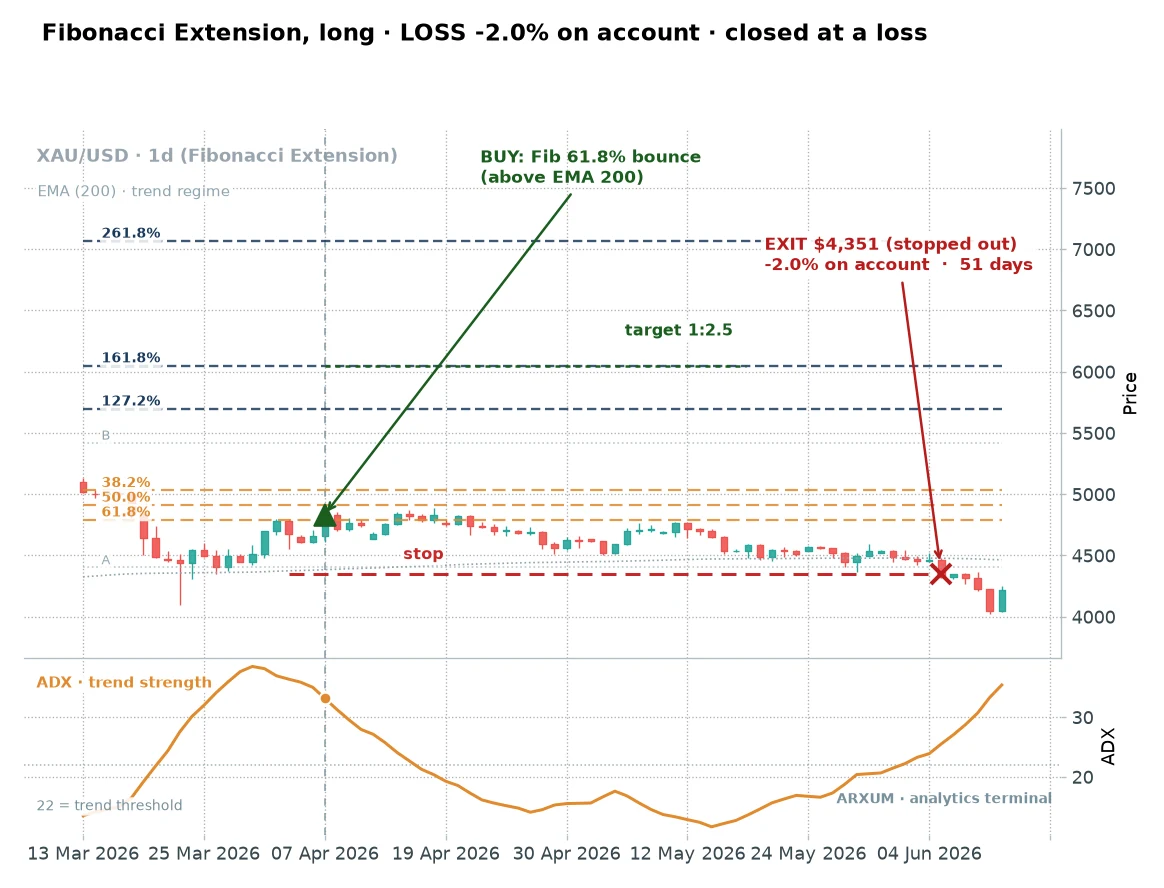
This one fired in a very different mood. By this stretch gold traded up near $4,800, far above the earlier examples, which is why the price scale looks so different.
Look at the ADX panel: at entry it read above 30, well over the 22 threshold. That reading flags a strong, already-extended trend.
That is the trap. When the move is already stretched and racing, a fresh 161.8% projection sits a long way off, and price runs out of fuel before it gets there.
Here it stalled, drifted, then closed below the swing low at A, which voids the thesis, and the stop did its job at a clean 2% account loss.
The data backs the eye. When we split trades by trend strength, the ones that fired in the strongest trends (ADX above 28) dropped to a 33% win rate.
The counter-intuitive rule: this setup wants a healthy uptrend that is pausing, not one that is sprinting.
A calm pullback is the green light. A vertical, overheated market is the yellow.
The filter that sharpens the entry
The regime and swing-size rules already do a lot. Two more conditions, drawn from the same eight years, separate the best entries from the merely acceptable.
- RSI below 50 at entry. The relative strength index, or RSI, is a 0-to-100 momentum gauge, and 50 is its midline. When price has pulled back deep enough to drag RSI under 50, the dip has real fatigue in it. Those entries ran a far higher profit factor than entries where RSI stayed above 50, roughly 5.9 against 1.6. The split is five trades on each side, so read that gap as a strong lean, not proof from a big sample.
- A calm pullback. When the daily bars at entry are smaller than usual, the retracement is orderly, and the setup resolves cleanest. Volatile, wide-range pullbacks are often a reversal starting, not a pause.
Notice what is not on the list. Volume added nothing here.
The high-volume filter left only two trades over eight years, too few to mean anything, so we skip it. This is the point of testing filters one by one: you keep what the data rewards and drop what it does not, instead of bolting on the same volume-and-RSI trio every guide repeats.
You can read both live conditions off the chart without any math. Calm means the candles are shrinking and the range is tightening.
Fatigue means RSI has slipped under its midline on the pullback. Wait for both and you are taking the strongest version of an already-selective setup.
Which market, which timeframe, and the honest limits
This is a gold, daily-chart, long-only tool, and it is worth being blunt about why.
- Long-only, on gold. Over the eight years, gold trended up so persistently that the EMA200 regime filter almost never cleared a short. The setup found only two valid short signals in the whole period, too few to trade. On gold, this is a long instrument, full stop.
- The daily timeframe. The 60-day holds and the once-a-year cadence are built for a daily chart and a patient trader. This is not a day-trading tool, and forcing it onto a fast chart would just manufacture noise.
- Out-of-sample, it held. We split the eight years into the first half and the second half the setup had never been tuned on. Both halves stayed profitable, the win rate actually rose in the newer half, which is the sign of an edge that is real rather than curve-fit to old data.
- Mind the sample size. Ten trades is thin. One outsized winner still carries real weight in a number like the 2.85 profit factor, so treat these figures as directional evidence of an edge, not precise readings you can bank on.
The framing that matters: treat this as a “when to wait” strategy, not a “trade every day” one. Its whole value is patience.
It sits on its hands until gold gives it a deep, calm pullback in a healthy uptrend, then it presses hard.
How to trade it, step by step
If you want to use this in your own trading, here is the full sequence. Nothing here is a call to trade, just the mechanics if you choose to.
- Load the tools. On TradingView, add “Moving Average Exponential” set to length 200, “Average Directional Index (ADX)” at length 14, and “RSI” at length 14. For the levels, use the “Trend-Based Fib Extension” tool, which takes three clicks (A, then B, then C), not the plain two-click “Fib Retracement.” On MT4 or MT5 the drawing tool lives under Insert, then Objects, then Fibonacci, then Fibonacci Expansion.
- Confirm the regime. Price must be above the 200 EMA. If it is not, there is no long here, so move on.
- Draw the extension from the swing low (A) to the swing high (B). Check the A-to-B move is a genuinely large swing, not a minor bump.
- Wait for the 61.8% pullback. Look for RSI under 50 and daily bars that are shrinking. If price is sprinting with ADX above 28, pass.
- Place the order. Use a buy-limit, an order that fills automatically when price dips into your zone, set at the 61.8% level. Put the stop-loss field just below the swing low at A, and the take-profit field on the 161.8% extension line. Set a mental 60-day time limit to close if neither level hits.
The three orders sit exactly where the anatomy chart at the top of this guide showed them: the buy-limit on the 61.8% line at C, the stop-loss just under the swing low at A, and the take-profit on the 161.8% extension line above B.
On sizing, keep it simple and fixed. Risk 2% of your account on the trade, and size the position so the entry-to-stop distance equals that 2%.
Gold is an expensive instrument, so on a small account that can mean fractional or micro lots, and some brokers do not offer them, so check before you plan the trade.
Here is that worked out in real money, using the losing trade above. Entry was near $4,832 and the stop near $4,351, so the entry-to-stop distance is about $481 per ounce.
On a $1,000 account, 2% is $20 of risk. Divide the $20 you can lose by the $481 the price can move against you and you get roughly 0.04 ounces of gold.
That is your position size, a small fraction of a full lot, which is exactly why gold on a small account needs a broker that offers fractional or micro lots.
At about 0.04 ounces you are controlling only around $200 of gold with a $1,000 account, so you are not even using leverage here. That is the point to hold onto: leverage is spare margin headroom, not extra risk.
Your loss stays capped at the $20 you sized to, whatever leverage the broker advertises.
Because this setup trades so rarely, the discipline it needs is not the usual “cut your losers.” It is patience and restraint.
The real risk with a once-a-year setup is boredom, talking yourself into a shallow pullback or a sprinting market just to have a position on.
If you ever string together three to six losses in a row, stop and check whether gold’s trend has actually broken, because the regime may have changed. Trade only money you can afford to lose, and let the setup come to you.
Where to go from here
The natural companion to this is the entry side of the same math. Our guide to Fibonacci retracement levels covers the 38.2%, 50% and 61.8% pullback zones in depth, which is exactly where this setup finds its entries.
And if the reward-to-risk language here felt fuzzy, the risk-reward ratio explainer walks through what 1:2 actually means for a single trade. It also covers why that is a different number from profit factor.
FAQ
What is a Fibonacci extension, in plain terms?
What is the difference between a Fibonacci extension and a retracement?
How do you draw a Fibonacci extension?
Do prices actually reach the Fibonacci extension targets?
Which are the most important Fibonacci extension levels?
Does the Fibonacci extension strategy actually work?
What timeframe is best for Fibonacci extensions?
Which markets does this setup work on?
What filters improve the Fibonacci extension entry?
How much money do I need to trade this?
What are the key terms in this guide?
Real-time trade setups with entry, stop loss and take profit. Daily market analysis. No subscription, no complicated theory.
🌍 Our recommended brokers


Reader Reviews
Be the first to review this — tell other traders what actually helped, or where it fell short.
Leave a Review

Quant Researcher & Systems Builder
Quantitative researcher who builds the automated systems behind Arxum strategy testing. Works in Python and Pine Script, using AI alongside classic backtesting to validate strategies on years of real data.
