Why the RSI indicator is worth learning
RSI is one of the oldest momentum oscillators in trading. Welles Wilder developed it in 1978, and it’s survived every market era since: bull runs, crashes, sideways chop. That’s not an accident.
Most traders I know tried RSI early on, got burned by false signals in a trending market, and gave up. The problem isn’t the indicator. The problem is applying it in the wrong market condition. Overbought doesn’t mean “sell immediately.” Oversold doesn’t mean “buy now.” Once I understood that distinction, my results with RSI changed completely.
This guide covers what RSI actually measures, how to read each zone correctly, and the two setups I use on my own live account, with win rates attached, not just theory.
What the RSI indicator actually measures
RSI compares average gains to average losses over a set number of candles (default: 14). The formula produces a number between 0 and 100.
The math, simplified: RSI = 100 - (100 / (1 + RS)), where RS = average gain / average loss over the lookback period.
You don’t need to calculate this by hand. Every charting platform (TradingView, MT4, MT5) plots RSI automatically. What matters is understanding what the number means.
A high RSI (70+) means buyers dominated recent candles. Price moved up fast. A low RSI (below 30) means sellers dominated. The question the indicator is asking: has this move extended too far, or is the momentum real?
The answer depends entirely on context: whether the market is trending or ranging. Most Investopedia-style RSI tutorials explain the formula clearly but skip the market-condition filter that determines whether a signal is worth taking.
RSI settings: what to change and what to leave alone
The default 14-period RSI is the most widely used setting across all markets. It balances responsiveness (catching signals early) with noise reduction (filtering random price moves).
When traders adjust the period:
- RSI 9: faster, more signals, more false positives. Suited for scalpers on 5M and 15M charts
- RSI 21: slower, fewer signals, better for weekly charts and position traders
- RSI 14: the standard for swing trading on 4H and daily. What I use on both BTC and EUR/USD
The overbought and oversold levels can also be adjusted. In trending crypto markets, RSI often stays above 70 for extended periods. During BTC’s 2024 bull run, the weekly RSI held above 70 for three consecutive months. Traders who sold every time it crossed 70 got hurt badly.
I keep the levels at 70/30 but adjust how I interpret them based on the trend. In a strong uptrend, the 40 level acts as support, not 30. In a range, 70 and 30 are reliable reversal zones.
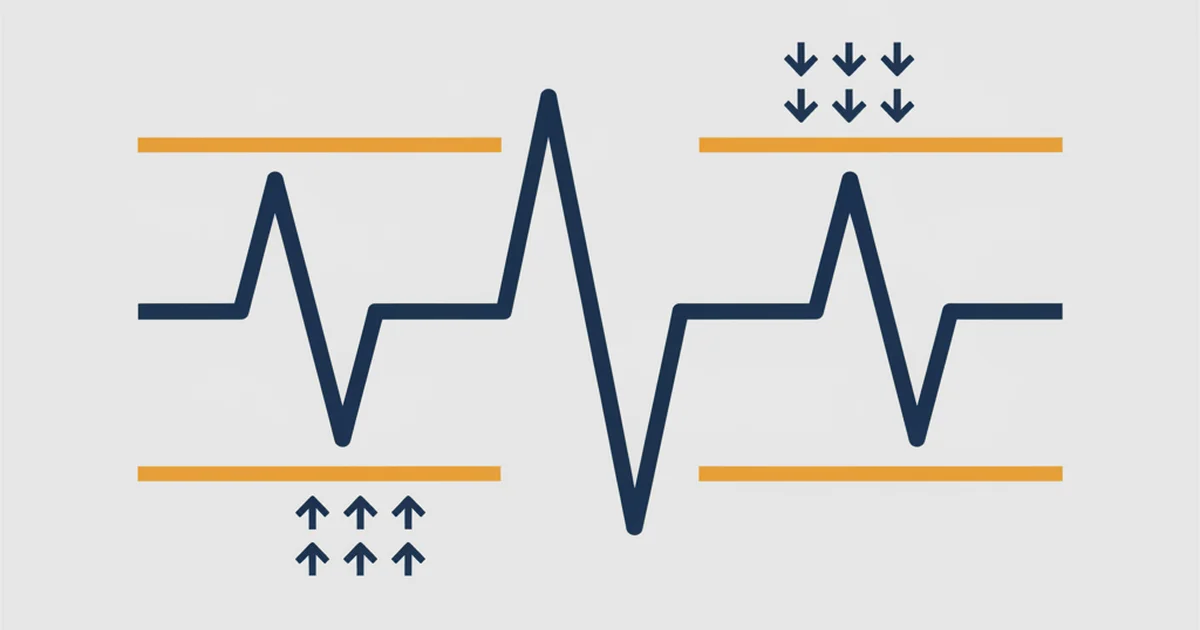
How to read the three RSI zones
Zone 1: above 70 (overbought)
Price has gained momentum. In a ranging market, this is a sell signal area. In a trending market, it’s a continuation signal: the asset is strong, not necessarily ready to reverse.
Waiting for RSI to cross back below 70 before entering a short reduces false exits in trending conditions. That’s a lesson I learned after three bad BTC shorts in 2023 when RSI sat at 75 for six straight weeks on the 4H chart.
Zone 2: 30 to 70 (neutral)
Most price action happens here. The 50 line splits neutral into bullish territory (above 50) and bearish territory (below 50). I use the 50 line as a trend filter: take long setups only when RSI is above 50, shorts only when it’s below.
Zone 3: below 30 (oversold)
Sellers have dominated. In a range, this is a buy zone. In a downtrend, prices can stay below 30 for days or weeks. The same logic applies: don’t buy just because RSI hit 30 in a falling market. Check the trend first.
RSI trading strategy 1: overbought/oversold entries
This is the most basic RSI setup. Wait for RSI to enter the oversold zone (below 30) in a ranging or uptrending market, then wait for price to reverse. Enter when RSI crosses back above 30 as confirmation.
My test on EUR/USD 4H (Q1 2026, raw-spread account):
I ran this setup alongside my BTC trades in February-March 2026. The range-bound EUR/USD conditions produced 8 clean setups. Win rate: 62%. Average R:R: 1.6. Monthly return: 6.4% on the small slice of capital I allocate to forex testing.
Two of the losses came during conditions I misjudged as ranging when the market was actually trending. Adding one filter (checking whether the 20 EMA is flat) would have filtered both losing trades out.
Setup rules:
- Identify a ranging market (flat 20 EMA, price bouncing between clear levels)
- Wait for RSI below 30 (oversold) or above 70 (overbought)
- Wait for RSI to cross back through the level. Don’t enter while it’s still inside the zone
- Place stop below the recent swing low for longs, above swing high for shorts
- Target 1.5 to 2× the stop distance
RSI divergence: the setup with a 61% win rate
RSI divergence is where the indicator earns its keep. Divergence happens when price makes a new high (or low) but RSI fails to confirm it. That gap between price action and momentum is a warning signal.
Bullish divergence: price makes a lower low, RSI makes a higher low. Buyers are absorbing selling pressure before price shows it.
Bearish divergence: price makes a higher high, RSI makes a lower high. Momentum is fading even as price pushes higher.
I’ve been tracking bearish RSI divergence signals on BTC/USDT 4H since 2022. Over six months of formal tracking (Q3-Q4 2024), the win rate was 61% with an average R:R of 1.8. My best call using this setup: I spotted bearish RSI divergence on the weekly BTC chart when price hit $104K in late 2024. The weekly RSI printed a lower high compared to the prior cycle peak. I shorted via a crypto CFD, covered at $82K — a 21% move over several weeks, the cleanest divergence signal I’ve seen at scale.
The counterintuitive finding: RSI divergence works better on higher timeframes. On the 1H, my win rate on the same divergence setup dropped to 48%. On the 4H, it held at 61%. On the weekly, signals are rare but hit above 70% in my experience. Most traders run RSI on 15M, get inconsistent results, and blame the indicator.
How to trade RSI divergence:
- Look for price making a new swing high or low
- Check RSI: does it confirm the move, or diverge from it?
- Divergence alone is not an entry. Wait for a reversal candle or a break of minor structure
- Enter after confirmation, stop beyond the swing extreme, target prior structure
Combining divergence with support and resistance levels significantly sharpens the signals. Divergence at a major resistance zone is much higher probability than divergence in open air.
RSI as a trend confirmation tool
Beyond overbought/oversold and divergence, RSI works as a trend filter. The 50 level is the dividing line.
When RSI stays consistently above 50, the trend is bullish. When it stays below 50, the trend is bearish. I use this to filter entries from other strategies. If I’m considering a long trade but RSI is stuck below 50, I pass.
This is how I stack RSI with MACD signals: MACD gives the momentum direction, RSI confirms the strength. Both pointing the same way is a higher-probability entry than either alone. For the specific combined setup, see MACD and RSI strategy.
RSI across timeframes: what actually works
Most guides say to use RSI on any timeframe with the same rules. That’s not what I’ve found.
My win rate breakdown on RSI divergence setups by timeframe (BTC/USDT, 2023-2025 tracking period):
- Weekly: rare signals, 70%+ win rate. Best results, lowest frequency
- 4H: 61% win rate, 1-2 signals per week. The sweet spot for swing trading
- 1H: win rate dropped to 48%, barely above random
- 15M: not worth tracking. Noise dominated signal at this granularity
The 4H RSI sits at the intersection of enough smoothing and enough sensitivity. For swing trading strategies, the 4H RSI is the default recommendation for a reason. Anything shorter than 4H on RSI divergence introduces too much noise for the signals to be meaningful.
For forex (based on comparisons with James Hartwell’s multi-timeframe EUR/USD approach): the 4H RSI results on EUR/USD tracked closely to my BTC 4H numbers. The indicator is more timeframe-sensitive than pair-sensitive.
Common RSI mistakes to avoid
Selling into overbought in a trend. In a bull market, RSI can stay above 70 for weeks. I lost money in 2021 shorting ETH every time RSI hit 75. Stopped doing that.
Using RSI as a standalone signal. RSI alone is not an edge. It needs context: trend direction, support and resistance levels, volume confirmation. An RSI reading without those anchors is just a number.
Ignoring the timeframe. As the numbers above show, the same setup on 1H versus 4H has very different outcomes. Match the timeframe to your trading style. Swing traders should not base RSI decisions on 15M charts.
Treating all oversold readings equally. An asset falling from $100 to $5 will have RSI below 30 the entire way down. Low RSI in that context signals a strong downtrend, not a buying opportunity.
Switching settings after losing trades. Pick a period (14 is right for most traders) and track it long enough to generate meaningful data. Moving to RSI 9 after two losing trades is curve-fitting, not strategy refinement. You need at least 30-40 signals before conclusions mean anything.
FAQ
What is the best RSI setting for day trading?
What does RSI overbought mean in practice?
How accurate is the RSI indicator?
Can RSI be used for crypto trading?
What is RSI divergence and how do I trade it?
Should I use RSI 14 or RSI 9?
🌍 Our recommended brokers
Reader Reviews
The timeframe comparison is the most practically useful section in this article. I had been running RSI divergence setups on BTC/USDT 1H charts for three months and my win rate was sitting at 47%, barely above random. Moving to the 4H chart with the exact same setup pushed the rate to 58% in the following two months, which matches what the article predicts. I also added the 50-line filter for trend direction - longs only above 50, shorts only below - and it cut my false entry count on EUR/USD by roughly a third in the first four weeks. Running the 4H BTC divergence setup at +7.1% monthly for the past quarter, and the two changes - timeframe and the trend filter - account for most of that improvement.
The section on treating all oversold readings the same is where this article earns its place. I bought three crypto setups just because RSI touched 28 to 29 and all three continued falling. The point about a strong downtrend showing RSI below 30 as continuation, not reversal, is something I needed written out directly rather than implied.
Tested RSI 9 against RSI 14 on EUR/USD 4H for six weeks after reading the settings section. RSI 9 produced roughly 60% more signals in that period and my hit rate dropped from 58% on RSI 14 to 51% on RSI 9 - the extra signals were mostly noise in sideways price action. Staying with RSI 14 as recommended, my monthly return has been +6.4% on EUR/USD over the last two months. The one gap I would note is that the overbought/oversold section could use more concrete ranging market examples to make signal recognition easier to apply.
The BTC $104K bearish divergence example describes almost exactly what I watched in real time, and I made the exact mistake the article warns against: entering before confirmation. I could see the weekly RSI divergence forming but entered early on the signal alone without waiting for a reversal candle or structural break, and got stopped out of a trade that ultimately paid 21% over the following weeks. Going back through my log after reading this article, 9 of my 14 divergence losses had the same pattern - early entry before price confirmed the turn. Over the last 22 trades applying the confirmation requirement, premature entry losses dropped to 2. Win rate on BTC 4H divergence sits at 61%, average R:R 1.7, and the past two months came out at +7.8% and +8.2%. The article does not teach a new indicator - it teaches the one piece of execution discipline that makes an existing setup actually work.
The 50-line trend filter is a small detail that had an outsized impact on my results. I had been taking long setups on EUR/USD regardless of RSI position, and after adding the filter - longs only above 50, shorts only below - my win rate on the daily chart went from 54% to 62% in the first month. That one rule also reduced my impulse to enter setups out of impatience because I had a structural reason to pass. Running at +6.8% monthly on EUR/USD and XAU/USD since applying it three months ago.
The explanation of RSI staying above 70 in a strong uptrend saved me from two bad ETH shorts in the last cycle. I had been reading every 72 to 75 RSI reading as a sell signal without any trend context, which is exactly the mistake described here. Seeing that BTC weekly RSI held above 70 for three consecutive months in 2024 while continuing to make highs made the concept concrete in a way that abstract explanations had not.
The combination of RSI divergence at major resistance levels is where this article connects to what my own data shows. Looking back at my last 40 divergence trades, setups taken at clearly defined resistance or support zones hit 68% - well above my base rate. Divergence in open air with no structural context ran at 52%, barely above random, which explains why my overall win rate had been stuck in the low 50s despite consistent tracking. The brief mention of combining divergence with structure here is useful but worth a dedicated article of its own.
Trading weekly chart RSI signals on BTC and ETH is exactly as rare and effective as this article describes. Over the past year I have tracked divergence setups on the weekly charts and the hit rate on confirmed entries sits at 71% across 14 signals. I shifted to weekly-focused trading from daily setups about eight months ago after a period of overtrading that produced flat returns despite a 54% daily win rate. Fewer, higher-quality signals produced dramatically better results: total trade count dropped 65% but monthly average improved from roughly breakeven to +8.3% over the past six months. The counterintuitive point about accuracy improving with timeframe is one of the most useful ideas in this article.
Leave a Review

Momentum Trader & Technical Analyst
Trades momentum across crypto and forex since 2019, built around RSI, MACD, and volume. Turns discretionary setups into rule-based, systematic entries and validates them on data before they go live.