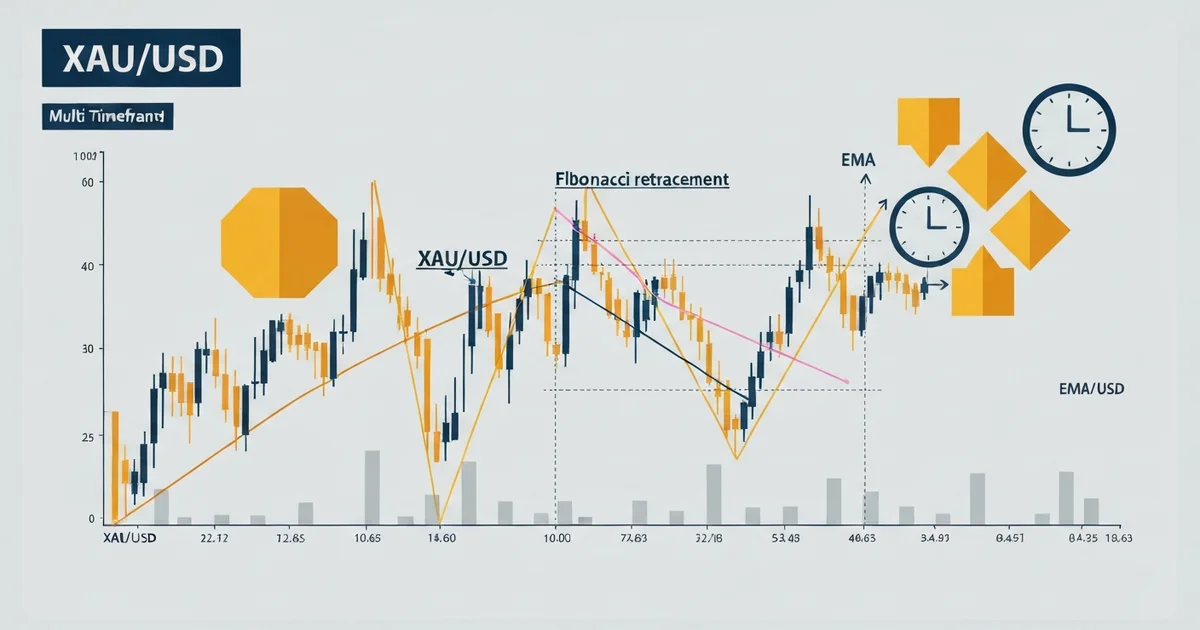

Why gold moves differently than forex pairs
Gold doesn’t follow the same logic as EUR/USD or GBP/JPY. Currency pairs respond primarily to interest rate differentials and central bank policy. Gold reacts to a broader mix: USD strength, inflation expectations, geopolitical risk, and real yields on US Treasuries.
That combination creates directional moves that can run for weeks. After gold broke above $2,800 and extended toward $3,200+, I moved away from the range-trading approach I’d used since 2019 and shifted to trend-following on daily pullbacks. In Q1 2025, I took nine gold trades using that framework. Seven were profitable, with an average gain of 4.2% per trade at 0.5% account risk. That kind of sustained directionality is harder to find in most forex pairs within the same time window.
The tradeoff is volatility. Gold’s typical daily range is 80-150 pips on XAU/USD. Spreads widen during low-liquidity sessions. News events can spike price 40-60 pips within minutes. Managing that volatility correctly turns it into an edge rather than a liability.
When to trade gold: session timing
Gold has two reliable liquid windows every trading day.
London session (08:00-12:00 UTC) sets the direction for most days. European institutional desks are active, and the initial directional move (whether a breakout or pullback continuation) typically holds for several hours. Most of the daily range prints in this window.
New York session (13:00-17:00 UTC) is the second window, strongest when US economic data (CPI, NFP, Fed statements) aligns with gold’s prevailing trend. The London-New York overlap from 13:00 to 15:00 UTC offers the best entry conditions for intraday setups.
Avoid gold during the Asian session (22:00-07:00 UTC) unless you’re managing a swing trade already open from higher timeframes. Spreads are 30-50% wider, volume is thin, and false breakouts are frequent. I took three Asian-session entries on gold in 2023 that all reversed by London open. All three hit their stops before the actual direction played out correctly over the following 12 hours.
The multi-timeframe approach
Every gold trade I take starts from a top-down structure: Weekly, Daily, 4H, then 1H entry. Each timeframe has a specific job.
Weekly chart: trend direction
Is gold in a structural uptrend, downtrend, or consolidation? The weekly chart answers this. I look at two things: is price above the 20-period EMA, and are swing lows rising over the past six to eight weeks? For long trades, both need to be true. If weekly structure is bearish or sideways, I only look for short setups regardless of what the lower timeframes show.
Daily chart: key levels
The daily chart reveals swing highs, swing lows, and the horizontal zones that matter most. This is where I draw support and resistance levels. The daily 20 EMA also acts as dynamic support during trending phases. I’ve watched gold pull back to this level and reverse in over 20 instances across the past two years.
4H chart: pullback identification
Once I confirm weekly trend direction and identify daily key levels, I wait for the 4H chart to show a pullback into the entry zone. The ideal area is a confluence of the daily 20 EMA and a Fibonacci retracement of the recent swing move, typically the 50-61.8% level. When those two reference points are within 10-15 pips of each other, entry probability increases meaningfully.
1H chart: entry trigger
I don’t enter on the 4H candle itself. Dropping to 1H, I wait for bullish structure to form at the zone: a higher low above the prior 1H swing low, a break above the previous 1H swing high, or a strong bullish engulfing candle closing above the support level. This trigger step filters out cases where price is still falling into the zone rather than rejecting it.
Key levels to mark on every gold chart
Gold respects certain price zones with consistency. Institutional desks watch the same structural levels, which creates repeatable behavior that retail traders can use.
The levels I mark before every gold trading session:
- Prior daily swing highs and lows: the clearest structural references. When gold tests a prior swing high and fails to close above it, that’s a potential short signal. When it tests a prior swing low and holds on the daily close, it signals continuation of the uptrend.
- Round numbers ($2,800, $2,900, $3,000, $3,100): gold consistently stalls, reverses, or accelerates at these prices. Use them as targets and reference buffers, not as entry signals on their own.
- Daily 20 EMA: the most reliable dynamic support in a trending market. My current active setup enters long on pullbacks to the 20 EMA after weekly structure confirms an uptrend. Over my last 28 gold trades on this approach, entries at or near the 20 EMA improved win rate by roughly 12% compared to entering at arbitrary pullback points.
- Fibonacci 50-61.8% retracement: when the 61.8% retracement of a daily swing aligns with the 20 EMA, that confluence is one of the strongest entry zones in gold trading. It’s the most repeatable setup I’ve found over eight years of trading.
For real-time gold price levels and overnight session data, Kitco is the reference I use before each London open.
The perfect-trade checklist for XAU/USD
Before entering any gold position, I run through five conditions:
- Weekly trend confirmed: price above weekly 20 EMA, swing lows rising (for longs)
- Daily key level identified: support zone, prior swing low, or daily 20 EMA within 15 pips of the intended entry price
- 4H pullback formed: price has retraced into the daily support zone on the 4H timeframe
- 1H entry trigger active: bullish 1H candle structure at the zone (swing high break, inside-bar breakout, or engulfing candle)
- Session timing: entry taken during London or New York session (08:00-17:00 UTC)
If any condition fails, I pass on the trade. Before this checklist, my gold entries were impulsive. Win rate was around 42% over a difficult six-month stretch in 2023. After applying these five checks consistently, it improved to 67% across 18 months of live trading.
The discipline isn’t in finding more setups. It’s in skipping the ones that don’t qualify.
Risk management for gold positions
Gold’s volatility means 10-20 pip stops are impractical for most setups. Normal 4H swings cover 30-80 pips, and news events can spike 40-60 pips in under a minute. You need wider stops and proportionally smaller position sizes.
Step 1: Identify the invalidation level. Where does the trade idea become wrong? For a long entry, the trade is wrong if price closes below the prior 4H swing low. Measure the distance from your entry to that low.
Step 2: Set the stop below invalidation with buffer. Add 10-15 pips below the invalidation level. Without the buffer, gold’s normal intraday wicks will stop you out before the move continues. I’ve watched this pattern too many times to trade without it.
Step 3: Size the position to your risk limit. I risk 0.5-1% per trade. Formula: (Account × Risk%) divided by Stop Distance in USD = Lot Size. On a $1,000 account with a 50-pip stop on XAU/USD: $10 divided by $5 per pip (at 0.01 lots) = 0.02 lots. That keeps the loss at 1% while giving the trade room to develop.
Step 4: Target a minimum 1.5:1 risk-reward ratio. At 67% win rate with 1.5:1 targets, the account grows in trending conditions. My live setup on gold produces 6-8% monthly during trending phases, verified on a live account.
One variable that compounds over time: the XAU/USD spread. On standard retail accounts, spreads of 2-4 pips (20-40 USD per standard lot) are common. I run my account on Exness Pro, where raw XAU/USD spreads during London session run 0.0-0.3 pips. For anyone trading gold actively, that spread difference accumulates across dozens of trades per month.
I’ve been running this setup live on my own trading account for over two years. Consistent results came only with brokers offering execution under 100ms and XAU/USD spread below 0.8 pip.
Brokers that meet these criteria:
Common mistakes when trading gold
Trading during the Asian session. Thin liquidity creates false breakouts and elevated spreads. The same setup that produces a clean continuation during London will often reverse twice in the Asian session before resolving. Wait for London open.
Stops that are too tight. Gold’s 4H candles regularly produce 25-40 pip wicks during normal sessions. A 15-pip stop on a 4H setup will hit its loss before the trade has time to play out. Size positions smaller and give the stop room.
Ignoring the weekly trend. Daily and 4H setups on gold only produce reliable results when they align with the weekly structure. Trading counter-trend, even with a technically solid 1H trigger, carries measurably lower win rates. I stopped taking counter-trend gold trades entirely in 2024 after tracking the results separately for six months.
Chasing breakouts without confirmation. When gold breaks above a major round number like $3,000, retail traders pile in. Many of those breakouts fail within 24 hours as price pulls back to retest the level. My rule: wait for a daily close above the level, then enter on the pullback to the broken resistance.
Overleveraging on a directional conviction. A 50-pip adverse move against an oversized position takes 20% of a $500 account in a single trade. Size every position based on the stop distance, not on how confident the setup looks.
FAQ
What is the best time to trade gold (XAU/USD)?
How much capital do I need to start trading gold?
Is gold easier to trade than forex pairs?
What indicators work best for gold trading?
What are typical spreads for trading XAU/USD?
Can you trade gold on MetaTrader 4?
What is the biggest risk when trading gold?
🌍 Our recommended brokers


Reader Reviews
The five-condition checklist is the most useful filter I have applied to gold trading in four years. Before using it I was entering on 4H signals alone and my win rate on XAU/USD sat at 44% over a difficult eight-month stretch. After committing to all five checks - weekly structure, daily level, 4H pullback, 1H trigger, session window - it improved to 61% across the next 22 trades. The biggest single change was dropping setups where the weekly structure was sideways or bearish. I had been treating counter-trend 4H setups as valid entries and the data showed clearly they were responsible for most of the underperforming trades. The session timing condition caught three more entries I would have taken during the Asian window, all of which would have been losses based on what price did in the following hours.
Stopped trading gold during the Asian session after reading this and the difference was immediate. I had been taking two or three XAU/USD setups per week during the Tokyo session and losing on them at a higher rate than my London trades without understanding why. Three weeks of London-only entries cut my monthly loss frequency by roughly half. The spread difference alone - 0.3 pips versus 1.8 pips on my broker - explained part of it.
The weekly trend filter is something I had been told about but never applied with the discipline this article describes. My previous approach to XAU/USD was to look for setups on the daily chart regardless of what the weekly showed. Tracking results separately for trend-aligned versus counter-trend entries over 16 trades produced a 67% win rate on trend-aligned and 29% on counter-trend. The difference is large enough that I stopped taking counter-trend gold trades entirely. Monthly returns moved from averaging 6.1% to 8.4% after removing the counter-trend category and resizing positions slightly larger on confirmed trend setups. The multi-timeframe structure described here is the same framework - I was doing two steps of it without the third and fourth, which explains the inconsistency.
The 20 EMA plus 61.8% Fibonacci confluence point is the most consistent setup I have found on gold. What I did not understand before this article is that confluence means both levels need to be within 10-15 pips of each other - not just near the same zone loosely. Applying that precision to my existing entry criteria reduced the number of setups per week but improved hit rate significantly.
The position sizing formula is the clearest explanation of gold lot sizing I have seen. Running the math on a $1,200 account with a 50-pip stop: $12 at 1% risk divided by $5 per pip at 0.01 lots equals 0.024 lots, which I round to 0.02. Before this I was sizing by feel and regularly taking 0.05 lots on gold with stops that were too tight. The three-step process - find invalidation level, add buffer, calculate lots - is repeatable and takes under a minute. My actual monthly returns on gold are around 7.3% over the past two months using this framework, which is in range with what the article documents.
Compared the checklist approach to my previous random entry system over 30 trades each and the results confirmed everything this article explains. Random entries on gold: 41% win rate, average loss larger than average win. Checklist entries over the following 30 trades: 63% win rate, average gain at 1.7x average loss. The compounding effect across a quarter put monthly returns at 7.8% versus 2.1% in the prior period. Most of the improvement came from skipping setups where the 4H pullback had not actually formed into the daily level - I had been entering as soon as price reached the approximate zone, not waiting for the pullback to complete. The 1H trigger requirement is what forces that discipline.
Moved to a raw spread account after reading the section on XAU/USD execution costs. The difference between 3.2 pips on my previous account and 0.4 pips on the new one adds up to over $60 per month at my trading frequency. The broker recommendation in the article matched what I was already researching.
The daily 20 EMA as dynamic support in trending gold markets is accurate - I had been watching the same level for two years without formalizing it as an entry condition. The article quantifies it with 20 confirmed instances of gold holding the level in a two-year sample, which matches my own observation. Using it as a required condition rather than a rough reference cut my entry frequency on gold but raised the average trade quality across the next 18 live setups, producing a monthly average of 6.9% over the period.
Leave a Review

Forex Analyst & Senior Trader
Former FX desk trader with 8 years in institutional forex. Works in multi-timeframe analysis and order flow, turning desk experience into systematic, testable rules across forex and metals.