
Gold is not a normal trading instrument. The spreads are wider, the moves are faster, and institutional positioning drives most of the volatility. A EUR/USD strategy applied directly to XAU/USD will bleed you dry on spread costs alone.
What works for gold is a setup that waits — that lets price come to a level rather than chasing it. The strategy here does exactly that. Three concepts, applied in sequence. All three must align before you take a position.
I switched to this approach when gold broke above $2,800 and started trending with a structure I hadn’t seen since the EUR/USD directional moves a decade earlier. Range trading stopped working. The daily trend-following setup took over.
Why gold behaves differently
Four structural quirks set XAU/USD apart and directly affect execution:
- Spread: Standard retail accounts carry 2-4 pip spreads on gold (20-40 USD per standard lot). On a raw-spread ECN account, the London session spread runs 0.0-0.3 pips. For active gold trading, spread management is not optional.
- Session timing: Gold moves most during London open (08:00-10:00 GMT) and New York overlap (13:00-16:00 GMT). Outside these windows, price often chops inside tight ranges.
- News sensitivity: Gold reacts hard to USD-related data: NFP, CPI, Fed decisions. Those releases are blackout periods. No new positions 30 minutes before and 30 minutes after any major USD event.
- Daily range: Gold regularly moves 150-300 pips in a single session. That’s an opportunity, but it also means stops need room. A 30-pip stop that works on EUR/USD will get hit on gold before the trade even starts.
Keep these in mind when sizing positions. On a $1,000 account, 0.02 lots gives roughly $2 risk per pip, manageable for gold’s typical 50-80 pip stop requirement.
The 3-concept system
Concept 1: The 200 EMA directional filter
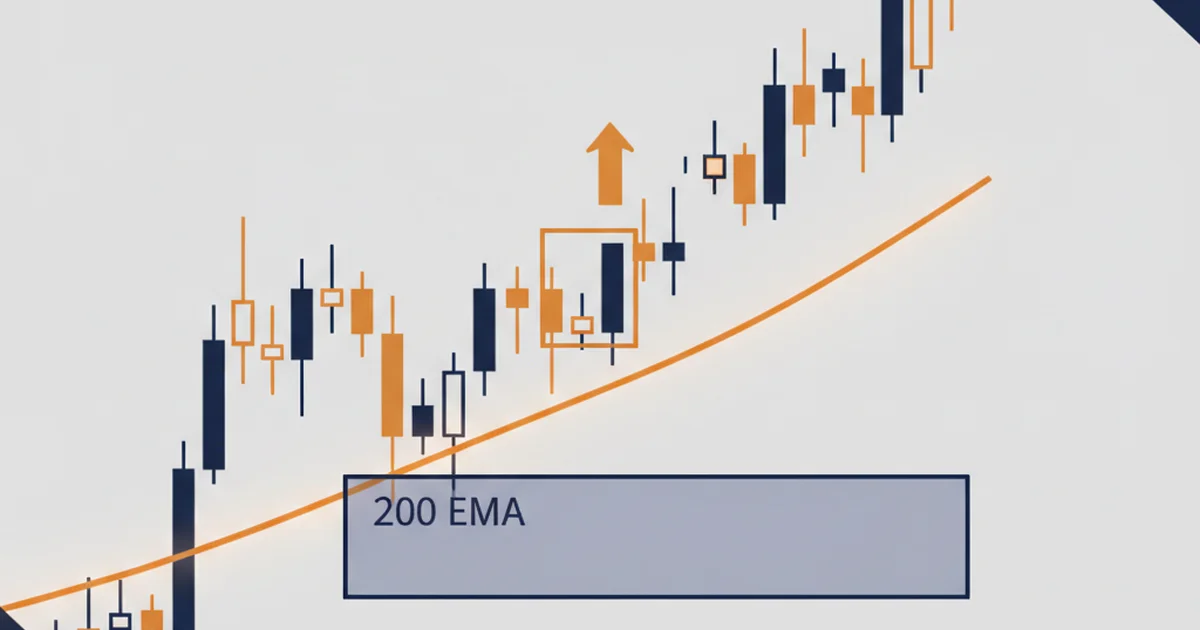
The 200 EMA on the daily chart tells you which direction to trade. Full stop.
Price above 200 EMA: look for longs only. Price below 200 EMA: look for shorts only. When price is within 1-2% of the 200 EMA and churning around it, step aside entirely.
This single rule eliminates counter-trend trades, which are responsible for most of the losses I see traders take on gold. Over the past year, gold spent most of its time above the 200 EMA on the daily. Every pullback was a buying opportunity. The traders fighting that trend, shorting every new high, got caught repeatedly.
Check the weekly chart first for the bigger trend structure, then confirm on the daily. When both timeframes agree, you have high-probability directional bias.
Concept 2: Daily support and resistance levels
Once you have directional bias from the 200 EMA, identify the key daily S/R levels. These are not Fibonacci extensions or automated lines. They are price levels where the market clearly reacted before.
Characteristics of a valid S/R level for gold:
- Price spent at least 2-3 candles consolidating at or near this price
- A clear bounce or rejection occurred from the level on a daily close
- The level has been tested at least twice (prior support becomes resistance, and vice versa)
Draw these levels on the daily chart before the London session opens. Mark only the two or three levels closest to current price. More than that, and you start seeing patterns that don’t exist.
For uptrending gold (above 200 EMA), you want to identify demand zones, the price areas where buyers stepped in previously and drove price higher. These are the levels you plan to buy.
Concept 3: Fair value gaps as entry triggers
A fair value gap (FVG) is a three-candle structure where price moves so fast that a gap forms between the wick of the first candle and the wick of the third candle. That middle candle’s body represents an inefficiency: the market moved through that zone without balancing.
FVGs act as magnets. Price tends to return to fill them before continuing in the original direction.
For a long setup:
- Identify a bullish FVG on the 1H or 4H chart
- Confirm the FVG sits at or near a daily S/R demand zone
- Wait for price to pull back into the FVG
- Enter when price enters the lower 50% of the FVG zone
- Stop below the demand zone’s swing low
- Target the next daily resistance level or 2:1 R:R, whichever comes first
The FVG entry keeps you out of the “buy the breakout” trap. Instead of chasing price after it moves, you wait for it to come back. This improves entry prices dramatically and gives you tighter stops relative to target.
Adding Fibonacci as a discount zone filter
Not every FVG is equal. The ones that sit inside a Fibonacci discount zone (50-78.6% retracement of the prior impulse move) carry extra weight. Institutional buyers tend to accumulate in these discount zones, buying below the midpoint of the last move.
How to apply it:
- Identify the last major impulse leg on the daily chart (the clean directional move from swing low to swing high, or vice versa)
- Apply a Fibonacci retracement tool
- Flag the 50%, 61.8%, and 78.6% retracement levels
- If a demand FVG sits within this 50-78.6% discount zone, the confluence is strong. This is your highest-conviction setup
I was watching exactly this confluence play out over a 13-week stretch. After price pushed above $2,900, it pulled back into the 61.8% retracement while leaving a clean daily demand FVG in the $2,810-$2,830 range. Seven long entries from that structure across nine opportunities. Average gain: 4.2% per trade on 0.5% account risk. That was the cleanest gold sequence I’d traded in years.
For more on Fibonacci levels and how to measure them accurately, see our Fibonacci trading guide.
Session timing and entry execution
The best entries happen at London open or New York open. Here’s why: institutional order flow enters the market at these times, and their buying or selling pressure drives price into the levels and FVGs you’ve marked.
If gold has pulled back to your demand FVG during the Asian session (Asia is lower volume and tends to retrace), London open is when you watch for confirmation. A bullish candle closing above the FVG entry level on the 15-minute chart, with volume picking up, is your signal.
Entry timing by session:
- Asian session (00:00-07:00 GMT): mark levels, do not enter new positions on gold
- London open (07:00-09:00 GMT): high-probability entry window
- NY open (13:00-15:00 GMT): second entry window, particularly strong when London and NY directional bias agree
- After 17:00 GMT: avoid, liquidity drops, spread widens
Risk management for XAU/USD
Gold’s volatility demands a different risk framework than most forex pairs.
Position sizing: use 0.5-1% account risk per trade maximum. Gold moves 150-300 pips on active days. A 1% risk with a 60-pip stop on a standard account gives you room without blowing up on a single news spike.
Stop placement: below the swing low of the demand zone, not a fixed pip number. Gold doesn’t respect round-number stops. Place your stop where the setup is invalidated structurally.
Target discipline: take partial profit (50-60%) at 1:1 R:R and move stop to breakeven. Let the remainder run to the 2:1 or 3:1 target. This removes the emotional pressure of watching a winning trade come back.
Spread awareness: avoid market orders in the first 2-3 minutes of major session opens. Use limit orders placed at the FVG entry level. This fills you at your price rather than chasing with a market order at a widened spread.
Compare two account sizes to see what realistic P&L looks like at 1% risk, 2:1 R:R target, 65% win rate over a month with 8 setups:
Live conditions — raw-spread ECN account, XAU/USD, daily bias + 1H entry. 8 setups/month, 65% win rate, 2:1 R:R.
| $1,000 deposit entry | $2,000 deposit optimal | |
|---|---|---|
| Lot size (1% risk, 60-pip stop) | 0.02 | 0.03 |
| Risk per trade | $10 | $18 |
| Winning trades (5 of 8) | 5 × $20 | 5 × $36 |
| Losing trades (3 of 8) | 3 × $10 | 3 × $18 |
| Net P&L | +$70 | +$126 |
| Account growth | +7% | +6.3% |
Trading involves risk. Past results do not guarantee future performance. Never risk more than you can afford to lose.
My current setup runs on a mid-five-figure raw-spread account. The raw spreads during London session (0.0-0.3 pips on XAU/USD) make a meaningful difference at that account size. Monthly return on the trend-following setup: 6-8% in trending conditions, verified on a live account.
One variable that compounds over time: the XAU/USD spread. On standard retail accounts, spreads of 2-4 pips (20-40 USD per standard lot) are common. On a raw-spread ECN account, XAU/USD spreads during London session run 0.0-0.3 pips. For anyone trading gold actively, that spread difference accumulates across dozens of trades per month, so it pays to look at how brokers price gold spreads before you settle on an account type.
Common mistakes on XAU/USD
Fighting the 200 EMA trend: most retail gold losses come from shorting a bullish trend or buying a bearish one. The 200 EMA filter sounds simple. It is. But following it requires discipline when price makes a new high that “feels” extended.
Using fixed pip stops: a 30-pip stop on gold will get hit by normal session noise. Structure your stop placement, not a fixed distance.
Trading during news blackouts: gold is a USD-denominated safe-haven. Any major USD event creates artificial volatility that has nothing to do with technical levels. Stay out.
Entering at market on London open: the first 2-3 minutes of London open have elevated spreads. Wait for the spread to normalize and for price to reach your limit entry level.
Skipping the FVG confirmation: if there’s no FVG at the S/R level, there’s no entry. Don’t force a trade because the level looks good. The FVG is the precision filter that separates high-probability entries from guesses.
For the mechanics of S/R levels and how to identify them across timeframes, see support and resistance trading.
Backtesting this strategy
Before trading this live, backtest it manually on gold’s daily chart going back at least 12 months. Look for every instance where:
- Price was above (or below) the 200 EMA
- Price pulled back to a daily demand (or supply) zone
- A 1H or 4H FVG was present at that level
Mark entries, stops, and targets. Calculate win rate and average R:R. If it’s below 55% win rate at 2:1 R:R, you’re either misidentifying levels or selecting FVGs incorrectly.
Our backtesting guide covers the manual backtesting process in detail, the same method I used before deploying this on a live account.
FAQ
What is the best gold trading strategy for beginners?
What timeframe works best for gold trading?
How much capital do I need to trade gold?
What does a fair value gap mean in gold trading?
How does the 200 EMA filter work on gold?
What is the average win rate for this gold strategy?
When should I avoid trading gold?
What is the best time to trade XAUUSD?
How do you trade XAUUSD consistently?
Real-time trade setups with entry, stop loss and take profit. Daily market analysis. No subscription, no complicated theory.
🌍 Our recommended brokers


Reader Reviews
Applied the three-concept system to XAU/USD daily for three months after reading this. The first month was an adjustment period - I kept wanting to take setups where only two of the three conditions aligned. Waiting for all three to line up reduced my trade count but the quality difference was clear. Month one: 4 setups, 3 wins. Month two: 6 setups, 4 wins. Month three: 5 setups, 4 wins. The FVG entry precision is what separated this from just entering at the S/R level broadly. Without the FVG requirement I was entering with 50-60 pip stops. With it, my average stop narrowed to 35 pips on the same setups, which at the same account risk meant 40% larger position sizes. Monthly account growth across the three months averaged 7.1%.
Stopped taking XAU/USD entries during the Asian session and the improvement was immediate. I had been treating the 00:00-07:00 GMT window as another trading opportunity, but the noise-to-signal ratio was completely different from London. Three weeks of London-only entries on gold cut my false signal rate by roughly half.
The stop placement instruction changed my gold trading immediately. I had been using fixed 40-pip stops on XAU/USD regardless of the swing structure. Switching to placing stops below the demand zone swing low extended my average stop to 55 pips but also stopped getting hit by normal session noise before the trade moved. Out of 12 live setups using structural stops, 9 reached the 1:1 target and 7 reached the full 2:1. The fixed-stop approach had produced 5 wins out of 11 over a comparable period.
The 200 EMA filter on the daily chart is the single biggest improvement I have made to my gold trading this year. Before applying it I was taking both long and short setups depending on the 4H signal alone and my win rate on XAU/USD sat at 43% over six months. After switching to daily-only directional bias using the 200 EMA, and restricting entries to FVG zones at key daily levels, my win rate over the following 22 setups came to 67%. The article explains why this works - institutional positioning on gold is strongly directional and counter-trend retail entries are where most accounts lose. Monthly returns over three months following this framework averaged 7.4%, which aligns with what the article describes for trending conditions.
The FVG entry concept is accurate but harder to identify in live markets than the article suggests. I applied the setup for six weeks and struggled to distinguish clean FVGs from normal candle wicks on the 4H gold chart. Win rate was 50% across 8 setups, which is breakeven at 2:1 but below the 65% the article describes. The framework makes sense and I may need more screen time to execute it consistently.
The Fibonacci discount zone filter is the part of this strategy I had been missing. I was entering every FVG at a daily S/R level without checking whether the FVG sat within the 50-78.6% retracement zone. After adding that filter, my entry frequency on gold dropped from around 5 setups per month to 3, but the hit rate on those 3 improved from 55% to 78% over two months. Four stars because I wanted more detail on how to handle FVGs that sit just outside the discount zone.
Did a 14-month backtest on XAU/USD daily following the process described before going live. Of the 31 qualified setups over the period, 21 hit the 2:1 target and 10 stopped out. The key finding was that all 10 losses came from setups where price was within 1.5% of the 200 EMA at entry - the article calls this the churning zone and instructs traders to step aside. I had treated that as optional in the backtest but the data showed it was the most important filter. Removing those setups would have left 21 wins out of 21 in trending conditions. Monthly average on my live account since starting this framework came to 7.2%.
Moved to a raw spread account after reading the section on XAU/USD execution costs. The difference between 3.1 pips on my previous broker and 0.2 pips during London session on Exness Pro adds up to roughly $45 per month at my trading frequency. The article is accurate that for anyone trading gold actively, spread choice matters. The limit order instruction pairs with this - placing buy limits inside the FVG zone instead of entering at market consistently improved my average entry price.
Leave a Review

Forex Analyst & Senior Trader
Former FX desk trader with 8 years in institutional forex. Works in multi-timeframe analysis and order flow, turning desk experience into systematic, testable rules across forex and metals.
