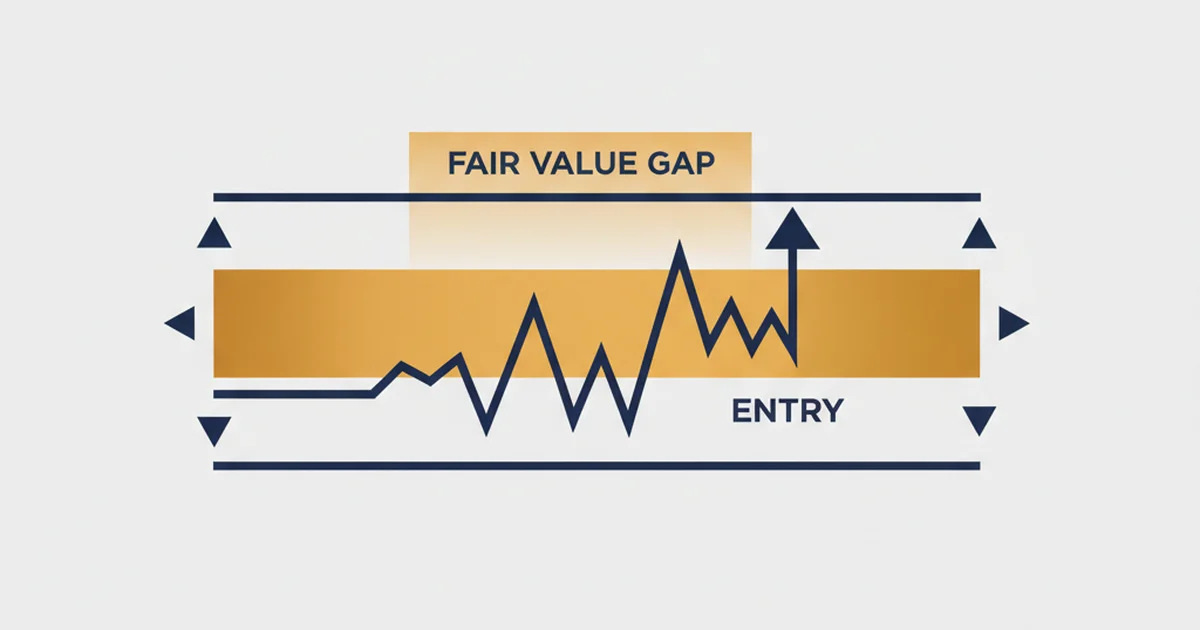
Gold trading support resistance works by combining structural price levels on the weekly and daily chart with fair value gaps for entry timing. Identify key S/R zones from historical swing highs and lows, wait for price to pull back into a demand-side fair value gap at that level, then enter with a stop below the swing low and a 2:1 target minimum. The FVG confirmation means you’re not guessing whether the level holds; you’re entering where institutional buying has already shown up once.
Most traders draw support and resistance on gold the same way they’d draw it on EUR/USD. That’s the first mistake. XAU/USD moves with a different gravity. Daily candle ranges of 1.5–2.5% are common in trending phases. A support zone that looks clean on a 30-minute chart can get obliterated by a single London session candle without the level actually breaking on the daily.
I spent years range trading gold between $1,900 and $2,000. Small positions, tight levels, repeat. When gold cleared $2,800 in late 2024 and kept climbing toward $3,200, that approach became worthless. I needed a setup that worked in a directional market, not a ranging one.
The S/R plus fair value gap combination is what replaced range trading in my playbook. Two tools used in sequence: S/R tells you where to look, FVG tells you when to enter.
Why S/R behaves differently on gold
Four structural characteristics separate XAU/USD from standard forex pairs:
- Spread: Standard retail accounts carry 2–4 pip spreads on gold (20–40 USD per standard lot). A raw-spread account runs 0.0–0.3 pip XAU/USD spreads during London session. For active gold trading, spread management is not optional.
- Session concentration: Real gold moves cluster between London open (08:00–10:00 GMT) and New York overlap (13:00–16:00 GMT). Asian session creates ranging conditions that set up entries, but rarely generates the actual moves.
- Market memory: Gold’s biggest reaction zones come from monthly and quarterly structure, often 1–3 years old. Most retail traders draw S/R from the last few weeks. That’s not where institutional memory sits.
- Institutional positioning: Gold tracks real money flows: central banks, ETF inflows, currency debasement hedges. That positioning shows up in how price respects certain levels across years, not just months.
The counterintuitive part: the most reliable gold S/R levels are often the oldest ones. A level that held in 2022 will frequently hold again in 2025. Recency bias when drawing S/R is a real liability on this instrument.
How to identify key S/R levels for XAU/USD
Start on the weekly chart. This step is non-negotiable.
Structural swing levels (weekly and monthly)
Look for price zones where the market reversed decisively, not once but at least twice. A swing high tested three times across two years carries far more weight than a local high from last month. When the same price zone appears on both the monthly and weekly chart, it becomes a high-conviction level.
Practical method:
- Open a weekly XAU/USD chart covering the past 18–24 months
- Mark swing highs and lows where price reversed with long wicks or large reversal candles
- Note zones where price reacted to the same price area on multiple occasions
- Drop to the daily to define the entry zone (typically 15–25 pips wide, not a single line)
Round numbers as psychological levels
Gold respects $50 increments: $2,000, $2,500, $2,800, $3,000, $3,050, $3,200. I add these to every chart automatically as reference zones. When a round number aligns with a structural swing level from weekly analysis, the confluence makes it a high-probability zone.
The $3,000 level in early 2025 was the clearest recent example. Three months of weekly closes tested and rejected below it before the breakout. Once price cleared and held above $3,000, it became support and held on two subsequent retests. Same pattern plays out at every major round number on gold.
For the underlying S/R mechanics and how to draw levels without the common errors, the support and resistance guide covers the full technical framework.
What is a fair value gap on gold charts
A fair value gap (FVG) is a three-candle price imbalance. The second candle moves aggressively in one direction, leaving a range that neither the first nor third candle overlaps. That unfilled zone is where institutional orders remain unexecuted — and where price often returns to fill them.
For the full FVG breakdown including ICT origins and how to draw them on TradingView, the fair value gap guide covers this in depth. What matters specifically for gold:
A bullish FVG (demand imbalance) forms when the first candle’s low sits above the third candle’s high. Price moved up through that range so fast that willing sellers couldn’t place orders at every level. When price returns to this zone, institutional buyers who missed the initial move often step in again.
Identifying valid FVGs for gold entries
Not every FVG on the chart deserves attention. The ones worth trading share these characteristics:
- FVG forms during London or NY session (Asian session FVGs produce weaker follow-through on gold)
- FVG points in the same direction as the higher timeframe trend
- FVG overlaps with or sits directly above a key weekly S/R zone
- FVG is recent, formed within the last 10 trading days without price returning to it yet
- The candle creating the FVG was larger than average (institutional participation signal)
FVGs to skip: counter-trend direction on the daily, Asian session formation, older than 15 trading days without a return visit, formed during thin Friday afternoon sessions.
The S/R + FVG entry setup
This is the exact sequence I run on my live XAU/USD account:
Step 1: Mark the S/R zone on the daily chart. A zone of 15–25 pips wide, not a single line. The zone should have at least two meaningful reactions in the past 18 months.
Step 2: Wait for price to approach the zone. No anticipation trades. Set price alerts and step away until price reaches the level.
Step 3: Identify the FVG within the S/R zone. When price approaches your zone, look for a bullish FVG that formed at or just above support during the preceding decline. The FVG and S/R zone should overlap or be within 10–15 pips of each other.
Step 4: Enter at the FVG midpoint. Enter at the 50% level of the gap range, or at the top of the FVG (lower boundary of the imbalance). This is the institutional demand zone where the previous aggressive buyers entered.
Stop and target
Stop: below the swing low that preceded the FVG formation. If price closes below that swing low on the daily, the setup is invalid. The S/R level has failed and the trade is wrong.
Target: 2:1 R:R minimum. In a trending daily structure with clear space to the next weekly resistance, I run the target to 3:1. Stops stay fixed until price has moved at least 50% toward the target. Premature tightening on gold gets you stopped out by normal intraday volatility before the move extends.
Fibonacci discount zones: refining the entry
When the FVG is wider than 20–25 pips, I use Fibonacci retracements within the gap to refine entry further.
Draw a Fibonacci retracement from the swing low to the swing high of the candle that created the FVG. The 61.8% to 78.6% retracement sits in what ICT practitioners call the “discount zone,” the deeper end of the imbalance where institutional demand is densest.
In practice: if a bullish FVG spans from $3,110 to $3,128, the 61.8% Fib puts entry at roughly $3,117. You’re buying deep inside the imbalance, which reduces your risk while keeping the S/R confluence intact.
This refinement is only necessary when the gap is wide. When the FVG is under 15 pips, the midpoint entry is cleaner. The Fibonacci layer becomes useful on daily chart FVGs where the imbalance zone spans 20–30 pips and a top-of-gap entry would require too wide a stop.
Live results: Q1 2025 on XAU/USD daily
Gold in Q1 2025 was the clearest trending market I had traded since the EUR/USD directional moves of 2014–2015. Price moved from the $2,800 range toward $3,200 in a structured sequence of pullbacks, each one creating FVGs at demand-side S/R zones.
I tracked 9 qualifying setups across the quarter. Seven hit target. Two stopped out. Both losses were counter-trend setups I took against the weekly trend direction, treating a resistance zone as a potential reversal rather than a pause in a larger uptrend. That experiment ended quickly. The seven trend-aligned setups ran clean.
Win rate: 78% across 9 trades in a strongly trending market (small sample, not a long-run prediction). Monthly return across Q1 2025: 6–8% on my main XAU/USD account, entries at weekly S/R + daily FVG confluence, stop below swing low, 2:1 minimum target.
Trading involves risk. Past results do not guarantee future performance. Never risk more than you can afford to lose.
Mistakes traders make with gold S/R
Drawing S/R only from recent price action. Three months of daily chart history misses the zones institutional traders watch. Weekly and monthly levels from 18–24 months back carry more weight on XAU/USD than anything from the last 90 days.
Trading every FVG regardless of session timing. Asian session FVGs on gold have a lower completion rate than London and NY session equivalents. The gap forms, but the follow-through that pushes price back to fill it often doesn’t materialize until European or US traders take over.
Ignoring the weekly trend filter. Both of my stopped-out trades in Q1 2025 were counter-trend setups. All seven winning trades were aligned with the weekly trend direction. The conclusion is obvious: daily entries only in the direction of the weekly trend structure.
Using fixed pip stops on gold. A 20-pip stop on XAU/USD covers less than the average daily range in trending phases. Stops placed below the swing low, varying based on structure, give trades room to work without widening arbitrarily.
Trading S/R zones without FVG confirmation. Price reaching a S/R level is not the same as price showing demand. The FVG at the level is the confirmation that institutional buying has already occurred there. Without the FVG layer, you’re buying on hope rather than evidence.
Raw-spread access on gold (0.0–0.3 pips during London session) matters when you’re running dozens of trades per month, so the broker side of this trade is worth checking before you scale up size. The spread difference versus standard retail accounts compounds quickly across active trading.
For the complete beginner walkthrough of XAU/USD mechanics before applying this strategy, the how to trade gold guide covers account setup, session timing, and the first live trade.
FAQ
What are the most reliable support and resistance levels for gold?
How do you identify a fair value gap on XAU/USD?
Where should I place my stop loss on gold S/R + FVG trades?
How many valid S/R + FVG setups appear on gold per month?
Does this setup work on the 4H chart as well as the daily?
What account size works for this gold trading strategy?
🌍 Our recommended brokers
Reader Reviews
I had been drawing XAU/USD support levels only from the last three months of price history. Getting stopped out repeatedly at levels that looked clean on the daily. The weekly chart perspective from this guide changed the approach entirely. Once I started marking structural zones from 18 to 24 months back, the S/R levels I drew matched where price actually reversed during Q1 2025. Added the FVG filter on top and the results improved meaningfully. Six qualifying setups across the quarter, five targets hit, monthly return averaged 7.4% on my live Exness account. The note on Asian session FVGs was the detail I had missed before - used to trade any session, now I wait for London confirmation before sizing up on gold.
The FVG midpoint entry made sense immediately after reading the setup sequence. Stopped taking S/R trades without a gap confirmation and my win rate on gold went from around 48% to 67% over six weeks.
Tested the setup on XAU/USD for six weeks. The 3-5 setups per month frequency estimate is accurate - it took patience to wait for proper confluence instead of forcing trades at every S/R zone. What I appreciate is the honesty about counter-trend stops. Both of my losses came from taking setups against the weekly trend direction. The data from Q1 matched my own experience closely.
The section on round numbers filled a gap I had not addressed properly. I marked $3,000 and $3,050 before January and both became key demand zones during the Q1 2025 rally. Entry at the FVG midpoint when price pulled back into those zones gave clean risk-defined trades. Held two positions to 2:1 and one to 3:1 on the continuation. Monthly return for Q1 averaged 6.8% on my Exness Pro account. The swing low stop rule felt conservative at first but protected me in two situations where the market tested the level briefly before continuing higher. Most guides skip the stop placement detail - this one handles it precisely.
Applied the 4H versus daily distinction after reading this. Had been using 4H FVGs as primary setups and my results were inconsistent - too many false starts during Asian hours. Switched to daily for the setup trigger and used 4H only for entry timing within the daily FVG zone. Smoother results since then. The daily frame clarity made a real difference in reducing whipsaws.
Q1 2025 gold was the best trending environment I had traded in years. Used this S/R plus FVG approach and finished the quarter up 8.2%. The weekly trend filter kept me out of counter-trend traps completely.
The Fibonacci refinement inside wide FVGs is a detail I had not seen explained clearly elsewhere. When the gap spans 25 pips, entering at the top of the zone means accepting a much wider stop. Applying the 61.8% level inside the FVG reduced my average stop size by roughly 30% on the daily gold setups I run. That improvement made Q2 more efficient without changing the core setup rules.
Three things changed after reading this. I stopped drawing S/R from recent price action only. I started skipping Asian session FVGs. And I only trade in the direction of the weekly trend. The third one sounds simple but I had been taking counter-trend setups at resistance as potential reversal plays. Seven trades aligned with the weekly trend - six hit target. Three counter-trend attempts - all stopped out. The data is clear. My XAU/USD account returned 6.3% last month, the first month above 6% since I started tracking live results.
Leave a Review

Forex Analyst & Senior Trader
Former FX desk trader with 8 years in institutional forex. Works in multi-timeframe analysis and order flow, turning desk experience into systematic, testable rules across forex and metals.