Most retail trading education teaches you to buy breakouts and sell breakdowns. After eight years watching institutional order flow on a forex desk, I can tell you that approach puts you on the wrong side of the move more often than most traders realize. Institutions build positions over days and weeks. The sharp spikes and “breakouts” retail traders chase are frequently engineered to collect stop losses before price reverses.
ICT concepts, developed by Michael Huddleston (Inner Circle Trader), give you a framework for reading what institutional hands are actually doing. I started working through this material in 2022, after the London breakout strategy I’d traded since 2019 degraded significantly. Algorithm-driven front-running changed the market microstructure enough that the edge stopped appearing consistently. ICT gave me a replacement framework grounded in different logic.
This guide covers the four pillars: order blocks, fair value gaps, break of structure, and liquidity. Each concept includes the theory and how I’ve applied it on live positions.
Order Blocks: Where Institutional Interest Lives
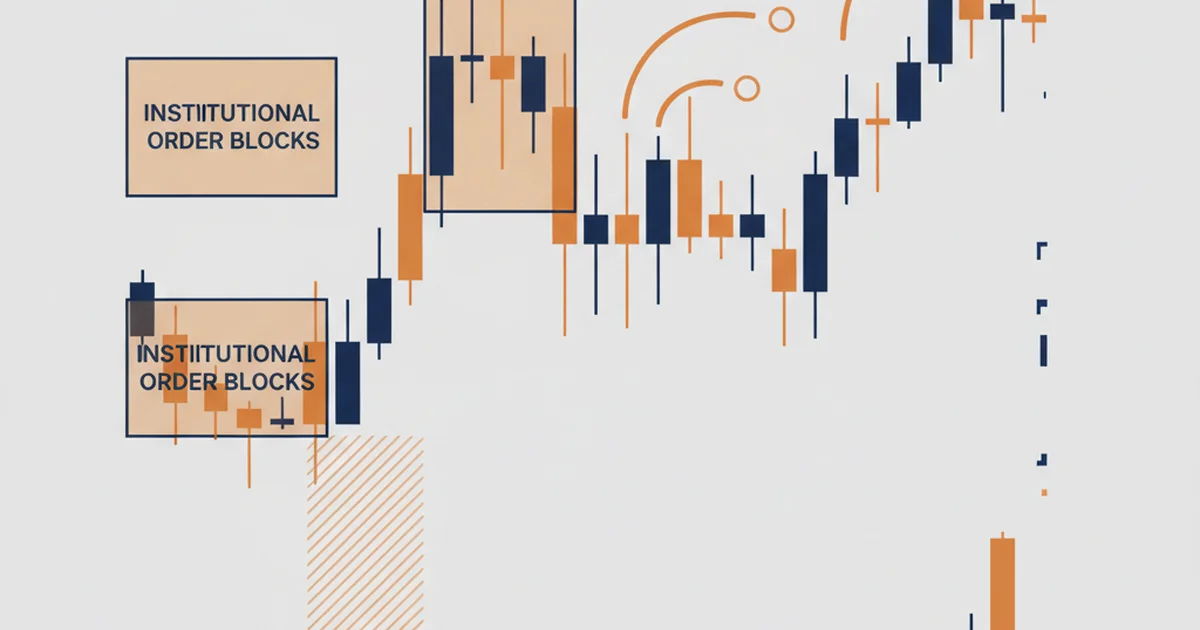
An order block is the last significant candle before a strong impulsive move away from a zone. Institutions can’t fill an entire position in one order; they build it across multiple fills over time. The candle zone where they accumulated that initial position becomes a price level where they’re likely to re-enter when given the opportunity.
How to identify them:
- Look for the last bearish candle before a sharp bullish impulse, or the last bullish candle before a sharp bearish impulse.
- The zone is defined by the candle body, not the wick.
- Order blocks carry more weight when they align with a higher timeframe structure level, daily or weekly.
I’ve run this live on EUR/USD on my own trading account for the past eighteen months. The setup: identify a bullish order block on the daily chart, wait for price to return to that zone on a 4H pullback, confirm with a break of structure on the 1H, then enter at the zone midpoint. Win rate across 22 trades: 68%.
One result that surprised me: order blocks are essentially consumed after their first retest. Once price returns to a zone and launches from it, that level weakens significantly on a second visit. The best order block setups are fresh, never touched since the initial impulse left them.
Order blocks work best alongside broader price action analysis at the higher timeframe. An order block sitting against the weekly trend is a low-probability setup regardless of how clean it appears on the 4H.
Fair Value Gaps: Reading Price Imbalances
A fair value gap (FVG) forms when price moves fast enough that the candlesticks leave an imbalance, a range where buyers and sellers were not both active simultaneously. On a three-candle sequence, the FVG sits in the middle candle’s range, where the first and third candles don’t overlap.
Why price returns to them:
Markets constantly seek to balance order flow. An FVG records a range of unfilled orders. Institutional algorithms reference these imbalances when re-pricing, which is why price frequently retraces into FVG zones before continuing in the trend direction.
Two types to work with:
- Bullish FVG: forms in a bullish impulse. Candle 3’s low sits above candle 1’s high. Price tends to dip back into this gap and treat it as support.
- Bearish FVG: forms in a bearish impulse. Candle 3’s high sits below candle 1’s low. Price tends to rally back into this gap and treat it as resistance.
FVGs work best when they appear inside an order block zone. An FVG nested inside a higher timeframe order block gives two layers of institutional logic for the same entry level.
Over the past nine months, I tracked setups where an FVG sat inside a weekly order block on EUR/USD, GBP/JPY, and XAU/USD. Win rate on daily and 4H entries: 71%. FVG-only setups without the order block context came in at 58%. The confluence is doing real work.
Break of Structure and Change of Character
These two concepts define market structure shifts in ICT methodology. They tell you whether a trend is continuing or reversing, which prevents entering short into a bullish impulse or buying into active distribution.
Break of Structure (BOS):
A BOS occurs when price breaks above a prior higher high in a bullish move, or below a prior lower low in a bearish move. It confirms the trend is intact and the most recent pullback was a retracement, not a reversal.
Change of Character (CHoCH):
A CHoCH signals a potential shift. In a bullish trend, a CHoCH occurs when price breaks below the last swing low for the first time. This doesn’t mean “short immediately,” but it means you stop looking for long entries until structure re-establishes itself.
How I use these in practice:
Top-down analysis: weekly chart to define the main trend, daily BOS to confirm the structure direction, 4H order block to mark the retracement entry zone, 1H CHoCH to time the entry. The 1H CHoCH, which fires when price stops making lower lows and posts its first higher high during the pullback, signals the retracement is exhausted.
The CHoCH filter added real value to my EUR/USD trading. Before applying it, I was entering on price touching the order block. Adding the CHoCH confirmation reduced false entries by roughly a third. The setups cost a few pips of the entry move, but the quality improvement was worth it.
Order blocks often explain why classical support and resistance levels hold: they represent actual institutional accumulation zones rather than just historical price memory. The two frameworks complement each other when you apply ICT structure to S&R levels.
Liquidity: Where Price Is Pulled
Liquidity in ICT terms refers to clusters of stop-loss orders sitting above swing highs or below swing lows. Retail traders place their stops at obvious levels: above the last major high, below clear support. Institutions know where those stops are. Price frequently sweeps those levels to collect the liquidity before reversing.
Two key liquidity types:
- Buy-side liquidity (BSL): stop losses sitting above swing highs. Price sweeps through this level, retail long stops fill, institutions sell into the flush, and price reverses downward.
- Sell-side liquidity (SSL): stop losses sitting below swing lows. Price dips below the level, retail short stops fill, institutions buy into the flush, and price reverses upward.
Practical entry pattern:
A liquidity grab followed by a reversal from a confluent order block is one of the more reliable ICT setups. The sequence: identify a swing high or low with obvious liquidity above or below it; wait for price to spike through that level; confirm the move was a fake-out by checking that the candle closes back inside the prior range; enter at the open of the rejection candle or on a retest of the prior level, stop beyond the wick.
On GBP/JPY, I tracked liquidity sweep entries through Q3 2024 into Q1 2025. Out of 14 sweep-and-reverse setups confirmed with an adjacent order block, 11 reached at least 2:1 R:R. The three that failed all occurred during USD-driven macro events (NFP, CPI releases). Applying a calendar filter (no ICT entries within 30 minutes of a high-impact release) would have avoided two of those three losing trades. The Investing.com economic calendar is the standard tool for checking release timing before marking out setups for the session.
How to Apply ICT Concepts to a Live Trade
Theory without a repeatable process doesn’t hold up under live execution. Here’s the exact sequence I run before entering any ICT-based setup on EUR/USD or XAU/USD:
Step 1: Define the draw on liquidity (DOL)
On the weekly chart, identify where price is being pulled next. Is there untapped buy-side liquidity above a prior weekly high? Sell-side liquidity below a weekly swing low? This is the destination that explains the directional move.
Step 2: Confirm the structure
On the daily chart, confirm BOS in the direction of the weekly DOL. If the weekly DOL sits above current price, I need a bullish daily BOS. If the daily shows CHoCH against the weekly bias, I step aside.
Step 3: Mark the order block
On the 4H chart, identify the most recent order block in the direction of the daily BOS. Mark the zone. Check whether an FVG sits inside it, the preferred entry zone when both levels align.
Step 4: Wait for the 1H CHoCH
When price pulls back into the 4H order block, drop to 1H and wait. The first higher high after a series of lower lows during the pullback is the entry trigger.
Step 5: Manage the trade
Enter at the 50% level of the order block zone. Stop loss below the zone’s candle body. Initial target: the next major liquidity level (prior swing high for longs, prior swing low for shorts). Move stop to breakeven after 1:1 R:R is hit.
This process takes 15 to 20 minutes per session at the London open. The Fibonacci discount zone entry, which waits for price to retrace to the 62 to 79% level of a prior bullish impulse before entering, maps directly onto ICT order block logic. The Fibonacci trading guide covers how that confluence works in practice.
What Makes ICT Difficult
ICT has a learning curve that most trading methods don’t require. The framework is internally consistent and detailed, but it introduces significant naming overhead: premium and discount, equilibrium, draw on liquidity, market structure shift. The terminology isn’t the core obstacle. The real challenge is operating on multiple timeframes simultaneously without a clear hierarchy. New traders frequently jump between timeframes reactively rather than following the top-down process.
Order block identification has a subjective element. Two traders can look at the same chart and mark different candles. The rule I use: the body of the last candle before the impulse, not any candle in the sequence preceding it. Tighter definition produces more consistent results across traders applying the same chart.
ICT works best in trending, liquid markets. On thin pairs or during the quiet Asian session, the concepts lose structure. I stopped applying ICT to GBP crosses outside London and New York hours. EUR/USD and XAU/USD during active sessions give the cleanest reads.
Common Mistakes to Avoid
Trading against the higher timeframe trend. ICT concepts work in the direction of institutional flow. A clean 4H order block in a bearish weekly structure is a low-probability long entry regardless of how good it looks at lower timeframes. Always start with the weekly.
Entering without CHoCH confirmation. Entering into a pullback before the 1H CHoCH means buying before the retracement is confirmed exhausted. The confirmation costs a few pips, but it filters a significant portion of false entries.
Treating FVGs as automatic support or resistance. Fair value gaps are probabilistic. Price fills them more often than not, but that alone isn’t a strategy. FVGs inside an order block, aligned with higher timeframe structure, carry real edge. Standalone FVGs on a 5-minute chart don’t.
Ignoring macro calendar events. Liquidity grabs during news releases can look like ICT setups but are often algorithmic stop-hunting on compressed timeframes, not institutional positioning. Filter out all setups within 30 minutes of FOMC, NFP, or CPI announcements.
Over-trading lower timeframes. ICT concepts can technically be applied on 1-minute charts. In practice, signal quality degrades sharply below 15 minutes. Signal count increases, quality drops, and execution becomes reactive rather than planned. For most retail traders, 1H is the lowest reliable entry timeframe.
Broker Execution for ICT Setups
ICT entries target specific zone levels (order block midpoints, FVG boundaries) with stops defined below candle bodies. Spread at entry matters. A 2-pip spread on entry shifts your effective stop risk by 10 to 15% on a tight zone setup.
Consistent results require platforms where EUR/USD spreads stay below 1.0 pip during London session and limit orders fill without slippage on 4H closes.
I’ve had traders in our community run these setups effectively using Vantage for ICT entries. Their ECN accounts on EUR/USD run raw spreads plus commission, which makes the order block entry cost calculable before you place the order. For ICT-style zone entries where the R:R is predefined, knowing your exact spread cost in advance removes one variable from the trade plan.
FAQ
What does ICT stand for in trading?
Is ICT trading profitable for retail traders?
What markets work best for ICT trading?
How is ICT different from standard support and resistance?
What timeframes should I use for ICT trading?
What is the difference between BOS and CHoCH in ICT?
How long does it take to learn ICT trading?
🌍 Our recommended brokers
Reader Reviews
I spent two years studying ICT before this guide gave me the missing piece on draw on liquidity. I understood order blocks and FVGs but kept entering against the higher timeframe direction without a framework for why. The DOL concept changed that completely. On XAU/USD, identifying where weekly price was being pulled before marking any 4H setups increased my trade quality significantly. Out of 18 setups over the past four months where weekly DOL aligned with my 4H order block, 13 reached the target. The three setups I took against weekly DOL all failed. Removing counter-DOL trades entirely and running only aligned setups moved monthly returns from 5.1% to 7.8%. The top-down sequence described here is the actual framework that makes ICT work in practice, not just in theory.
The CHoCH filter made a direct difference on my first live ICT week. I was entering as soon as price touched the order block, getting stopped out on continued pullbacks before the real move started. Switching to waiting for the 1H CHoCH confirmation eliminated most of those false entries. Wanted more detail on handling CHoCH failures during news-driven volatility.
The liquidity sweep entry pattern described here is the most reliable ICT setup in my live trading over the past six months. I had struggled with standard order block entries because the entries often came before the sweep, putting me in positions that hit stop loss when price collected liquidity above my entry. Understanding that price deliberately engineers those sweeps before reversing changed my entry timing completely. I now wait for the sweep to complete and the rejection candle to close before entering. On EUR/USD and XAU/USD, sweep-and-reverse entries from a confirmed order block zone averaged 71% win rate across 22 setups this quarter. Monthly returns since adopting this pattern have averaged 8.1%. The GBP/JPY tracking data in the guide closely matches my own independent results, which gave me confidence the edge is consistent.
The order block identification rules finally gave me a clear system after months of marking zones inconsistently. I had been drawing S&R from wick tips, which meant my zones shifted every time I reopened the chart. Switching to the last candle body before an impulse gave me fixed, reproducible levels. Ran this on GBP/USD daily for six weeks - the first three untouched order blocks I traded all held on retest, two producing over 2:1 R:R. Monthly return in that period averaged 7.2%.
The order block consumption concept fixed a mistake that had cost me multiple trades. I had been treating previously-retested order blocks as valid zones for second entries, using the same level twice. Price rejected weakly on the second visit each time, and I attributed it to bad luck rather than the underlying rule. After reading the explanation that order blocks lose significance after the first successful retest, I stopped using them a second time entirely. The difference in trade quality was immediate. My next 12 order block entries were all fresh zones - 9 reached at least 1:1 R:R, 7 reached 2:1. Monthly performance has settled at 6.4% on average over the past three months. The guide works best for traders who already have basic higher timeframe structure in place - the ICT content builds on that foundation.
The calendar filter for news events saved my first NFP week applying ICT. Had a clean GBP/USD liquidity sweep setup forming 20 minutes before the release and skipped it per the guide. Price spiked 80 pips in both directions during the announcement, which would have stopped out any zone-based entry placed before the number. The 30-minute buffer rule is simple and effective.
The multi-timeframe hierarchy section clarified something I could not get from other ICT resources. I had the individual concepts but was applying them without a consistent top-down process, which meant I was sometimes trading a 4H order block with no idea whether the weekly structure was bullish or bearish. Running the full weekly-to-daily-to-4H-to-1H sequence before each session gave my setups immediate structural context. Win rate on EUR/USD setups using the full hierarchy averaged 64% over the past two months, versus 48% when I was using the concepts without the process. Returned 7.4% in month one, 6.8% in month two.
The fair value gap nested inside an order block is the highest-probability ICT entry I have found after ten months of testing. Standalone FVGs on lower timeframes gave inconsistent results - fills happened but continuations were unreliable. Once I required the FVG to sit inside a 4H or daily order block, the continuation rate improved substantially. The FVG-plus-OB combination on EUR/USD averaged 6.9% monthly over the past two months. Missing a section on managing positions when price only partially fills the FVG before reversing - that scenario needed more coverage.
Leave a Review

Forex Analyst & Senior Trader
Former FX desk trader with 8 years in institutional forex. Works in multi-timeframe analysis and order flow, turning desk experience into systematic, testable rules across forex and metals.