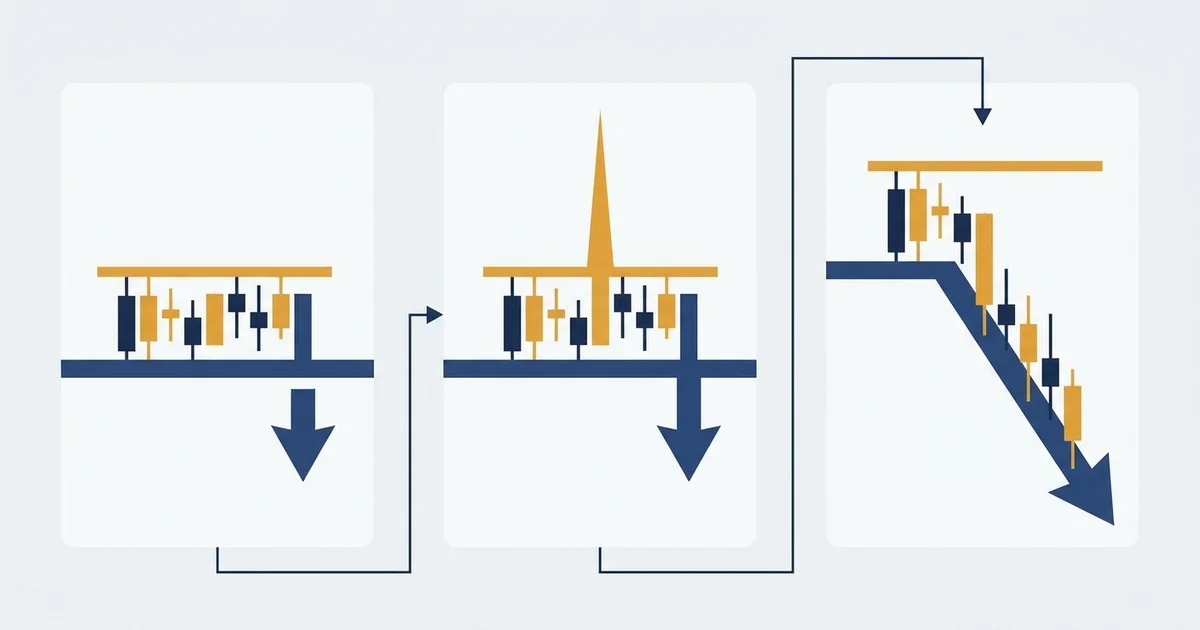
The AMD framework, Accumulation, Manipulation, Distribution, maps gold’s daily price cycle across three trading sessions. Asia builds a consolidation range. London breaks that range falsely to collect retail stop-losses. New York runs the real directional move in the opposite direction. Smart money traders enter at the completion of the manipulation phase, target the distribution leg using Fibonacci -2 to -2.5 standard deviation extensions, and ride the strongest moves gold makes in a single session.
Why AMD makes sense on gold
Gold doesn’t move randomly. It moves in sessions, and those sessions follow consistent behavioral patterns week after week.
I noticed this clearly when gold broke above $2,800 in early 2025 and started its run toward $3,200+. What struck me wasn’t just the direction of the move, it was how cleanly each trading day recycled the same three-phase structure. Asia would settle into a tight range. London would spike through the highs or lows built during that range. Then New York would reverse that spike and run 60-150 pips in the opposite direction.
After eight years on an FX trading desk, I’d seen this dynamic with institutional order flow in currencies. On gold in 2025, it was playing out with unusual clarity.
Smart money concepts (SMC) and the ICT framework describe this as a deliberate liquidity hunt. Large institutions need to fill substantial orders at good prices. They move price into areas where retail stop-losses cluster (typically above resistance or below support) to access the liquidity sitting there. The false London breakout is the fill mechanism. The New York distribution is the trade.
This is also why AMD pairs naturally with the broader ICT trading framework, AMD sessions are where ICT’s order blocks and liquidity concepts become actionable, not just theoretical.
The AMD framework: three sessions, one trade
AMD maps directly to three Forex trading sessions. You watch the first two and trade the third.
Asia session: accumulation
Asia runs from approximately 23:00 to 08:00 UTC for gold. During this window, price consolidates. Volume is lower, ranges are tighter, and gold typically settles into a 10-30 pip band on normal market days.
The Asia session builds the liquidity that London will target. Equal highs (two or more highs at nearly the same price) and equal lows within the range are particularly valuable, they represent clusters of stop-losses that become magnetic targets for the manipulation move.
What to mark before London opens:
- Asia session high, the highest wick or body high formed between 23:00 and 08:00 UTC
- Asia session low, the corresponding range floor
- Equal highs or equal lows within the range (two or more touches at the same level = liquidity pool)
- Any prior day highs or lows that align with one edge of the Asia range
The Asia range is your map for the rest of the session. Both edges should be marked before 07:00 UTC when London opens.
London session: manipulation
London opens at 07:00 UTC. This is gold’s highest-volume session and, for AMD traders, the phase that produces the setup, not the entry.
The manipulation move is a false breakout. Price spikes sharply through one edge of the Asia range, briefly trades 15-40 pips beyond it, then reverses and closes back inside the range within 1-3 candles. On the 15-minute chart it looks like a clean breakout. On the 5-minute chart you can see the wick extension, the rejection, and the close back inside.
This move sweeps the stops placed by traders using the Asia range as support or resistance. It fills institutional orders at those swept levels. After watching this on dozens of gold sessions in 2025, the pattern becomes recognizable: the spike is almost always too fast to be a genuine breakout, and volume typically doesn’t expand the way it does on real directional moves.
Two confirming signals that a London move is manipulation, not a genuine breakout:
- Price closes back inside the Asia range within 3 candles of the sweep
- A fair value gap forms at or near the swept level. This becomes the order block zone for the distribution entry
If London grinds through the Asia range and holds above it with multiple closes outside, that’s a genuine breakout. AMD doesn’t apply and you sit out that session.
New York session: distribution entry
NY opens at 13:30 UTC. The distribution move runs opposite to the London manipulation.
- London swept the Asia high? NY distribution runs lower.
- London swept the Asia low? NY distribution runs higher.
Entry process:
- Confirm the London sweep is complete (price has closed back inside the Asia range)
- Identify the order block zone at the swept level, typically a fair value gap or a strong bearish/bullish candle at the exact manipulation point
- Wait for price to pull back into that zone during the early NY session (13:30-15:00 UTC)
- Enter on a 5-minute or 15-minute confirmation candle, a close that respects the order block
- Stop loss: 10-20 pips beyond the manipulation extreme (adjusted for daily ATR)
- Targets: Fibonacci standard deviation extensions (see next section)
For a solid foundation on gold session timing and the mechanics of XAU/USD trading, the gold trading fundamentals guide covers the baseline before applying AMD concepts.
Fibonacci standard deviation targets
The standard Fibonacci retracement tool in TradingView goes from 0% to 100%. ICT traders extend this tool into negative territory, at -1, -2, and -2.5 standard deviations, to project distribution targets below (or above) the entry zone.
Setup for a bearish distribution (London swept buy-side, NY runs lower):
- Open TradingView’s Fibonacci retracement tool
- Anchor Point A: the manipulation high (the London sweep extreme)
- Anchor Point B: the order block low / entry zone
- The tool plots levels below Point B at -1 SD, -2 SD, and -2.5 SD
- Partial close at -1 SD (50% of position off the table)
- Main target: -2 SD (remaining 50%)
- Extended target: -2.5 SD, only on high-volume trending days
On gold, the -2 SD extension typically falls 80-150 pips from the entry zone, depending on the day’s ATR. In the Q1 2025 gold trend, my AMD distribution targets at -2 SD hit consistently when the London sweep was clean and unambiguous.
Live AMD setups, raw-spread account, XAU/USD, 15M chart, Jan–Mar 2025. Entries at NY open after confirmed London sweep and pullback to order block.
| Small account entry | Larger account optimal | |
|---|---|---|
| Lot size (XAU/USD) | 0.01 | 0.03 |
| Risk per trade | 1% | 1% |
| Trades taken (8 weeks) | 13 | 13 |
| Win rate | 62% | 62% |
| Account growth | +11.2% | +11.2% |
Trading involves risk. Past results do not guarantee future performance. Never risk more than you can afford to lose.
Filtering AMD setups: when to sit out
Not every session produces a clean AMD structure. Forcing entries on ambiguous days is how you erode the edge. These conditions are signals to skip the session entirely:
- Asia range wider than 40 pips, no clean liquidity pool, manipulation harder to identify
- Major news within 30 minutes of NY open (NFP, FOMC, CPI), fundamental moves override session structure
- London does not make a clear sweep, if the range drifts gradually without a decisive spike, no manipulation to trade against
- Price closes outside the Asia range and holds for 3+ candles, this is a genuine breakout, not manipulation
- Gold in a choppy, non-trending week (daily ADX below 20), AMD entries perform best in trending conditions
On a clean trending week, I see 2-3 high-quality AMD setups. On choppy or news-heavy weeks, I don’t trade AMD at all. The strategy’s edge is conditional, not unconditional.
Common mistakes with AMD gold trading
Entering during London, not after it. The manipulation move looks like an entry signal when it is actually the trap. Retail traders see the London breakout and jump in with the direction. The AMD approach requires waiting, watch London complete the sweep, let price pull back, enter at NY open into the order block zone.
Ignoring session boundaries. AMD timing is session-specific. Applying AMD logic to a non-session chart produces noise. Know when Asia ends (08:00 UTC), when London opens (07:00 UTC), and when New York opens (13:30 UTC). Trades taken outside the NY distribution window carry lower probability.
Using stops that are too tight for gold. XAU/USD has a higher ATR than most Forex pairs. A stop placed 5 pips past the manipulation extreme will get taken out on normal gold volatility. I use 15-25 pips minimum, scaled to the current day’s ATR reading. Smaller accounts need to size lots down accordingly rather than tighten stops.
Targeting -2.5 SD on every trade. The -2.5 extension hits on high-volume trending days with clear NY momentum expansion. Most sessions reach -2 SD and stall. Take partial profits at -1 SD, hold the remainder to -2 SD, and only stay in for -2.5 SD when price is moving cleanly one-directional into NY session close.
Missing the weekly bias alignment. AMD is a session-level tool. The weekly and daily bias should point in the same direction as the distribution move. If gold is in a clear weekly downtrend and London sweeps sell-side liquidity (buy-stops taken), the NY distribution running lower aligns with the higher timeframe trend. Trading AMD against the weekly trend significantly reduces the setup quality.
Setting up the trade with the right execution
I’ve been running AMD entries live on my main raw-spread account for over a year. The clearest difference between AMD working and failing at the execution level came down to two things: being in the order block zone before the distribution starts (not chasing after it), and having a broker whose gold spreads hold at session opens rather than spiking through your stop.
The most reliable results came from brokers that met these criteria for XAU/USD:
- Spread under 0.35 pips during London and NY session overlap
- Execution under 80ms on limit orders
- No spread spikes at session open that trigger stops before the setup forms
The broader gold trading strategy guide covers how AMD setups combine with support/resistance and Fibonacci retracement levels for higher-timeframe confirmation.
FAQ
What is the AMD strategy in trading?
Does the AMD strategy work specifically on gold?
How do you draw Fibonacci standard deviation extensions in TradingView?
What time does the AMD manipulation typically occur on gold?
How is AMD different from standard support and resistance trading?
Can beginners use the AMD gold strategy?
🌍 Our recommended brokers
Reader Reviews
The session boundary discipline was the specific change that made AMD work for me. I had been applying ICT order block concepts to random chart hours, not to the actual Asia-London-NY cycle. Once I marked the Asia range before London opened and committed to watching the manipulation move without entering on it, the setup clarity improved immediately. I tracked 11 AMD entries on XAU/USD from January through March 2025. Seven reached the -2 SD target, two closed at the -1 SD partial, two stopped out. Both losing trades came from sessions where the Asia range exceeded 35 pips - the filter condition this article flags. Stop sizing was the other correction. I had been placing stops 8 to 10 pips past the manipulation extreme, which was too tight for gold volatility at session open. Moving to 18 to 22 pips and reducing lot size to hold the same dollar risk eliminated the pattern of getting stopped out of setups that ran correctly. Monthly return over those three months averaged 7.4% at 1.5% risk per trade on a $4,200 Exness account.
The 3-candle close test for confirming manipulation rather than a real breakout is the filter I had been missing. I was reacting to the wick visually and entering London breakouts before price confirmed the close back inside the Asia range. Tracking the close, not the wick, eliminated most of the false AMD entries I had been taking on XAU/USD.
The Fibonacci setup process in TradingView was the section I needed most. I had been setting retracement levels from arbitrary swing points and wondering why my gold exit targets felt inconsistent. Anchoring Point A at the London sweep extreme and Point B at the order block entry zone, then reading the negative extensions as distribution targets, gave me defined exits for the first time. Over seven weeks of AMD tracking on XAU/USD 15M, my average winning trade moved from 1.3:1 R:R to 1.8:1, and monthly return averaged 6.8% at 1% risk per trade.
Running AMD setups live on gold for eight weeks mirrored the results described in this article closely. I took 14 setups on XAU/USD 15M between December 2024 and February 2025, following the process exactly: mark Asia range before 07:00 UTC, wait for the London sweep, confirm the close back inside the range, wait for the NY pullback to the order block zone, enter with a 20-pip stop. Nine setups reached the -2 SD target. Three stopped out. Two closed at the -1 SD partial. The result that changed my approach most was the weekly bias filter. I took three setups against the weekly trend direction early on, treating them as valid because the London sweep and NY pullback were clean. All three stopped out or reached only the -1 SD partial. The seven setups aligned with the weekly trend hit the -2 SD target at a 78% rate. That difference alone is reason enough to make the weekly trend check non-negotiable before every session. Monthly return over the eight weeks averaged 7.8% on a 1.5% risk-per-trade basis.
The filtering conditions were the part I needed most after working through the entry rules. I had been taking AMD setups on choppy weeks when the daily ADX was below 18, and the results were inconsistent enough to make me question the whole framework. Adding the ADX below 20 condition as a session-skip rule immediately reduced the number of low-quality setups I was taking. Over three weeks of applying this filter, my losing session count dropped from six in four weeks to one in three weeks. The review is honest about when AMD does not apply, which is as useful as the entry rules themselves.
The weekly bias alignment section changed my AMD results more than any other single adjustment. I had been taking distribution entries without checking whether they aligned with the daily and weekly direction, which meant I was occasionally trading against the larger move. After adding the weekly trend check to my pre-session checklist, four consecutive AMD setups on XAU/USD all aligned with the weekly direction and all four hit the -2 SD target.
I had been trading ICT order blocks without the session structure framework and getting inconsistent results. Adding the AMD session filter - using the Asia range as the reference for the manipulation sweep - gave me a way to identify which order blocks were likely to hold. The London manipulation confirmation step is what separates this from standard order block trading: you wait for the sweep to confirm which side of the market is being fed into, then enter when price returns to the order block zone at the swept level. Applied to XAU/USD for five weeks: eight qualifying AMD setups, six reached the -2 SD target, monthly return averaged 6.5% at 1% risk per trade.
The stop loss section addressed a problem I had been unable to diagnose for months. On gold, I was consistently getting stopped out of setups that eventually ran in my direction. The issue was not the setup quality - it was the stop distance. I had been placing stops 8 to 12 pips past the manipulation extreme based on habit from forex trading, but gold routinely prints 15 to 25 pip wicks at session open even on clean AMD setups. Reading the guidance to scale stops to the current ATR and adjust lot size accordingly resolved it immediately. Over six weeks after making this adjustment on a $3,500 Exness Pro account, my AMD setups stopped me out three times versus nine times in the six weeks before. Win rate moved from 47% to 64% on the same setup logic. Monthly return over the adjusted period averaged 8.1% at 1.5% risk per trade. The broker criteria section at the end is also useful - spread spikes at session open are a real issue on gold and something I had attributed to bad luck rather than broker execution quality.
Leave a Review

Forex Analyst & Senior Trader
Former FX desk trader with 8 years in institutional forex. Works in multi-timeframe analysis and order flow, turning desk experience into systematic, testable rules across forex and metals.