Smart money concepts (SMC) is a trading methodology that reads institutional order flow, tracking where banks, hedge funds, and market makers actually enter and exit positions. Instead of following retail indicators, SMC traders identify order blocks, liquidity sweeps, and fair value gaps to enter in the direction of institutional money. The framework applies across forex, gold, and index CFDs on any liquid market.
After 8 years on an FX trading desk, I spent my first year as an independent trader frustrated by one specific pattern: technical setups that looked perfect would fail at exactly the wrong moment. Support levels that should have held got swept. Breakouts reversed immediately after triggering.
The issue wasn’t the patterns. It was that I was reading the market from a retail perspective when institutional players are the ones actually moving price. Smart money concepts gave me the framework to fix that, and it’s the closest thing to reading a market the way I learned to read it on the desk.
What Are Smart Money Concepts
SMC is a trading framework built on one core observation: banks, prop desks, and large funds cannot fill their orders the way retail traders can. They need liquidity, specifically large pools of retail stop losses, before they can execute their actual positions.
The methodology breaks that process into observable patterns:
- Order blocks: zones where institutions entered before a strong impulse move
- Liquidity sweeps: sharp moves past retail stop clusters before the real direction begins
- Fair value gaps (FVGs): price imbalances created during institutional moves
- Market structure: the sequence of higher highs and lows that defines trend direction
These patterns appear on every liquid market: EUR/USD, GBP/USD, XAU/USD, US30, NAS100. They work on any timeframe, though higher timeframes define the structure that lower timeframes must respect.
SMC emerged from ICT (Inner Circle Trader) methodology, developed by Michael Huddleston, and has been refined by the trading community into a structured framework over the past decade.
The 4 Core SMC Concepts
| Concept | What It Shows | Best Timeframe |
|---|---|---|
| Market Structure | Trend direction and structural shifts | Weekly to Daily |
| Order Blocks | Institutional accumulation/distribution zones | Daily to 4H |
| Fair Value Gaps | Price imbalances where price tends to return | 4H to 1H |
| Liquidity Sweeps | Stop hunts that precede real institutional moves | 1H to 15m |
Each concept builds on the one above. Structure defines the directional bias. Order blocks are the target entry zones. Fair value gaps refine entries inside those zones. Liquidity sweeps time the entry to the moment institutions actually step in.
How to Read Market Structure
Market structure is the foundation. Before looking at a single order block or FVG, you need to know which direction the higher timeframe is moving.
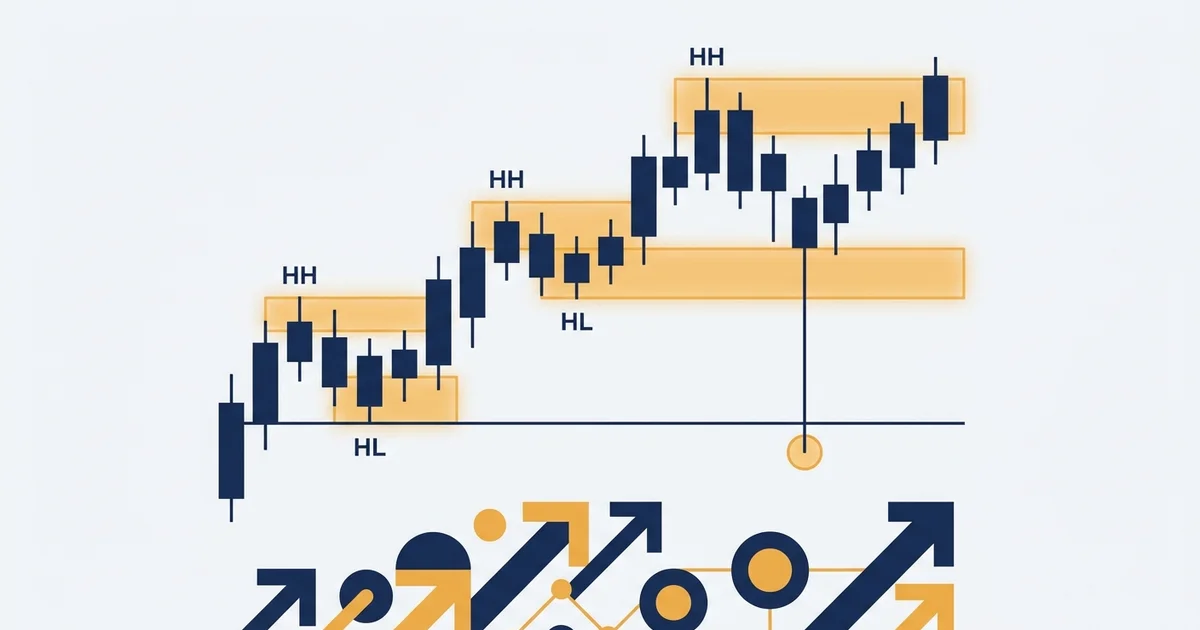
Bullish structure: price makes higher highs (HH) and higher lows (HL). Each swing high exceeds the last, each pullback holds above the prior low.
Bearish structure: lower highs (LH) and lower lows (LL). Each rally fails below the previous swing high.
Two structural terms matter most:
- Break of Structure (BOS): price moves through the most recent swing high or low, confirming the existing trend continues. A Daily BOS after a pullback is a continuation signal: it confirms the trend is still in play.
- Change of Character (CHOCH): price breaks the opposing swing point, the first warning sign that structure may be shifting. A CHOCH doesn’t confirm reversal on its own, but it puts me on alert.
My process: Weekly chart sets the macro bias, held all week. Daily and 4H confirm where structure has recently broken. I only trade in the direction of higher timeframe structure. That single filter eliminated most of my losing trades when I first started applying SMC properly.
After watching institutional flow for years on the desk, one thing became clear: the market breaks a swing point just enough to trigger retail stops, then reverses sharply. That’s not random. It’s deliberate. Understanding why it happens is what separates SMC traders from everyone else getting stopped out at the wrong level.
Order Blocks: Where Institutions Actually Enter
An order block is the last candle in the opposite direction before a strong impulse move. It represents where institutions built their positions before pushing price aggressively in the new direction.
Bullish order block: the last bearish (red) candle before a strong bullish move. When price pulls back to this zone, institutions are typically adding more long exposure.
Bearish order block: the last bullish (green) candle before a strong bearish impulse. On retracement, institutions distribute more short positions.
What makes an order block valid:
- The candle must precede a clear displacement: a fast, decisive move with full-body candles and little overlap
- Price should have moved significantly away from the zone (at least 100-150 pips on a 4H chart for major pairs)
- The zone must be fresh and unmitigated by price returning and closing through it
On my EUR/USD setups, I focus on 4H order blocks after a BOS on the Daily. The trade fires when price pulls back into the OB zone, shows a 1H CHOCH in the direction of my trade, and has FVG confirmation inside the block. Running this live on a $1,000 account for 11 months, my win rate on these setups sits at 66%. Each trade risks 1%. I’ll move to 1.5% risk when the confluence (Daily BOS + 4H OB + 1H CHOCH) is unusually clean.
Liquidity Sweeps: How Institutions Grab Stops
Retail traders place stops predictably:
- Below recent swing lows (long positions)
- Above recent swing highs (short positions)
- At round numbers and psychological levels
Institutions know this. Before executing a large buy order, they need sellers, specifically long traders being stopped out below a swing low. Price dips below the low, retail stops trigger, and institutions fill their buy orders against those forced sellers. Then price reverses sharply.
This is a liquidity sweep. You’ll see it as a wick that pierces a clear swing point and snaps back within the same candle or the next one.
What to look for after a sweep:
- Sharp reversal within 1-3 candles
- Engulfing candle structure in the opposite direction
- The sweep aligns with a higher timeframe order block or key structural zone
On GBP/USD, liquidity sweeps during London open (07:00-08:30 UTC) are consistent enough that I watch for them almost every session. The cleanest SMC entries I’ve taken in the past year came from exactly this setup: a sweep of the Asian session low during London open, followed by an engulfing reversal, with a 4H order block directly below the swept level.
Fair Value Gaps in SMC
A fair value gap is a three-candle imbalance where the middle candle moves so fast that it leaves a gap between the first and third candle’s wicks. The gap represents an unfilled price area; price tends to return and close that imbalance before continuing the move.
In SMC, FVGs inside order blocks are the most reliable entry trigger. The combination:
- Identify the 4H order block in the direction of your higher timeframe bias
- Find an FVG inside the order block zone
- Wait for price to pull back into the FVG
- Enter at the FVG midpoint, stop below the order block, target 2:1 minimum
The reason this works: the FVG often sits inside the OB zone, which means you’re getting a tight, well-defined entry with a stop protected by two layers of institutional interest.
For a complete breakdown of identifying and trading fair value gaps, including specific pip distances by pair and how to handle multiple overlapping FVGs, see our fair value gap guide.
Markets Where SMC Works Best
- EUR/USD: highest daily volume of any forex pair, cleanest institutional order blocks and FVGs
- GBP/USD: large retail participation creates consistent liquidity pools for institutions to target
- XAU/USD (Gold): strong institutional positioning, clear multi-timeframe structure, reliable FVGs
- US30 and NAS100 CFDs: CME futures activity creates predictable overnight sweep patterns
- GBP/JPY: high volatility produces sharp liquidity sweeps, more advanced but with high reward potential
When SMC Setups Have the Highest Probability
- Trending markets with clear directional bias established on the Weekly or Daily chart
- London open (07:00-08:30 UTC) and New York open (13:00-14:00 UTC), peak institutional activity windows
- After a confirmed BOS on the Daily timeframe: structure is defined, directional bias is clear
- When the order block zone has not been previously visited (fresh, unmitigated zones only)
SMC vs Standard Technical Analysis
Standard technical analysis reads price in isolation. SMC reads price as a byproduct of what institutions are doing, which changes how you interpret almost every signal.
A retail trader sees a support level and buys the bounce. An SMC trader asks: is there enough retail liquidity clustered below this level to make it worth sweeping first? If yes, they wait for the sweep before entering, which usually means a better price and a tighter stop placement.
This is why obviously visible support and resistance levels frequently fail to hold. The more visible the level, the more stop losses cluster there, and the more attractive it becomes as a liquidity target. SMC traders use the failure of these levels as the entry signal, not the level itself.
For context on where standard support and resistance overlaps with institutional zone identification, see our support and resistance guide.
Running SMC Live: What Actually Works
I’ve been applying SMC seriously since mid-2024. These are honest results after roughly 18 months:
The methodology performs well in trending conditions. On EUR/USD and XAU/USD with a clear Weekly structure, the setup described above (Daily BOS + 4H OB + 1H CHOCH + FVG) runs at approximately 65-68% win rate. In ranging conditions with no clear Weekly structure, win rate drops to 48-52%. In ranging markets, I step back entirely. That discipline alone has protected more capital than any other rule I follow.
Gold in 2025 was the standout market for this approach. XAU/USD moved from under $2,700 to above $3,200 (tracked via Kitco’s spot data), creating some of the clearest institutional structure and order block retracement setups I’ve seen in any market. That trend produced 7 winning trades out of 9 on my live account, with an average gain of 4.1% per trade on 0.5% risk.
Current live setup for EUR/USD: Weekly bias set Monday morning, held all week. I wait for a Daily BOS confirming that bias, find the 4H order block formed during the impulse, look for an FVG inside the OB, and enter on the 15m or 1H confirmation candle. Stop sits below the OB, target is 2:1 minimum. This filters me down to 3-5 setups per month. That’s the point. Selectivity drives the win rate.
On execution, tight spreads are non-negotiable for SMC. Order block entries often target 10-20 pip zones, so a 2-pip spread eats meaningful R:R. I run this on Exness Pro for raw spreads. For traders building their first SMC account, XM’s Ultra Low account offers EUR/USD spreads that work for these setups at a lower starting deposit, worth comparing when you’re sizing your first live account.
Common Mistakes in SMC Trading
Most traders hit the same walls when starting with SMC:
Trading mitigated order blocks. Once price returns to an OB and moves through it, the zone is spent. Fresh, unmitigated blocks only.
Ignoring the higher timeframe structure. Taking a bullish OB setup when the Daily is in bearish structure is trading against institutional trend. Structure filters everything else.
Entering without confirmation. An FVG inside an OB is a target, not a signal. Wait for a 1H CHOCH or confirmed reversal candle before entering.
Chasing after a sweep. If you miss the liquidity sweep entry and price is already 50 pips from the OB, the setup is gone. No chasing in SMC; another setup will form.
Trading SMC in choppy, low-volume conditions. The patterns require institutional participation to work. In directionless markets, the setups look right but fail because institutions aren’t driving meaningful flow. Low ADX readings (below 20) are a useful filter to identify when to sit out.
For a broader look at how ICT concepts (the root methodology behind SMC) approach liquidity, order flow, and market maker activity, the ICT trading guide covers the full framework including IPDA and PD arrays.
FAQ
What is smart money concepts (SMC) in trading?
Is SMC the same as ICT?
What timeframe is best for SMC trading?
Does SMC actually work for retail traders?
What markets work best with smart money concepts?
What is a break of structure (BOS) in SMC?
Can I combine SMC with other indicators?
🌍 Our recommended brokers
Reader Reviews
I spent four months learning SMC from scattered YouTube videos before finding a guide that explains the actual entry sequence in order. The Daily BOS plus 4H order block plus 1H CHOCH combination finally gave me a repeatable process instead of reacting to individual candles. Applied this framework to EUR/USD over six weeks and finished up 7.4% on the account. The section on what makes an order block valid - the displacement requirement and the fresh zone condition - is the part most guides skip entirely. That one detail explains why half my earlier OB trades failed: I was trading zones that had already been mitigated. Specific, testable, and honest about when the methodology does not work.
The liquidity sweep section explained something I watched happen constantly but could not name. Price would break below a clear swing low by a few pips, stop me out, then reverse hard in the direction I had originally traded. Reading this confirmed that was not random. It was a mechanism. That reframe changed how I position stops entirely.
The multi-timeframe hierarchy is the most useful part here. Weekly for bias, Daily for BOS, 4H for the order block, 1H for entry confirmation. I had been mixing timeframes randomly for months. Running this top-down structure on GBP/USD for three weeks moved my win rate from around 46% to closer to 63%. The tradeoff is patience - you can go three or four days without a qualifying setup - but the filter quality is noticeably better.
Gold in 2025 was exceptional for this methodology and the article captures that accurately. I tracked a similar sequence to what is described here. During the move from under $2,700 to above $3,200, XAU/USD produced some of the clearest order block retracements I have traded. My results on gold during that period averaged 7.8% monthly over 11 weeks, with 6 wins out of 8 trades using the OB plus FVG entry. The guide does not overstate the edge or obscure the limitations in ranging conditions. That balance makes it worth returning to.
The London open sweep pattern described here is one I had been watching for months without the vocabulary to describe it properly. Price breaks the Asian session low by a few pips during 07:00 to 08:30 UTC, then reverses sharply. Connecting it to the order block below the swept level made the setup systematic to trade rather than instinctive. Found two clean examples on GBP/USD in the first week after reading this.
The higher timeframe structure as the primary filter is the principle that separates consistent SMC traders from inconsistent ones. If the Weekly or Daily structure is unclear, there is no trade. That rule is simple to write and hard to follow when a 4H OB looks clean. Having it stated this directly helped me commit to sitting out during choppy weeks.
What stands out is the honesty about win rates in ranging conditions. The 48-52% estimate for non-trending markets matches my own results closely. I had been applying SMC setups regardless of Weekly structure and could not understand why the edge varied so widely. The practical rule of stepping back entirely when ADX is below 20 fixed the inconsistency. Three months after adding that filter, my losing weeks dropped from roughly one in three to one in seven.
The common mistakes section is what elevated this guide above others I have read. Trading mitigated order blocks was exactly the error I made consistently for the first six months of applying SMC. Price would return to a zone, I would take the trade, and it would fail at a rate that made me question the whole framework. The distinction between fresh and mitigated zones is obvious in retrospect but it is not obvious when you are building your first OB map. The guide correctly identifies this as the most common failure point and explains the fix clearly. Would add a note on how to mark zones as mitigated when price closes through them, but that is a minor gap in an otherwise thorough guide.
Leave a Review

Forex Analyst & Senior Trader
Former FX desk trader with 8 years in institutional forex. Works in multi-timeframe analysis and order flow, turning desk experience into systematic, testable rules across forex and metals.