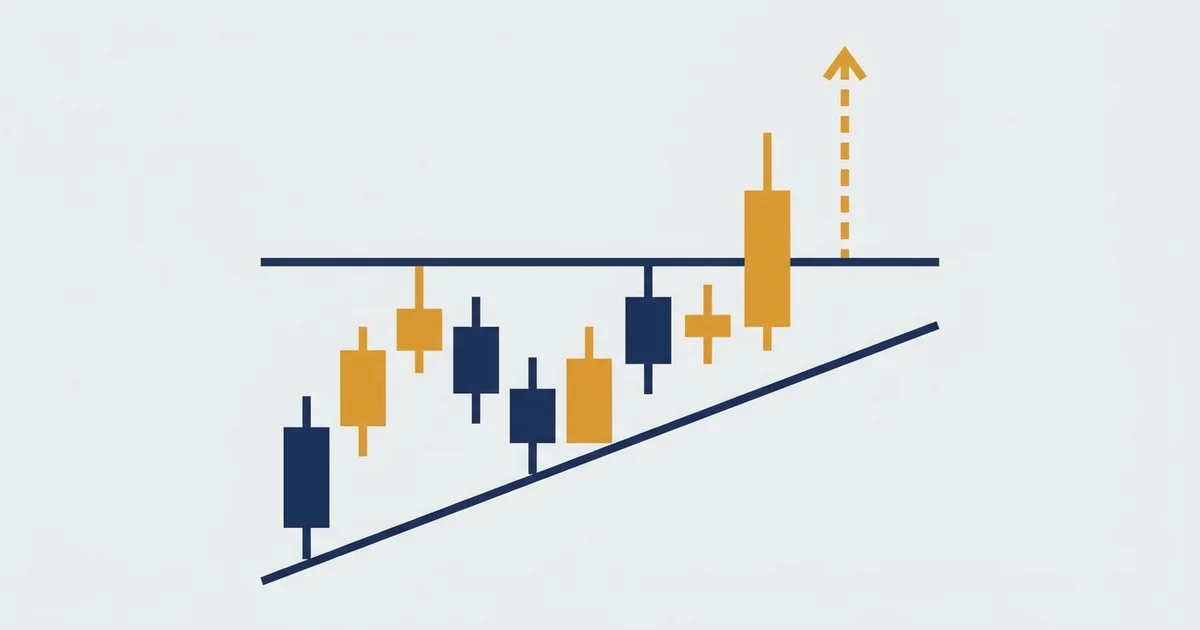

What the ascending triangle pattern looks like
Two lines do all the work here: a horizontal one on top and a sloping one underneath. Here is the shape on a daily chart of spot gold (XAU/USD).
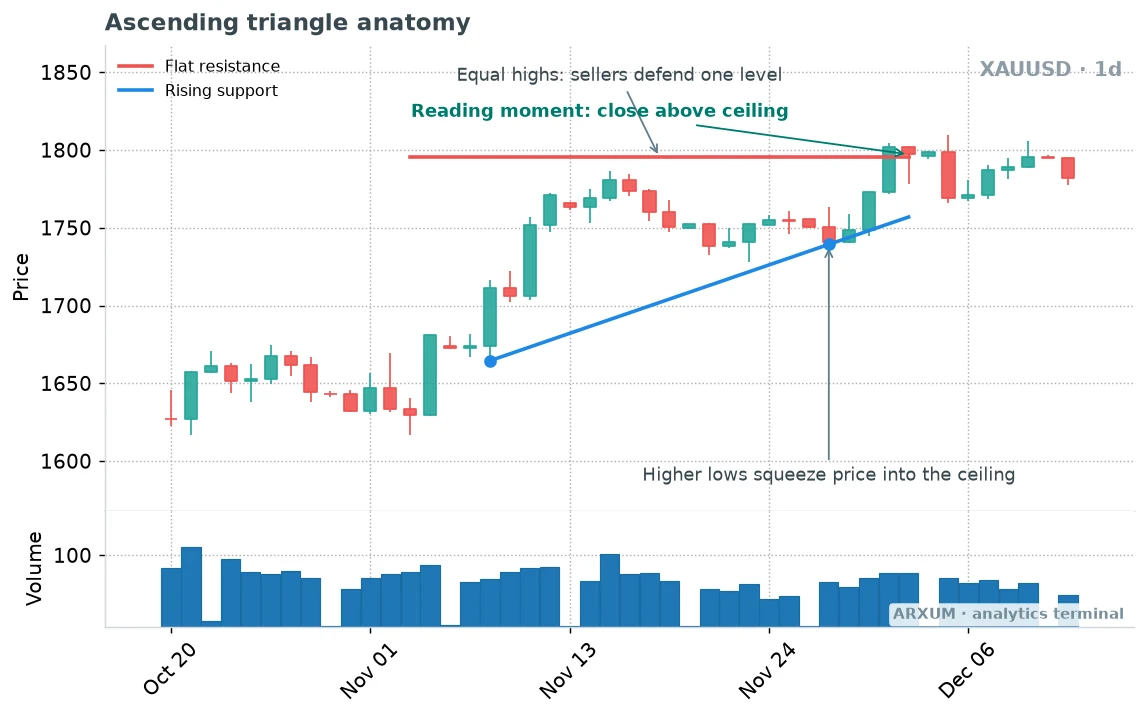
Now that the picture is on screen, each label maps to one job. Read them top to bottom.
- Flat resistance (red): the ceiling. Price ran into roughly the same level, around 1,796, several times and got pushed back.
- “Equal highs: sellers defend one level”: the tops line up flat because one group of sellers keeps unloading at that exact price.
- Rising support (blue): the floor, drawn through the swing lows. The first low sat near 1,665, the next one near 1,740.
- “Higher lows squeeze price into the ceiling”: every dip ends higher than the last. Buyers are getting impatient, and the room between the lines shrinks.
- “Reading moment: close above ceiling”: the first daily candle that closes above the red line. This is where the pattern says something, not before.
- XAUUSD · 1d: the instrument (gold priced in US dollars) and the timeframe, one candle per day.
- Volume panel: how active trading was on each candle. For gold and Forex, platforms show tick volume, a count of price updates, not money traded.
Look at what happened right after the reading moment on this chart. Gold closed above the ceiling, then slipped back under it for a few sessions and kept hugging the old line.
That is the honest picture of this pattern: the close above the ceiling starts the trade, it does not finish the argument.
The three parts, in one table
| Part | What it is | What to check |
| Ceiling | Flat resistance line | 2+ highs at one level |
| Floor | Rising support line | 2+ higher lows |
| Squeeze | The narrowing gap | Smaller candles, shallower dips |
| Breakout | Close above ceiling | A full body above, not a wick |
| Failure | Close back under ceiling | Or a close under the floor |
How to draw it so it holds up
- Draw the ceiling through the highs that cluster at one level. A few points of difference between them is fine; a staircase of rising highs is not.
- Draw the floor through swing lows, the actual turning points. Never fit a line through the middle of the candles.
- You need at least two touches on each line. Three on the ceiling makes it cleaner.
- Use the candle bodies or the wicks, but pick one and stick with it on both lines.
- If the floor is flat too, it is a range, not a triangle. If the ceiling slopes down, you are looking at a symmetrical triangle.
Is the ascending triangle bullish or bearish?
Mostly bullish. The flat ceiling with rising lows shows buyers absorbing supply at one price, and the usual resolution is up.
The context still decides how much that bias is worth.
| Context | Typical read | Trust level |
| Inside an uptrend | Continuation up | Highest |
| After a long decline | Possible bottom | Medium |
| Inside a downtrend | Often fails down | Low |
| Chop, no clear trend | Coin flip | Low |
- A close below the rising floor cancels the bullish read. That is a failed ascending triangle, and the drop that follows can be fast because buyers exit together.
- The quickest trend check is the 200-period EMA. An EMA (exponential moving average) is an average of recent closing prices that weights the newest ones most.
- On TradingView, add the built-in “Moving Average Exponential” and set the length to 200. Price above it means the bigger trend is up, which is the setting where this pattern is most trustworthy.
Ascending vs descending vs symmetrical
The ascending triangle has two siblings, and mixing them up is a common beginner slip.
| Pattern | Top line | Bottom line | Usual bias |
| Ascending | Flat | Rising | Bullish |
| Descending | Falling | Flat | Bearish |
| Symmetrical | Falling | Rising | Follows the trend |
- The descending triangle pattern is the mirror: a flat floor, lower highs, and a usual break down.
- Want to see how the three compare on real trade histories? Our full triangle study runs them side by side on gold, the majors and Bitcoin.
Three ways to trade the ascending triangle
Traders use the same shape in three different ways. Each one fits a different temperament and a different timeframe.
In the tables below, D1 means the daily chart, H4 the 4-hour, H1 the 1-hour and M15 the 15-minute chart. TF is short for timeframe.
| Method | You act when | Fits best |
| 1. Close-above breakout | A candle closes above | D1, gold, GBP/USD |
| 2. Retest entry | Price returns and holds | H4, EUR/USD, gold |
| 3. Failed-breakout read | The break slips back | M15 to H1, Bitcoin |
1. The close above the ceiling
This is the textbook method and the one most courses teach. You wait for a full candle to close above the flat resistance, then act on that close.
Go back to the gold daily anatomy chart above. The reading moment is exactly this trigger, one daily close above roughly 1,796.
How it looks when it is working:
- The squeeze is visible: candles get smaller as the floor rises toward the ceiling.
- The breakout candle has a solid body that closes clearly above the line, not just a wick poking through.
- The next one or two candles stay above the ceiling, or dip to it and close back above.
- On crypto, volume picks up on the break. On gold and Forex, tick volume is too noisy to lean on.
How it looks when it is not:
- The candle closes above, then the next few close back under the line, as gold did on the anatomy chart.
- Price stalls just above the ceiling for days with no follow-through.
| Role | How you use it | Best read |
| Entry trigger | Buy the close above | D1 gold, D1 GBP/USD |
| Trend read | Price above 200-EMA | D1 on every market |
| Confirming gauge | Next candle holds | D1, H4 |
| Filter | Skip in a downtrend | Any instrument |
| Exit cue | Close back under floor | Same TF as entry |
Rule of thumb: on the daily, wait for the close, never the intraday poke above the line.
The stop for this method goes under the last higher low on the floor. On the gold chart that was near 1,740, which leaves room for exactly the kind of wobble that followed.
2. The retest of the old ceiling
Some traders refuse to buy the first close. They wait for price to come back to the broken ceiling, check that the line now acts as a floor, and buy that hold.
Here is the pattern on a 4-hour chart of EUR/USD, where that return to the line shows up clearly.
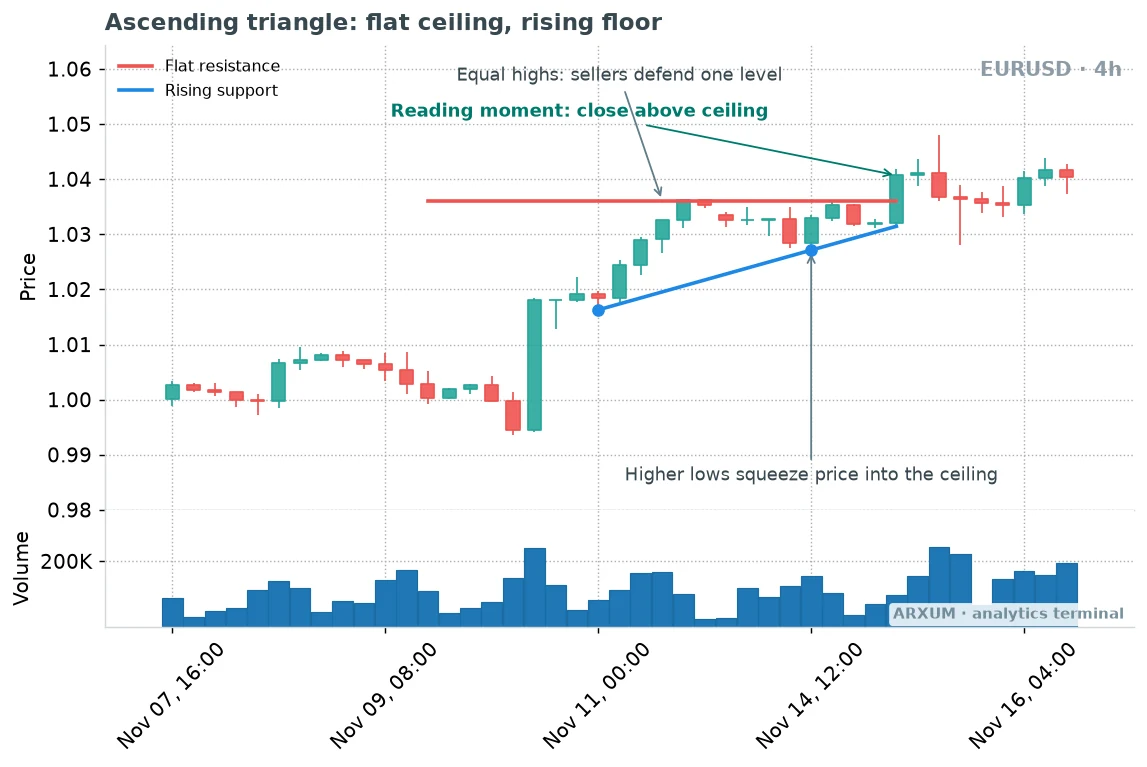
What the chart shows, step by step:
- Before the triangle, EUR/USD jumped from about 1.000 to 1.018 in one strong candle. That push is the trend the triangle sits inside.
- The ceiling formed near 1.036. Several highs stalled there.
- The floor rose from about 1.016 to 1.027, so each dip was shallower.
- A 4-hour candle then closed near 1.041, above the ceiling.
- Price dropped back toward 1.036 in the following candles. One wick dipped lower, but the closes held near the old ceiling.
- After that hold, the pair pushed back to around 1.040.
That pullback is the whole idea of method 2. The line that stopped buyers on the way up now catches price on the way down.
It is the classic role reversal in support and resistance.
| Role | How you use it | Best read |
| Setup alert | Close above ceiling | H4 EUR/USD, H4 gold |
| Entry trigger | Bullish close at the line | H4, H1 to fine-tune |
| Confirming gauge | Closes stay above | H4 |
| Filter | D1 trend is up | D1 200-EMA |
| Exit cue | 4H close back inside | H4 |
Trade-offs worth knowing before you choose it:
- You get a tighter stop, because it sits just under the retest low, not under the whole triangle.
- You miss the strongest breaks, because they never come back. That is the price of the better entry.
- Wicks below the line are normal on a retest. Judge the hold by the close, as the EUR/USD chart shows.
- On Forex, the 4-hour is the sweet spot. The 1-hour prints more retests, but many are just noise around the line.
Rule of thumb: if the break never comes back, let it go. Chasing it later turns a retest trade into a bad breakout trade.
3. The failed-breakout read
The third method is the one beginners skip, and it saves the most money.
It treats a break that slips back under the ceiling as information:
- For traders already in a buy, it is an exit signal.
- For others, it is a reason to stand aside or even sell.
Here is a 15-minute chart of Bitcoin (BTC/USDT) where the break did not hold.
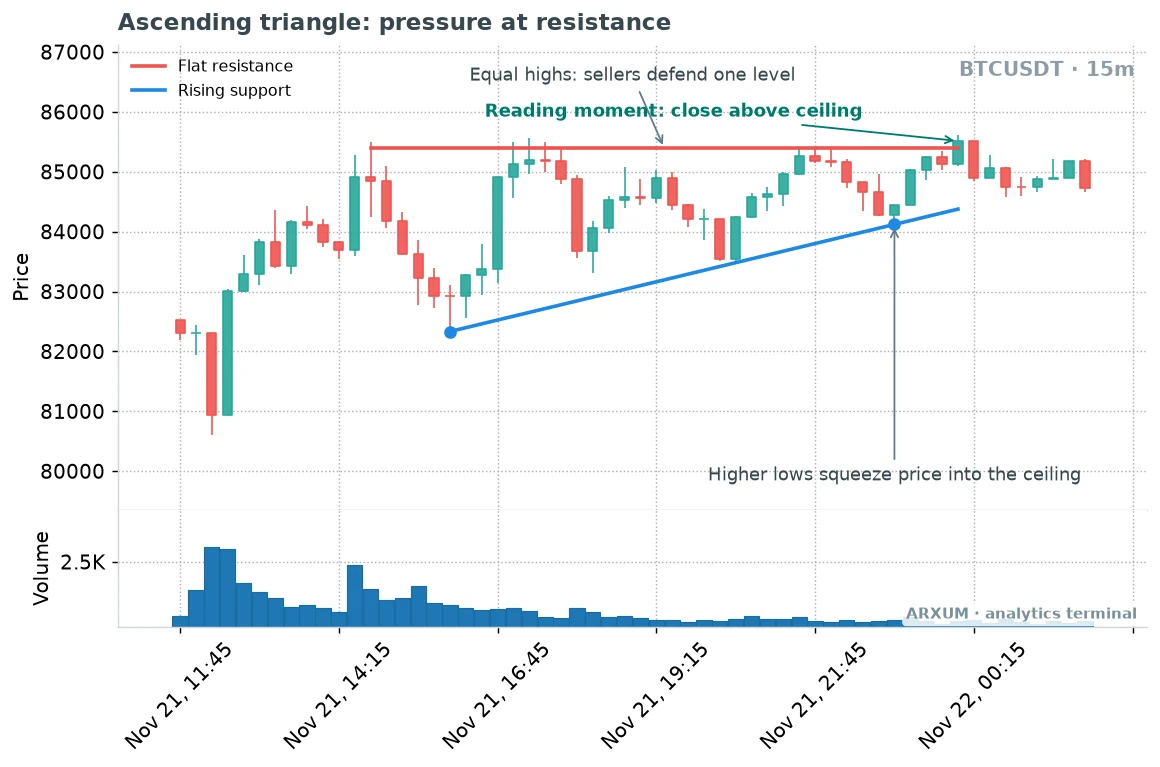
What went wrong, read straight off the chart:
- The shape was textbook: three tests of the ceiling near 85,400 and a floor rising from about 82,300 to 84,100.
- The volume told a different story. It peaked at the start of the move and faded for hours, then stayed flat at the break.
- The breakout candle barely cleared the line, a thin margin on a market that moves hundreds of dollars in 15 minutes.
- The next candle closed back under the ceiling near 84,900, and price drifted sideways below it.
On Bitcoin, volume is real traded volume from the exchange, so it is worth reading. A break on flat or falling volume is a warning, not a confirmation.
| Role | How you use it | Best read |
| Warning sign | Break on fading volume | M15 to H1 Bitcoin |
| Exit cue | Close back under ceiling | Entry TF |
| Hard invalidation | Close under the floor | Any TF |
| Contrarian trigger | Sell under the floor | H1 Bitcoin, H4 FX |
| Context | Higher TF trend down | H4, D1 |
How to use the read without overtrading it:
- If you are long from a breakout and price closes back under the ceiling, cut or reduce. Waiting for the floor to break costs more.
- Do not short the first slip back under the ceiling. Price often chops there, as the Bitcoin chart shows.
- A close below the rising floor is the cleaner signal. That is where the bullish idea is fully dead.
- On 15-minute charts this read matters most, because low timeframes print far more fake breaks than daily charts.
Rule of thumb: a break you can only see on the 15-minute chart, on fading volume, is a break you should doubt.
The confirmations that separate real breaks from fake ones
None of these filters turns the pattern into a sure thing. Each one simply removes a class of weak setups.
| Check | What to look for | Works on |
| Close, not wick | Body closes above | All markets |
| Trend | Price above 200-EMA | All markets |
| Real volume | Rise on the break | Bitcoin, crypto |
| Squeeze | Candles shrinking | All markets |
| Higher TF | D1 or H4 agrees | Intraday setups |
| Session | Break in active hours | Forex, gold |
A few notes on reading each one:
- Squeeze: you can see it without any indicator. The candles inside the triangle get shorter as the floor rises.
- If you want a number for the squeeze, use ATR (average true range), the average size of recent candles. On TradingView it is the built-in “Average True Range”, length 14. A falling ATR inside the triangle confirms the coil.
- Volume on gold and Forex: your platform shows tick volume, which counts price changes. It loosely tracks activity but cannot tell you if real money backed the break.
- Session: on EUR/USD and gold, a break during London or New York hours carries more weight than one in the quiet Asian session. Roughly, London opens about 07:00 UTC and New York about 12:00–13:00 UTC.
The ascending triangle across markets and timeframes
The shape is the same everywhere. What changes is how often it prints, how noisy it is, and which confirmation you can trust.
| Market | Character | Best TF | Key check |
| Gold (XAU/USD) | Strong trends | D1, H4 | 200-EMA |
| EUR/USD | Slow, retests often | H4 | Retest close |
| GBP/USD | Faster, wider swings | H4, D1 | Close, not wick |
| Bitcoin | Volatile, real volume | H4, H1 | Volume on break |
| Silver (XAG/USD) | Jumpy, deep wicks | D1 | Wider stop |
| WTI oil | News-driven spikes | D1 | Avoid report days |
Market-by-market notes:
- Gold: the metal has spent long stretches in strong uptrends, which is exactly where an ascending triangle reads as continuation. Keep it to the daily and 4-hour.
- EUR/USD: the most liquid pair moves in measured steps, so method 2, the retest, suits it well.
- GBP/USD: the pound swings wider than the euro. Fake wicks above the ceiling are common, so insist on a close.
- Bitcoin: it trades all week with no sessions, and its exchange volume is real. That makes the volume check worth more here than anywhere else.
- Silver and oil: both form the pattern, but news spikes can blow through a stop. Use the daily and keep size modest.
| Timeframe | Signals | Noise | Best use |
| D1 | Few | Low | Main trades |
| H4 | Moderate | Moderate | Retest entries |
| H1 | Many | High | Fine-tune entries |
| M15 | Very many | Very high | Exit and failure reads |
- A triangle that takes weeks to build on the daily reflects real positioning. One that forms in two hours on the 15-minute chart is often just a pause.
- A good pairing is to spot the triangle on the daily or 4-hour, then use the 1-hour only to time the entry.
How to calculate the ascending triangle target
The standard target is the measured move. You take the height of the triangle at its widest point and add it on top of the ceiling.
On EUR/USD the height is counted in pips. A pip is the smallest standard price step, 0.0001 on EUR/USD, so a move from 1.0160 to 1.0360 is 200 pips.
| Chart | Ceiling | First low | Height | Target |
| Gold D1 | ~1,796 | ~1,665 | ~131 | ~1,927 |
| EUR/USD H4 | ~1.0360 | ~1.0160 | ~200 pips | ~1.0560 |
| Bitcoin M15 | ~85,400 | ~82,300 | ~3,100 | ~88,500 |
The math is the same on every row: ceiling minus first low equals the height, and ceiling plus height equals the target. The prices are read off the charts, so treat them as approximate.
- A target is a plan, not a promise. On the Bitcoin chart the break failed long before any target came into play.
- Many traders take part of the position off halfway to the target and move the stop up.
- Compare the target with your stop distance before you act. That comparison is your risk/reward ratio, written 1:X, where 1 is the risk and X is how many times that risk the target offers.
How to trade the ascending triangle, step by step
This is the full routine for method 1 or method 2. It works the same on any market; only the timeframe changes.
- Find the shape. Two or more equal highs, two or more higher lows. On the daily or 4-hour first.
- Check the trend. Price above the 200-EMA on the daily. If it is below, pass.
- Mark the lines. Horizontal line on the ceiling, trend line through the swing lows.
- Pick your method. Buy the close above (method 1), or wait for the retest to hold (method 2).
- Set the stop. Under the last higher low for method 1. Under the retest low for method 2.
- Set the target. The measured move from the table above, or a nearer level if there is obvious resistance in between.
- Size the position. Risk 2% of the account on the trade, and work the lot size from the stop distance.
- Place the order. A buy-stop order a few pips above the ceiling only fires on the break. Then check the candle closes above, or close it.
- Manage the exit. A close back under the ceiling is your first warning. A close under the floor is the end of the idea.
Where to click
- TradingView: type the ticker (XAUUSD, EURUSD, BTCUSD) in the search. Use the “Horizontal Line” tool for the ceiling and the “Trend Line” tool for the floor. Add indicators with the Indicators button: “Moving Average Exponential” (length 200) and “Average True Range” (length 14).
- MT4/MT5: Insert → Lines (MT4) or Insert → Objects → Lines (MT5) for the horizontal line and trendline. Insert → Indicators → Trend → Moving Average (method Exponential, period 200), and Insert → Indicators → Oscillators → Average True Range (period 14).
- Charting on TradingView is free at the basic level, which is all this pattern needs.
A worked sizing example on EUR/USD
Here is how the 2% rule turns into a real order, using the 4-hour EUR/USD triangle and a $1,000 account. The numbers come from the chart; the account is illustrative.
| Step | Calculation | Result |
| Risk budget | $1,000 × 2% | $20 |
| Entry | Retest close | ~1.0365 |
| Stop | Under last higher low | ~1.0265 |
| Stop distance | 1.0365 − 1.0265 | 100 pips |
| Value per pip | $20 ÷ 100 pips | $0.20 per pip |
| Lot size | $0.20 ÷ $0.10 per micro lot | 2 micro lots (0.02) |
- One micro lot (0.01) on EUR/USD is worth about $0.10 per pip. Two of them put exactly $20 at risk to the stop.
- Two micro lots control about €2,000 of currency, roughly 2:1 effective leverage on $1,000. A broker’s 1:100 leverage is only margin headroom that lets you open that size; the risk is already capped by the stop.
- The measured target sits about 195 pips above this entry. Against a 100-pip stop that is roughly 1:2 on risk/reward.
- A tighter stop under the retest low would allow a bigger size for the same $20. The position sizing guide walks through that trade-off.
- The trade needs a broker that offers micro lots, so small accounts can size this precisely.
Where the ascending triangle fails
The pattern is popular, which is part of the problem. Lots of traders place buy-stops just above the same ceiling, and fast markets love to fill those orders and reverse.
| Failure | What you see | What to do |
| Wick break | Poke above, close under | Wait for the close |
| Thin break | Closes just above | Wait for the next candle |
| Fading volume | Flat volume at the break | Doubt it (crypto) |
| Wrong trend | Below the 200-EMA | Skip the setup |
| Floor breaks | Close under rising line | Exit, idea is dead |
| News spike | Huge candle on data | Avoid release times |
Mistakes that come from the trader, not the market:
- Forcing the shape. Three random highs at slightly different prices are not a ceiling.
- Buying inside the triangle and calling it an early entry. Until the close above, it is a range trade with a stop under the floor.
- Moving the stop lower when the break wobbles. The stop sits where the idea is wrong; moving it just makes the loss bigger.
- Trading every 15-minute triangle. Low timeframes print the shape constantly, and most of those are noise.
- Ignoring the cousins. A small triangle after a sharp spike is really a pennant, which trades differently.
Keeping it in proportion
- Even a well-chosen ascending triangle loses often. An edge shows over many trades, never on any single one.
- Expect runs of losses. If you take three to six losers in a row, the market may have changed character; pause and check the trend before the next one.
- After a big winner, keep the same 2% size. Euphoria sizing is how one good trade gets given back.
- After a stop-out, don’t jump back into the same chart to win it back. The next triangle will come.
- Trade only money you can afford to lose. If your live results run clearly worse than you expected over a decent number of trades, step back and check conditions; one bad week is just noise.
Which method to use when
| Your situation | Use | Timeframe |
| Clean daily triangle, strong trend | Close-above breakout | D1 |
| Patient, want a tight stop | Retest entry | H4 |
| Trading EUR/USD | Retest entry | H4 |
| Trading Bitcoin intraday | Failed-breakout read | M15 to H1 |
| Already long, break wobbles | Failed-breakout read | Entry TF |
| Price below 200-EMA | No trade | Any |
What works, in three lines you can remember:
- Trade the ascending triangle pattern with the trend: price above the 200-EMA, on the daily or 4-hour.
- Act on a close, never a wick, and give the break a candle to prove itself, or wait for the retest.
- Treat a close back under the ceiling as a warning and a close under the floor as the exit.
If you want to go further, the same close-and-retest logic powers most breakout trading setups. The cup and handle is the next pattern that uses it.
Glossary
- Ceiling (flat resistance): the horizontal line through the equal highs.
- Floor (rising support): the sloping line through the higher lows.
- Higher low: a dip that ends above the previous dip.
- Breakout: a candle that closes beyond the triangle.
- Retest: price returning to the broken line to check it from the other side.
- Measured move: the triangle’s height projected from the breakout point.
- 200-EMA: an exponential moving average of the last 200 closes, used to read the trend.
- ATR: average true range, the average size of recent candles.
- Tick volume: a count of price changes, shown instead of traded volume on Forex and gold.
- Pip: the smallest standard price step, 0.0001 on EUR/USD.
- Micro lot: 0.01 of a standard lot, about $0.10 per pip on EUR/USD.
FAQ
What is an ascending triangle pattern, in plain terms?
It is a chart shape with a flat ceiling on top and a rising floor below. Sellers keep defending one price, while buyers step in at higher and higher prices on every dip. The two lines squeeze together until price breaks out, usually upward. Traders act on a candle that closes above the ceiling.
Is an ascending triangle bullish or bearish?
Usually bullish, especially inside an uptrend. A close below the rising floor flips the read to bearish.
How do you trade an ascending triangle?
Confirm the trend first, with price above the 200-period EMA on the daily chart. Then either buy the candle that closes above the ceiling, or wait for price to come back to the broken ceiling and hold it. Put the stop under the last higher low or under the retest low. Risk about 2% of the account and size the lot from the stop distance.
How do you calculate the ascending triangle target?
Measure the height of the triangle at its widest point, from the ceiling down to the first low on the floor. Add that height to the ceiling. On a EUR/USD triangle with a ceiling at 1.0360 and a first low at 1.0160, the height is 200 pips and the target is about 1.0560. Treat it as a plan, not a promise.
Where should the stop loss go on an ascending triangle?
Under the last higher low on the rising floor. If you entered on a retest, just under the retest low.
What is the best timeframe for the ascending triangle?
The daily and 4-hour charts give the cleanest reads, because each triangle reflects real positioning built over days. The 1-hour is fine for timing an entry the higher chart already set up. The 15-minute chart prints the shape constantly, and many of those breaks fail, so use it mainly to read exits.
Does volume matter for an ascending triangle breakout?
On Bitcoin and other crypto, yes. Exchanges report real traded volume, so a rise on the break is a useful sign and a break on fading volume is a warning. On gold and Forex, your platform shows tick volume, a count of price changes rather than money traded. It is too noisy to confirm a break, so lean on the close, the trend and the squeeze instead.
What is the difference between an ascending and a descending triangle?
They are mirror images. The ascending triangle has a flat top and rising lows and usually breaks up. The descending triangle has a flat bottom and falling highs and usually breaks down.
How much money do I need to trade the ascending triangle?
Less than most people think, as long as your broker offers micro lots. With a $1,000 account and a 2% risk rule, you put $20 at risk per trade. On a EUR/USD triangle with a 100-pip stop, that works out to two micro lots. On a $500 account the same stop allows one micro lot at about 2%. Gold and Bitcoin often need wider stops, so a small account may only fit the minimum size there. Start with the market where the stop and the lot size actually line up.
What do ceiling, floor and measured move mean?
The ceiling is the flat resistance line through the equal highs. The floor is the rising support line through the higher lows. The measured move is the triangle's height added on top of the ceiling, used as the price target.
Real-time trade setups with entry, stop loss and take profit. Daily market analysis. No subscription, no complicated theory.
🌍 Our recommended brokers


Reader Reviews
Be the first to review this — tell other traders what actually helped, or where it fell short.
Leave a Review

Momentum Trader & Technical Analyst
Trades momentum across crypto and forex since 2019, built around RSI, MACD, and volume. Turns discretionary setups into rule-based, systematic entries and validates them on data before they go live.
