

What the pennant pattern actually is
A pennant is a trend pausing to gather itself. Price rips in one direction, stalls into a tight little coil, then breaks out and keeps going.
Here is the shape the way a textbook draws it.
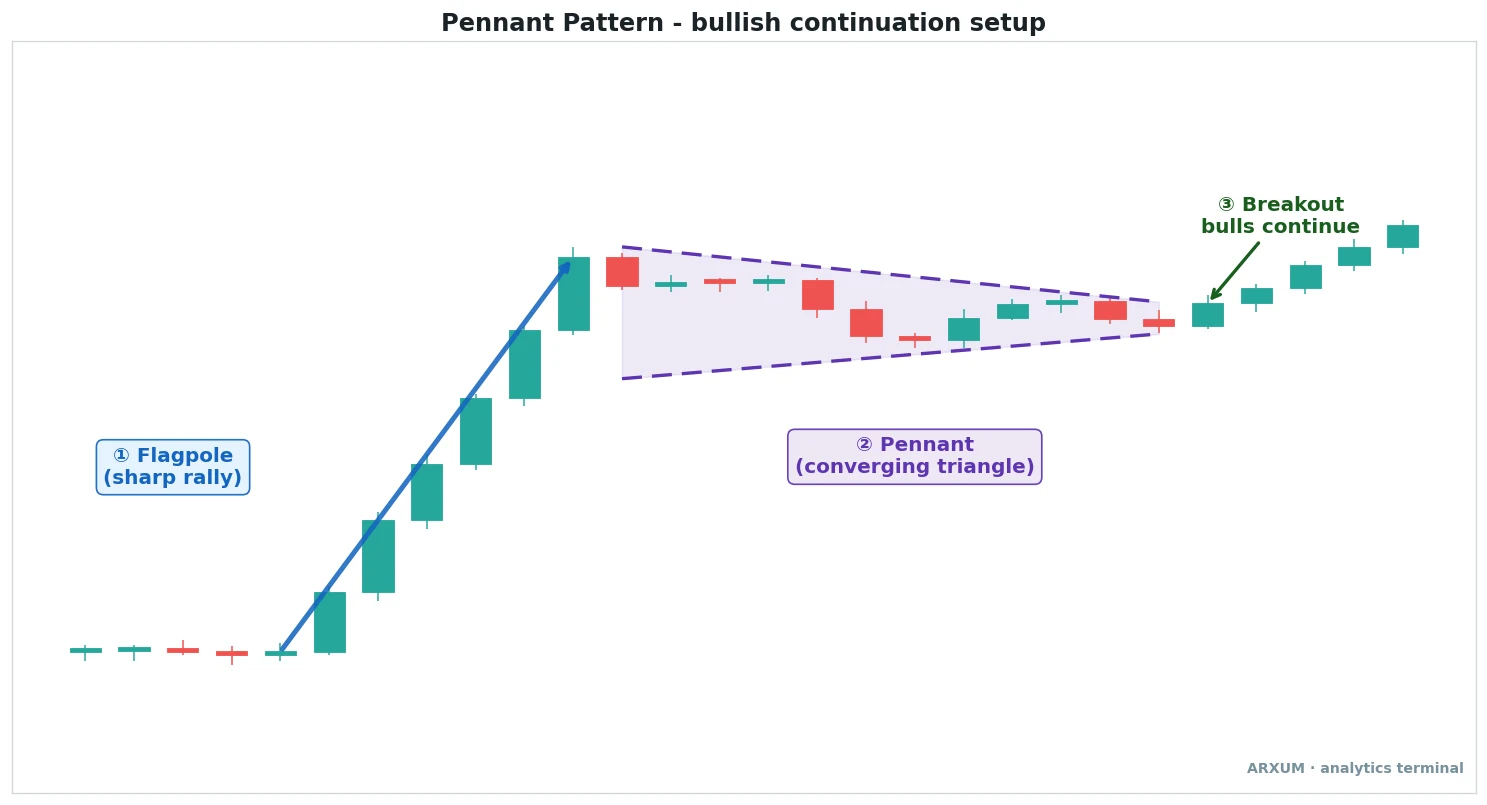
Now the picture is on screen, the three parts are easy to name. Read them left to right.
- The flagpole: the sharp, one-way move that starts everything. Its height is what you will measure for the target.
- The pennant: a small pause where the highs step lower and the lows step higher, so the range squeezes to a point. It is a mini symmetrical triangle, which just means the two boundary lines slope toward each other.
- The breakout: a candle that closes out of the pennant in the flagpole’s direction, and the move resumes.
The pennant should be small and quick. A tidy coil that forms in a handful of bars keeps the momentum from the flagpole alive.
If the coil drags on and grows wide, that momentum leaks away, and you are looking at a plain range instead of a pennant.
| Part | What it is | What to look for |
| Flagpole | The steep move that sets the trend | Wide candles, one direction, little overlap |
| Pennant | The pause that coils to a point | Converging lines, shrinking candles, fading volume |
| Breakout | The trigger to enter | A close out of the pennant in the trend's direction |
Pennant vs flag: the one difference that matters
People mix up the pennant and the flag constantly, and the whole distinction sits in the shape of the pause. That is the only thing you need to check.
| Feature | Pennant | Flag |
| Pause shape | Converging triangle | Parallel channel |
| Boundary lines | Squeeze toward a point | Run parallel, same slope |
| Range over time | Tightens fast | Holds its width |
| Both are | Continuation after a flagpole | Continuation after a flagpole |
The two patterns are cousins, and they trade the same way once the breakout fires. A pennant coils to a point, a flag drifts sideways in a tidy box.
If you want the flag versions in full, the bull flag and bear flag guides cover them. And because a pennant is a small symmetrical triangle, the triangle chart patterns guide is the natural next read.
Bull pennant and bear pennant: the same shape, flipped
A pennant chart pattern comes in two directions, and one is just the mirror of the other. Learn the bull version and you already know the bear version, you only reverse everything.
One term shows up in the table below: the 200-EMA. It is the 200-period exponential moving average, a slow line that smooths price and shows which way the market leans, an uptrend above it and a downtrend below.
| Element | Bull pennant | Bear pennant |
| Prior trend | Uptrend | Downtrend |
| Flagpole | Sharp rally up | Sharp drop down |
| Breakout | Above the pennant, go long | Below the pennant, go short |
| Trend filter | Price above the 200-EMA | Price below the 200-EMA |
| Target | Pole height up from the break | Pole height down from the break |
Every chart in this guide shows the bull version, a rally that pauses and pushes higher. For a bear pennant, turn the same picture upside down: a sharp drop, a coil that often drifts slightly up against it, then a break lower.
That single line, the 200-EMA, is the whole reason a bull pennant and a bear pennant do not need separate rulebooks. Same coil, same breakout, opposite side of it.
How to read each stage, and what to do with it
Spotting the coil is the easy half. The value is knowing what each stage is telling you to do, so this table is the core of the method.
| Stage | How you use it | Best read |
| Flagpole | Confirms the trend and sizes the target | Steep, wide candles, one direction |
| Pennant | Wait; do not trade inside the coil | Converging lines, candles shrinking |
| Volume | The tell that the pause is real | Fades through the coil, surges on the break |
| Breakout | Your trigger to enter | A close out of the pennant with the trend |
| Stop | Caps the loss if the break fails | Just past the far side of the pennant |
| Target | Where you plan to exit | Flagpole height projected from the breakout |
| Regime | The go or no-go switch | Price on the right side of the 200-EMA |
A word on the volume line, because it is what makes a pennant trustworthy. Through a healthy coil, volume should dry up as traders lose interest in the pause.
Then, on the breakout candle, it should jump back to life as the trend resumes. Rising volume during the coil is a warning that the pause is really a fight, not a rest.
One caveat up front, because it changes everything below. This volume tell only holds on crypto, where exchanges report real trades.
On gold and Forex you read the coil and the trend instead, and the market sections that follow show exactly why.
The target is the simplest part, and the one beginners skip. Measure the flagpole from base to tip, then project that same distance from the breakout point.
That projected level is your first target, a technique traders call a measured move. Because the stop sits close, just past the coil, while the target is the full pole, a winning trade can pay back several times what you put at risk.
That is what traders mean by good reward against risk, and the risk-reward ratio guide walks through the math in plain terms.
The pennant on gold: patient coils on the daily
Spot gold (XAU/USD) prints clean pennants, and its long, deliberate trends make the daily chart the place to read them. A gold flagpole can run for days before the market pauses to coil.
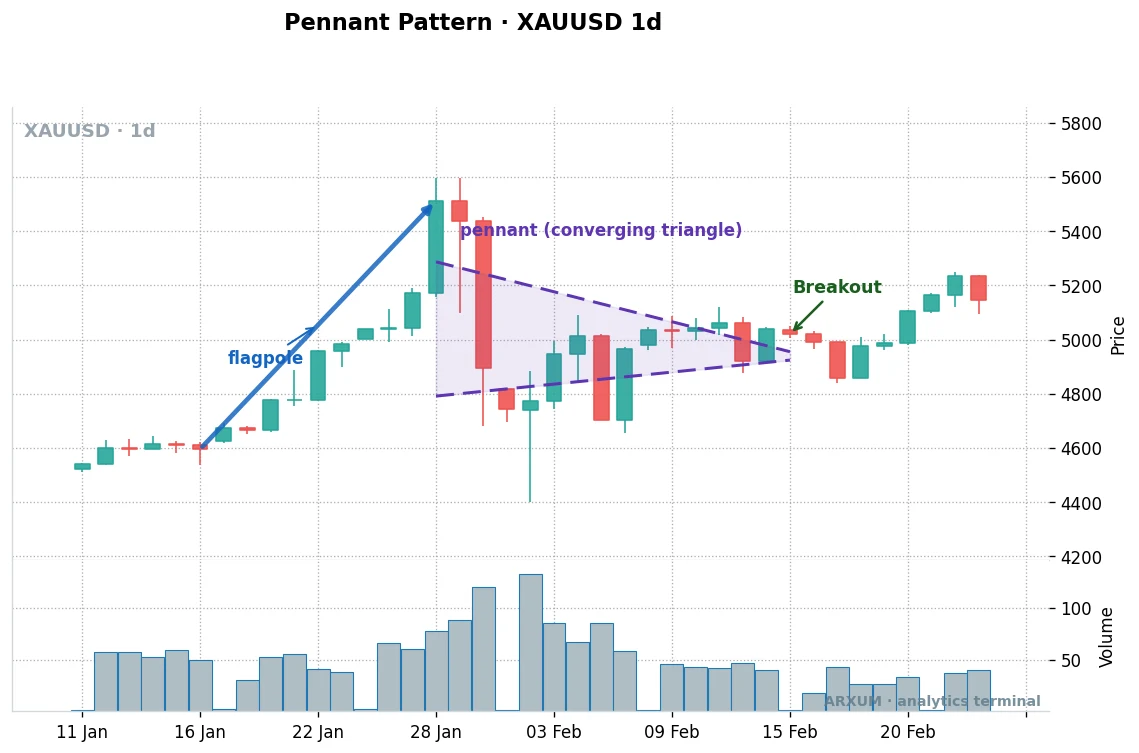
On that gold chart the sequence is textbook. The flagpole arrow marks the sharp rally, price then coils into the shaded pennant, and the breakout label sits where price pushes out and the trend continues.
- How it looks on gold: long, confident flagpoles, then patient pennants that can take a week or more to tighten on the daily.
- The catch: gold trends hard in one direction for long stretches, so most of its pennants are bull pennants riding an uptrend. Keep the 200-EMA underneath before you trade the long side.
- The volume trap: gold shows tick volume, a count of price updates rather than real money traded, so the volume fade and surge are only a rough guide. Read the structure first.
| Market | Best timeframe | What to lean on |
| Spot gold (XAU/USD) | Daily | The 200-EMA regime and a clean flagpole |
| Silver (XAG/USD) | Daily | Same, but expect wider coils and more fakeouts |
| Oil (WTI) | Daily, 4-hour | Cyclical, so both bull and bear pennants show up |
The pennant on Bitcoin and crypto: where the coil is cleanest
Bitcoin is a natural home for the pennant, because crypto moves in sharp impulses followed by tight pauses. That rhythm is exactly what the pattern needs, and the 4-hour chart shows it well.
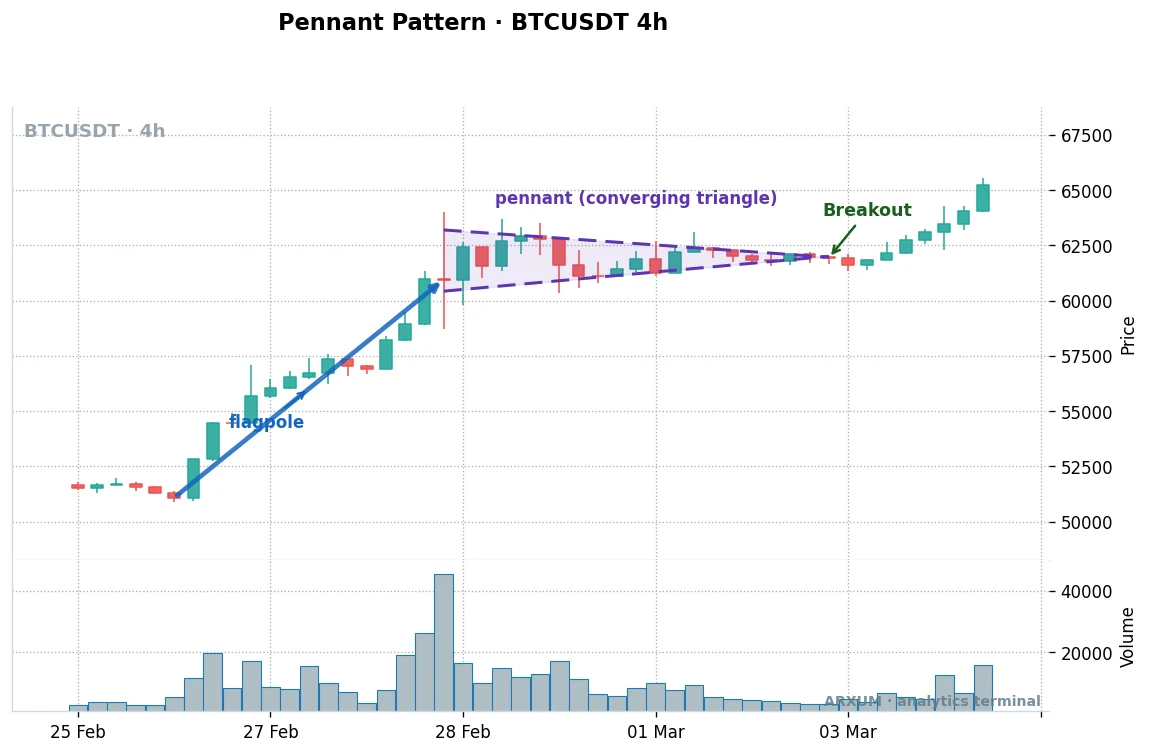
That BTC chart is the pattern in its element. Look at the volume panel: it spikes hard on the flagpole, drains away inside the coil, then builds back up as the trend resumes past the breakout.
That fade-then-return is the volume signature you want.
- Sharp flagpoles: crypto rallies and drops fast, so the impulse leg is steep and obvious.
- Real volume: exchanges report every coin traded, so the fade-then-surge in volume is a genuine tell, not a guess.
- Faster coils: the 4-hour prints far more pennants than the daily, which suits an active trader.
| Setup | How to use it | Best read |
| BTC in a trend | The core pennant home | 4-hour and daily, price the right side of the 200-EMA |
| Breakout volume | Adds real conviction | A visible surge on the break candle |
| Altcoins | Sharper but noisier | Only in a clear BTC-led move |
Volume is the one place gold and crypto genuinely split, and it decides whether you trust that breakout surge or ignore it. It earns its own small table.
| Market | Volume shown | Trust the surge on the break? |
| Bitcoin, crypto | Real exchange volume | Yes, a surge confirms the breakout |
| Gold, silver, oil | Tick volume, a proxy | No, read the coil and the trend |
| EUR/USD, GBP/USD | Tick volume, a proxy | No, lean on the flagpole and shape |
The pennant on Forex majors
The majors sit between gold and crypto. EUR/USD and GBP/USD trend in clean legs, and a pennant inside one of those legs reads well.
- In a trending leg: the coil is orderly and the breakout is reliable, long in an uptrend, short in a downtrend.
- In a range: the same shape fires over and over and fails both ways, so the 200-EMA filter does the heavy lifting.
- The volume rule: like gold, Forex shows tick volume, so skip the volume test and trade the flagpole and the coil.
| Pair | Best timeframe | Condition |
| EUR/USD | Daily, 4-hour | A clear trend leg, price past the 200-EMA |
| GBP/USD | Daily, 4-hour | Trends hard, so coils are clean when the trend is real |
| Yen crosses | Daily | Strong moves, but news-driven; mind the calendar |
Which timeframe to watch it on
The chart you use changes the pattern more than most people expect. The same coil is a real signal on the daily and mostly noise on the 1-hour.
| Timeframe | Character | Best use |
| Daily (D1) | Fewer, cleaner pennants; each is a real trend pausing | The core read on gold and Forex |
| 4-hour (H4) | More coils, more noise; suits crypto | Crypto trends with a volume check |
| 1-hour (H1) | Mostly noise; most coils are not real | Skip, or only fine-tune an entry the daily set up |
There is a practical tell in that. If you find yourself taking many pennant trades a day, you have drifted to a chart where the edge is gone.
More signals is not more opportunity. It is the warning light that you are trading noise, so step back up a timeframe.
Pennant pattern trading, step by step
How to trade the pennant pattern comes down to a mechanical checklist, which is what makes it a good setup for a newer trader. Here is the whole method.
- Confirm the trend. For a bull pennant, price above the 200-EMA. For a bear pennant, below it. No trend, no pennant.
- Find the flagpole. A steep, one-way move on wide candles. That impulse is the trend you plan to join, and its height is your future target.
- Wait for the coil. The range should tighten to a point over a few bars, and volume should fade. If the coil grows wide or drags on, the momentum is gone, so pass.
- Enter on the breakout. Take the candle that closes out of the pennant in the flagpole’s direction. On crypto, a volume surge on that candle adds conviction. On gold and Forex, do not wait for one.
- Place the stop and target. Stop just past the far side of the pennant. Target the flagpole’s height projected from the breakout, and never widen the stop once it is set.
To add the one indicator you need, the 200-EMA, on TradingView click the Indicators button, search Moving Average Exponential, and set the length to 200. On MT4 or MT5 it is Insert, then Indicators, then Trend, then Moving Average with period 200 and the Exponential method.
On order placement, you do not have to sit and watch for the close. Most platforms let you leave a stop order, an instruction that fires the moment price trades through a level you set, just beyond the pennant boundary.
In the same ticket you fill the stop-loss field on the far side of the coil and the take-profit field at your measured target, so the whole trade goes in at once. Once it is live, you can bank part of the position at the halfway mark and trail the rest, meaning you move your stop behind price as the trade goes your way.
The breakout itself is a form of breakout trading, and the coil before it is textbook consolidation.
Sizing, in plain numbers. Risk a small fixed slice of the account, usually 1 to 2%, per trade, and let the distance from entry to stop decide the size, never the other way around.
Work it from the account down. On a $700 account, risking 1.5% puts about $10 on the line for the trade.
Say your entry is the breakout and your stop, on the far side of the pennant, sits $20 away in price, so a single unit would lose $20 if the stop is hit. Divide the risk budget by that distance: $10 ÷ $20 = 0.5.
That 0.5 is your position size, the quantity or lot figure you type into the order ticket.
At that size, each $1 the price itself moves is worth 50 cents to you, so a full $20 move to your stop costs 0.5 × $20 = $10, exactly what you planned. On an expensive market like gold, 0.5 can sit below a broker’s smallest allowed position, so a small account often trades a micro-sized contract or a cheaper instrument rather than forcing the trade.
A tighter pennant means a closer stop, so the same $10 buys a bigger size. That is the payoff for waiting on a clean coil instead of forcing a loose one.
One discipline rule sits on top of the math. A pattern that leans on a trend will hand you losing streaks when that trend stalls.
Two or three losses mean nothing. A run of five or six in a row means the trend has probably rolled over, so stand down and wait for price to settle back on the right side of the 200-EMA before the next trade.
That is the cue to stop, not to size up and win it back.
Where the pennant pattern fails
Plenty of pennants fail, even clean-looking ones, which is why the stop is never optional. The losers teach the pattern as well as the winners, and almost every failed setup traces to one of these.
- No prior trend. A coil with no flagpole in front of it is just a range. There is no trend to continue, so there is no pennant.
- A coil that is too big. If the pause is wide and slow, it has stopped being a pennant and become a full consolidation. The momentum has bled out.
- The false breakout. Price pokes out of the coil, then snaps back in. On crypto, a break with no volume behind it is the classic fake. Wait for the close, not the wick.
- Trusting tick volume. On gold and Forex, the volume fade and surge are only a proxy, so do not build the trade on them.
- The wrong timeframe. On the 1-hour, most coils are noise. No filter rescues a pattern on a chart that is mostly random.
Decision table: what to do, at a glance
| Situation | Do this |
| Clear trend, sharp pole, tight coil | Enter the close out of the pennant, with the trend |
| Crypto, breakout on a real volume surge | Take it; the volume adds conviction |
| Gold or Forex, waiting for a volume spike | Do not wait; trade the coil and the trend |
| No flagpole before the coil | Skip it; that is a range, not a pennant |
| The coil is wide and slow | Skip it; the momentum is gone |
| Price broke out then snapped back in | Stand aside; the breakout failed |
| Many coils per day on the 1-hour | Step up a timeframe; that is noise |
What works: the short version
If you remember three things about pennant pattern trading, make it these.
- Trend first, then the coil. A pennant is only worth trading when a real flagpole and the 200-EMA back it. That single filter fixes most bad trades.
- Wait for the close out of the coil. The pennant is the pause, not the signal. The breakout is the trigger. Stop past the far side, target the pole projected from the break.
- Match the market to the volume. On crypto, trust the fade-then-surge; on gold and Forex, ignore it and read the shape.
The pennant is a close cousin of the flag, the difference being a coil instead of a channel. For patterns that call a turn rather than continue one, the wedge chart patterns guide is the next step.
Glossary
- Flagpole: the sharp, fast move that starts the pattern. Its height sets the target.
- Pennant: the small converging coil that pauses the trend before it resumes.
- Breakout: the candle that closes out of the pennant and triggers the trade.
- Continuation pattern: a shape that resumes the existing trend, not one that reverses it.
- Symmetrical triangle: a coil whose upper and lower lines slope toward each other; a pennant is a small, fast one.
- 200-EMA: the 200-period exponential moving average, a trend filter; the right side of it defines the trend.
- Tick volume: a count of price updates, shown by gold and Forex platforms in place of real traded volume.
- Measured move: projecting the flagpole’s height from the breakout to set the target.
FAQ
What is the pennant pattern in trading?
The pennant is a short continuation chart pattern. Price makes a sharp one-way move called the flagpole, then pauses and coils into a small converging triangle called the pennant, before breaking out to continue the original trend. You enter on the close out of the pennant, place the stop just past the far side of the coil, and set the target by projecting the flagpole's height from the breakout.
Is a pennant pattern bullish or bearish?
It can be either, because a pennant continues whatever trend came before it. A bull pennant follows a rally and breaks out upward, traded long. A bear pennant follows a sell-off and breaks out downward, traded short. The direction of the flagpole tells you which one you are looking at, and the coil itself is just a pause.
What is the difference between a pennant and a flag?
The only real difference is the shape of the pause. A pennant coils into a converging triangle, where the upper and lower lines squeeze toward a point. A flag drifts inside a parallel channel that holds its width. Both are continuation patterns that follow a flagpole and trade the same way once price breaks out, so the coil versus channel shape is the tell that separates them.
How do you set the target on a pennant pattern?
Measure the flagpole from its base to its tip, then project that same distance from the point where price breaks out of the pennant. That projected level is your first target, a technique called a measured move. Because the stop sits close to the coil while the target is the full pole, the pattern naturally offers a favourable reward against risk.
How reliable is the pennant pattern?
It is reliable when the conditions are right and unreliable when they are not. A pennant needs a genuine flagpole, a tight fast coil, and a real trend behind it, ideally with volume fading through the pause and surging on the breakout. Trade it on the daily or 4-hour in a clear trend and it earns its keep. Force it on the 1-hour or in a range and it fails constantly.
What is a bull pennant pattern?
A bull pennant is the upward version. Price rallies hard to form the flagpole, pauses in a small converging coil, then breaks out above the pennant to continue climbing. You take it long, with price above the 200-EMA, and target the flagpole's height projected up from the breakout. Bitcoin and gold both print clean bull pennants in strong uptrends.
What is a bear pennant pattern?
A bear pennant is the mirror image. Price drops sharply to form the flagpole, pauses in a small converging coil that often drifts slightly up, then breaks down below the pennant to continue falling. You take it short, with price below the 200-EMA, and target the flagpole's height projected down from the breakout. Crypto and oil, with their real corrections, are where it works best.
What timeframe is best for the pennant pattern?
The daily is the core read on gold and Forex, because each pennant reflects a real trend pausing. On crypto, the 4-hour also works well and prints more setups, especially with a genuine volume surge on the breakout. The 1-hour is mostly noise on every market, so use it only to fine-tune an entry that a higher timeframe already set up.
Do you need volume to confirm a pennant breakout?
It depends on the market. The classic pennant has volume fading through the coil and surging on the breakout. On Bitcoin and crypto, exchanges report real traded volume, so that surge is a true tell worth waiting for. On gold and Forex, platforms only show tick volume, a count of price updates, so the signal is unreliable and you should lean on the coil and the trend instead.
Why did my pennant trade fail?
The most common reasons are no real trend, a coil that grew too wide, or a false breakout. A pennant with no flagpole in front of it is just a range. A wide, slow coil has lost its momentum and become a full consolidation. And a break that snaps straight back in was a fake, often on crypto when there was no volume behind it. Confirm the trend, keep the coil tight, and wait for the close, not the wick.
Real-time trade setups with entry, stop loss and take profit. Daily market analysis. No subscription, no complicated theory.
🌍 Our recommended brokers


Reader Reviews
Be the first to review this — tell other traders what actually helped, or where it fell short.
Leave a Review

Momentum Trader & Technical Analyst
Trades momentum across crypto and forex since 2019, built around RSI, MACD, and volume. Turns discretionary setups into rule-based, systematic entries and validates them on data before they go live.
