
What consolidation in trading actually is
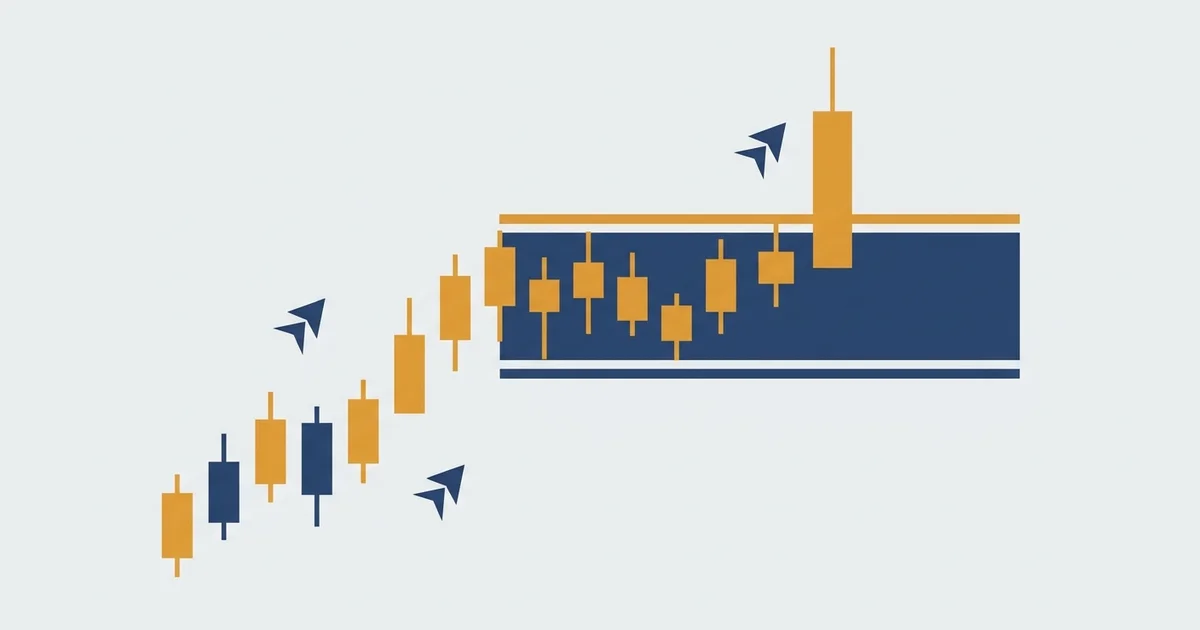
A consolidation is a market catching its breath. After a strong move, price stalls and drifts sideways between two levels.
Here is the shape the way a textbook draws it.
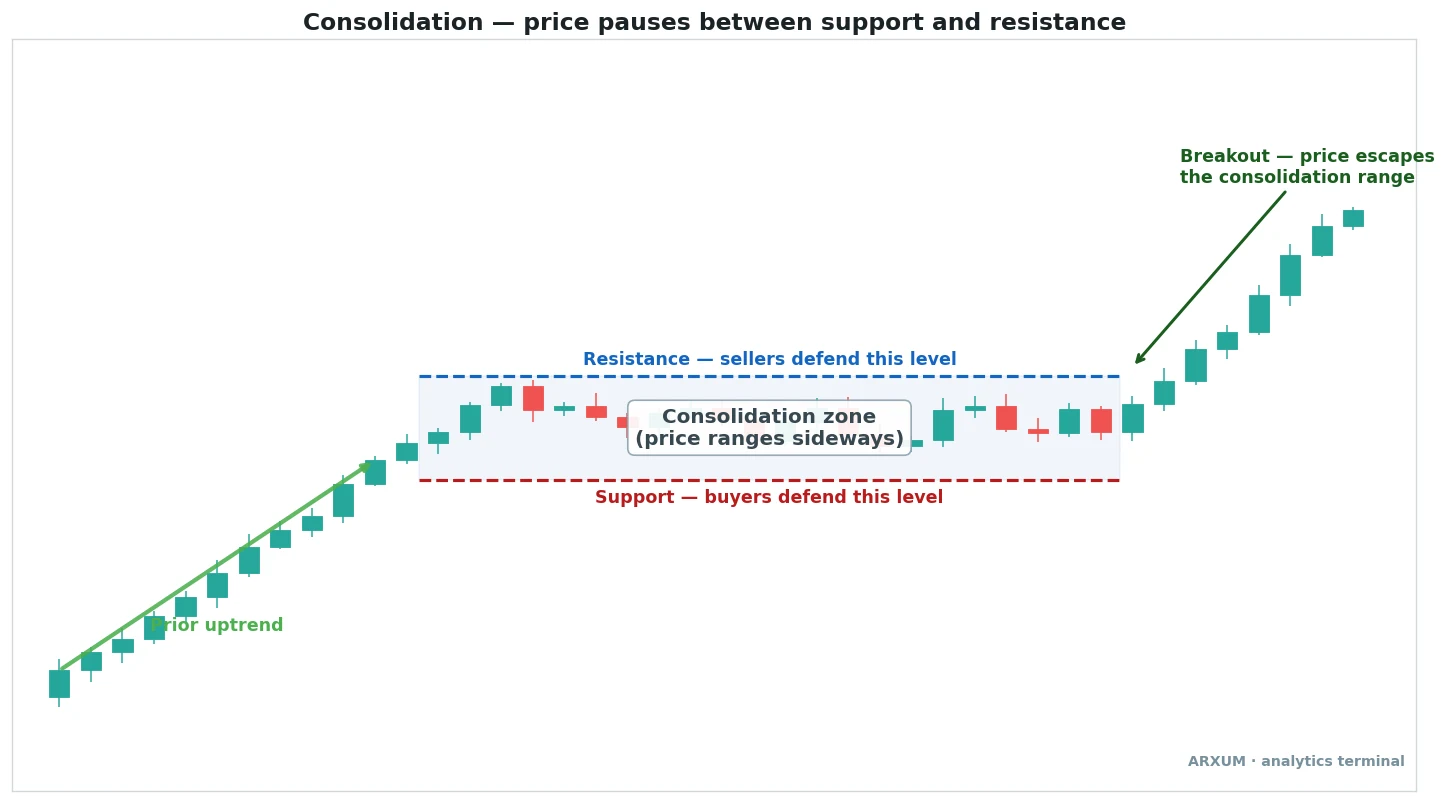
Now that the picture is on screen, the parts are easy to name. Read the chart left to right.
- The prior trend: the move that came before, here a clean uptrend. Consolidation is the pause inside a bigger story.
- Resistance: the ceiling where sellers keep stepping in. Price tests it and fails.
- Support: the floor where buyers keep stepping in. Price tests it and holds.
- The range: the band between the two, where price chops back and forth. This is the trading range itself.
- The breakout: the candle that finally closes outside the zone and ends the consolidation.
The key point is what a consolidation is not. It is not a top or a bottom, it is a rest stop where the market coils before picking a direction.
| Part | What it is | What to look for |
| Prior trend | The move that ran before the pause | A clear push up or down into the range |
| Resistance | The ceiling sellers defend | Two or more rejections off the same level |
| Support | The floor buyers defend | Two or more bounces off the same level |
| The range | The band price chops inside | Sideways candles, overlapping bodies |
| Breakout | The end of the consolidation | A decisive close outside the zone |
How to spot a range-bound market
You do not need a special tool to see consolidation, but three simple tells confirm it fast. When all three line up, you are range-bound.
| Tell | What you see | Why it signals consolidation |
| Flat support and resistance | Price bouncing between a level floor and ceiling | Neither side can force a breakout |
| ADX below 20 | The trend-strength line sits low and flat | No dominant trend, momentum has drained |
| Falling volatility | Candles shrink, ranges tighten week to week | Interest is fading, the market is resting |
The middle tell is worth a closer look, because it is the one most beginners have not met yet.
ADX, the Average Directional Index, is a single line that measures how strong a trend is, not which way it points. Below about 20 to 25 it is telling you there is no real trend, which is the fingerprint of a consolidation.
Here it is on Bitcoin’s daily chart.
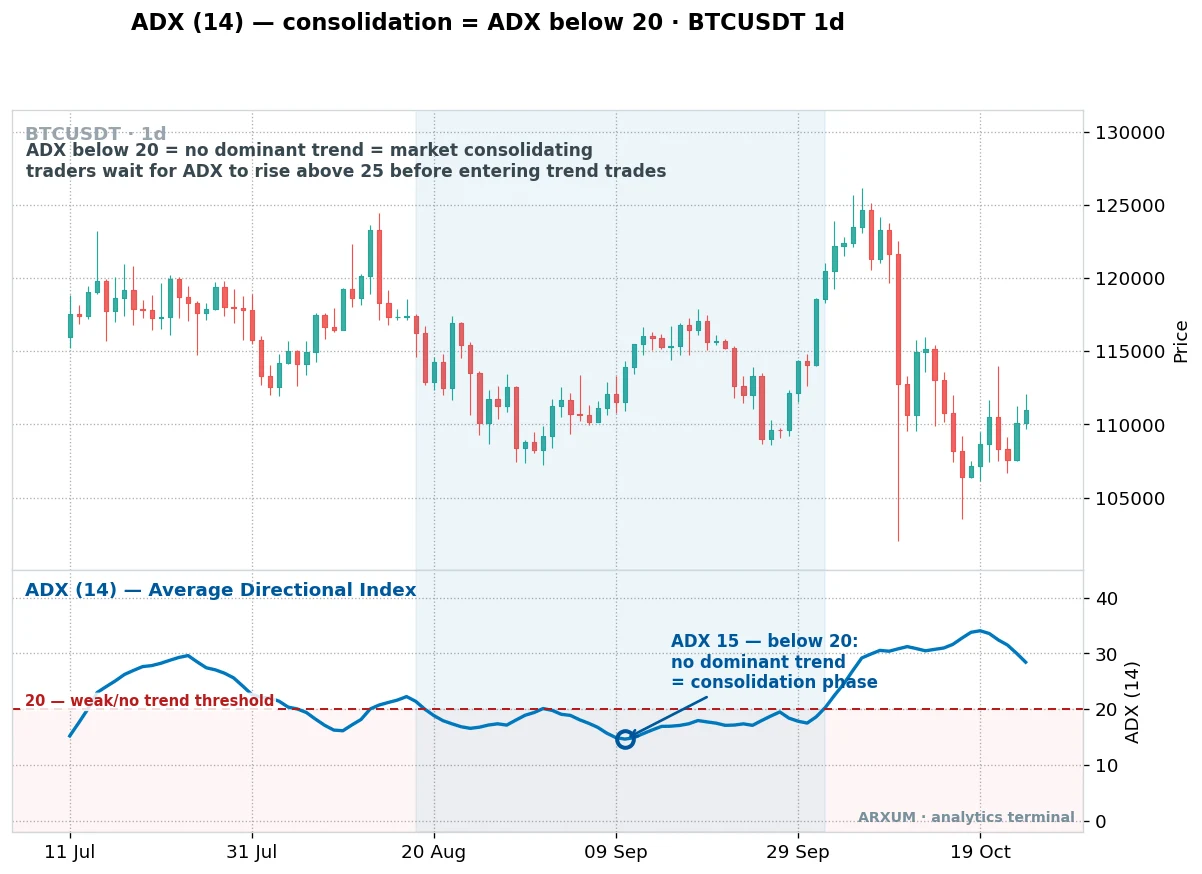
Read the two panels together. On price, Bitcoin grinds sideways through the shaded zone, while below it the ADX line drops under the red 20 line and stays there.
That low, flat ADX is the consolidation, in one number.
- The rule of thumb: ADX under 20 means range, so trend-following signals will mostly fail. Wait for ADX to climb back above 25 before you trust a trend trade.
- Where to find it: ADX is a free, built-in indicator on any charting app. The default setting is 14.
- Read it with the levels, not alone: a low ADX plus a clear floor and ceiling is the confirmation. Our ADX indicator guide takes the line apart in plain terms.
How to trade a range-bound market: three range trading strategies
Once you know you are in a range, there are three clean ways to trade it, and the skill is matching the strategy to what price is doing right now.
The three are the range bounce, the squeeze, and the breakout.
1. The range bounce: fade the edges
This is the classic range trading strategy: buy near support, sell near resistance, take profit at the other side of the range.
It works because in a genuine consolidation, the edges hold far more often than they break.
- How it looks: price drifts down to support, stalls, and turns back up. Then it drifts to resistance, stalls, and turns back down.
- The entry: buy as price stabilises near support, or sell as it stalls near resistance. Wait for a rejection candle, do not catch a falling knife.
- The exit: the opposite edge of the range. A bounce off support targets resistance, and the other way around.
- The stop: just beyond the edge you entered at. If support breaks, your reason for the trade is gone, so you are out cheaply.
| Level | How you use it | Best read |
| Support | Buy zone | Price stalls and prints a rejection off the floor |
| Resistance | Sell zone, or your buy target | Price stalls and rolls over off the ceiling |
| Mid-range | No-trade zone | Skip it, the edge is only at the extremes |
| Stop-loss | Caps the loss if the range breaks | A few pips beyond the level you traded |
Because the stop sits tight against the edge while the target is the far side of the range, a range bounce naturally offers a decent payoff for the risk. The risk-reward ratio guide explains the 1:X math, where the 1 is your risk to the stop and the X is the reward to the target.
2. The squeeze: anticipate the breakout
A consolidation often tightens before it breaks. The range narrows, volatility drains, and the market coils like a spring.
The cleanest way to see that is the Bollinger Band squeeze.
Bollinger Bands are two lines that sit a set distance above and below a moving average of price. When the market goes quiet, the bands contract, and that pinch is the squeeze.
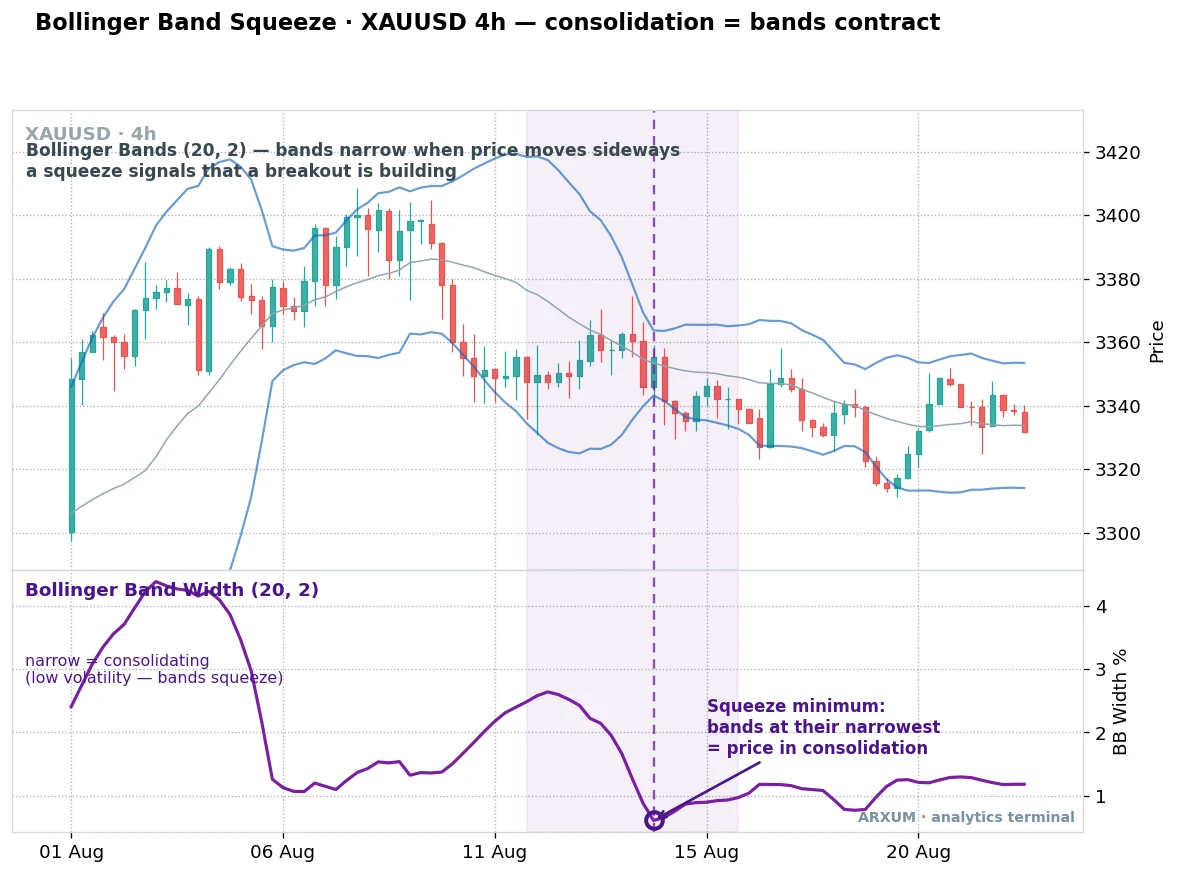
On that gold chart, the two blue bands wrap tight around price through the shaded zone. The purple Band Width line in the lower panel falls to its lowest point, marked as the squeeze minimum.
- How it looks: the bands narrow to a thin ribbon and price barely moves. The quieter it gets, the bigger the eventual move tends to be.
- What it tells you: low volatility does not last. A squeeze is the market storing energy for a breakout, and it does not tell you the direction yet.
- How to use it: the squeeze is a warning, not an entry. It says get ready, then you wait for price to actually break the range before you act.
| Signal | What it means | What to do |
| Bands pinch tight | Volatility is low, price is coiling | Set alerts, prepare for a breakout |
| Band Width at a low | The squeeze is at its tightest | Watch both edges of the range closely |
| Bands snap open | Volatility returns, the move is on | Trade the direction of the break |
The squeeze pairs with the Bollinger Bands guide, which covers the settings. Most platforms use a 20-period average with the bands set two standard deviations out, written as (20, 2).
3. The breakout: trade the escape
Every consolidation ends the same way, with a breakout. Price closes outside the range and the sideways chop turns back into a trend.
This is the third way to trade a range, and often the biggest move of the three.
The catch is the false breakout, where price pokes past the level, sucks traders in, then snaps back into the range.
- The entry: a candle that closes outside the range, not just a wick that pokes through. The close is what separates a real break from a fakeout.
- The confirmation: on Bitcoin and crypto, a surge in real traded volume on the break adds conviction. On gold and Forex, the platform only shows tick volume, a proxy, so lean on the close instead.
- The target: project the height of the range in the direction of the break. A tall range breaks to a bigger move than a shallow one.
- The trap to avoid: chasing a wick. If price breaks and immediately falls back inside, it was a false breakout, so stand aside.
| What price does | Read | Action |
| Closes clearly outside the range | Real breakout | Trade the direction of the break |
| Wicks out, closes back inside | False breakout | Skip, or fade it back to mid-range |
| Breaks on a crypto volume surge | Strong breakout | Higher conviction on the entry |
| Breaks on quiet, thin volume | Suspect | Wait for the retest to confirm |
The escape from a range is a form of breakout trading, and the same rules apply: wait for the close, respect the retest, and let the range height set your target.
Consolidation across gold, Bitcoin and Forex
The same three strategies port across markets, but each instrument ranges a little differently, so it pays to know the personality of the one you trade.
| Market | When it ranges | Watch for |
| Spot gold (XAU/USD) | After a big run, before the next leg | Tick volume only, so read structure, not volume |
| Bitcoin (BTC/USD) | Between rallies and corrections | Real exchange volume confirms breakouts |
| EUR/USD, GBP/USD | Quiet sessions and ahead of news | The range holds until a data release cracks it |
| Silver, oil | Choppy, mid-cycle stretches | Wider, messier ranges with more fakeouts |
Two honest notes carry across all of them.
- Mean reversion needs a real range. The range bounce bets price returns to the middle, so it gets run over the moment a genuine trend starts. That is exactly why the ADX filter matters.
- Volume only counts on crypto. Gold and Forex platforms show tick volume, a count of price updates rather than money traded, so trade the levels and the candle closes there, not the volume bar.
Which timeframe to trade the range on
The chart you pick changes the range more than most people expect. A clean daily range can look like random noise on the 1-hour.
| Timeframe | Character | Best use |
| Daily (D1) | Wide, slow ranges that can last weeks | The core read, the cleanest support and resistance |
| 4-hour (H4) | Faster ranges, great for the squeeze | Active traders working intraday ranges |
| 1-hour (H1) | Ranges everywhere, mostly noise | Skip, or only to time an entry the D1 already set up |
There is a practical tell in that table.
- If every chart looks like a range, you have dropped to a timeframe where the edge is gone.
- More ranges is not more opportunity. It is the sign you are zoomed in on noise, so step back up a timeframe.
Decision table: which range strategy to use
Put the three strategies side by side and the choice becomes simple: read what price is doing and pick the tool that fits.
| What price is doing | Strategy to use |
| Bouncing cleanly between a floor and ceiling | Range bounce, fade the edges |
| Tightening, bands pinching, ADX very low | The squeeze, get ready for a breakout |
| Closing decisively outside the range | Breakout, trade the escape |
| Poking out then snapping back inside | False breakout, stand aside or fade it |
| ADX rising above 25 | The range is over, switch to trend tools |
Common mistakes in range trading
Most losing range trades come from the same short list of errors.
- Trading the middle of the range. The edge only lives at the extremes. A trade taken in the middle has no clear stop and no clear target.
- Ignoring the ADX filter. Fading resistance in a strong uptrend is not range trading, it is fighting a trend, and the trend wins.
- Chasing the false breakout. A wick past the level is bait. Wait for the candle to close outside before you call it a breakout.
- Trusting tick volume on gold and Forex. A volume spike there is a proxy, not proof. Save the volume read for crypto.
- Setting the stop inside the range. A range bounce stop belongs just beyond the level, not tucked inside where normal chop will hit it.
Risk and discipline inside a range
Range trading feels safe because the market is quiet, and that is exactly the trap. Quiet ranges break hard, so the discipline matters as much as the setup.
- Risk a fixed slice per trade. Most traders keep it to 1 to 2% of the account on any single trade, and let the distance to the stop decide the position size, never the other way around.
- The range is only there until it is not. A consolidation ends with a breakout, so accept that your last bounce trade may get stopped as the range finally cracks. That stop is the cost of doing business, not a failure.
- Do not average into a losing bounce. If support breaks, the trade idea is dead. Adding to it is how a small range loss turns into a large trend loss.
- Step back after a run of stops. Three or four false breakouts in a row usually mean the market is transitioning out of the range. Stop trading the edges and wait for the new trend to show itself.
None of this needs a fancy system, just the same stop discipline every trade deserves, applied to a market that is lulling you to sleep.
What works: the short version
If you remember three things about consolidation in trading, make it these.
- Confirm the range first. Flat support and resistance, ADX under 20, shrinking candles. All three together, and you are genuinely range-bound.
- Match the strategy to the moment. Bounce the clean edges, watch the squeeze for a coiling market, and trade the breakout when price closes outside the range.
- Respect the break. Every range ends. Keep stops tight beyond the levels, ignore the wick fakeouts, and switch to trend tools the moment ADX climbs back above 25.
A range is not a dead market. It is a market getting ready, and reading it well means you are already positioned when it finally moves.
Glossary
- Consolidation: a market moving sideways between support and resistance after a trend, a pause rather than a reversal.
- Trading range: the band between the floor and ceiling that price chops inside during a consolidation.
- Support: the floor level where buyers keep stepping in and price tends to bounce.
- Resistance: the ceiling level where sellers keep stepping in and price tends to stall.
- ADX: the Average Directional Index, a line that measures trend strength; below 20 signals no trend, the mark of a range.
- Bollinger Bands: two lines set a distance above and below a moving average; they pinch tight when volatility falls.
- Squeeze: a Bollinger Band pinch to its narrowest, a warning that a breakout is building.
- Breakout: a decisive close outside the range that ends the consolidation and starts a new move.
- False breakout: a poke past the range that snaps back inside, trapping traders who chased it.
- Mean reversion: trading on the idea that price returns toward the middle of the range, the logic behind the range bounce.
- Tick volume: a count of price updates shown by gold and Forex platforms in place of real traded volume.
FAQ
What is consolidation in trading?
Consolidation in trading is when a market stops trending and moves sideways, trapped between a support floor and a resistance ceiling. Price chops back and forth inside that band instead of going anywhere. It is a pause rather than a reversal, a rest stop where buyers and sellers sort out control before the trend continues or turns. Traders also call it a trading range or a range-bound market, and it is one of the most common states a chart is ever in.
How do you trade a range-bound market?
There are three clean ways. You can fade the edges by buying near support and selling near resistance, targeting the far side of the range. You can watch a Bollinger Band squeeze tighten and get ready for the eventual breakout. Or you can trade the breakout itself when price closes decisively outside the range. Match the strategy to what price is doing: bounce the clean edges, watch the squeeze when the range coils, and trade the escape when it breaks.
What is the difference between consolidation and a reversal?
A consolidation is a pause that usually leads back into the existing trend, while a reversal is a genuine change of direction. During consolidation price ranges sideways with no clear winner. In a reversal, price forms a top or bottom and then trends the other way. You only know which one you had after price breaks out of the range, so most range traders wait for that break instead of guessing the direction early.
What ADX level shows consolidation?
An ADX reading below about 20 to 25 signals consolidation. ADX, the Average Directional Index, measures how strong a trend is rather than its direction. When the line sits low and flat under 20, there is no dominant trend, which is the fingerprint of a range-bound market. Traders often wait for ADX to climb back above 25 before trusting a trend trade, because a low ADX means trend-following signals will mostly fail.
Is consolidation bullish or bearish?
Neither on its own. Consolidation is a neutral, sideways state where the market is resting. Its bias comes from the breakout: a close above the range points bullish, a close below points bearish. That said, a consolidation inside a strong prior uptrend more often breaks upward as a continuation, and a range inside a downtrend more often breaks down. The safest read is to wait for the actual break rather than assume a direction.
How long does consolidation last?
It varies with the timeframe. A consolidation on the 1-hour chart might last hours, while a daily range can hold for weeks. There is no fixed length, but a useful rule is that the longer and tighter a range gets, the bigger the breakout tends to be when it finally comes. That is the logic behind the squeeze: a long, quiet consolidation is a market storing energy for its next move.
What is the best indicator for range trading?
There is no single best one, but a good pairing is horizontal support and resistance to mark the edges, ADX to confirm there is no trend, and Bollinger Bands to spot a squeeze. Support and resistance give you the trade zones, ADX under 20 confirms you are actually in a range, and the Bollinger squeeze warns you when the range is coiling for a breakout. Used together they cover both trading the range and catching its end.
What is a false breakout and how do I avoid it?
A false breakout is when price pokes past support or resistance, tempts traders in, then snaps back inside the range. You avoid most of them by waiting for a candle to close outside the range rather than acting on a wick that only touches the level. On crypto you can also lean on a real volume surge to confirm a break, while on gold and Forex you rely on the close because those platforms only show tick volume, a proxy rather than real traded volume.
🌍 Our recommended brokers


Reader Reviews
Be the first to review this — tell other traders what actually helped, or where it fell short.
Leave a Review

Forex Analyst & Senior Trader
Former FX desk trader with 8 years in institutional forex. Works in multi-timeframe analysis and order flow, turning desk experience into systematic, testable rules across forex and metals.