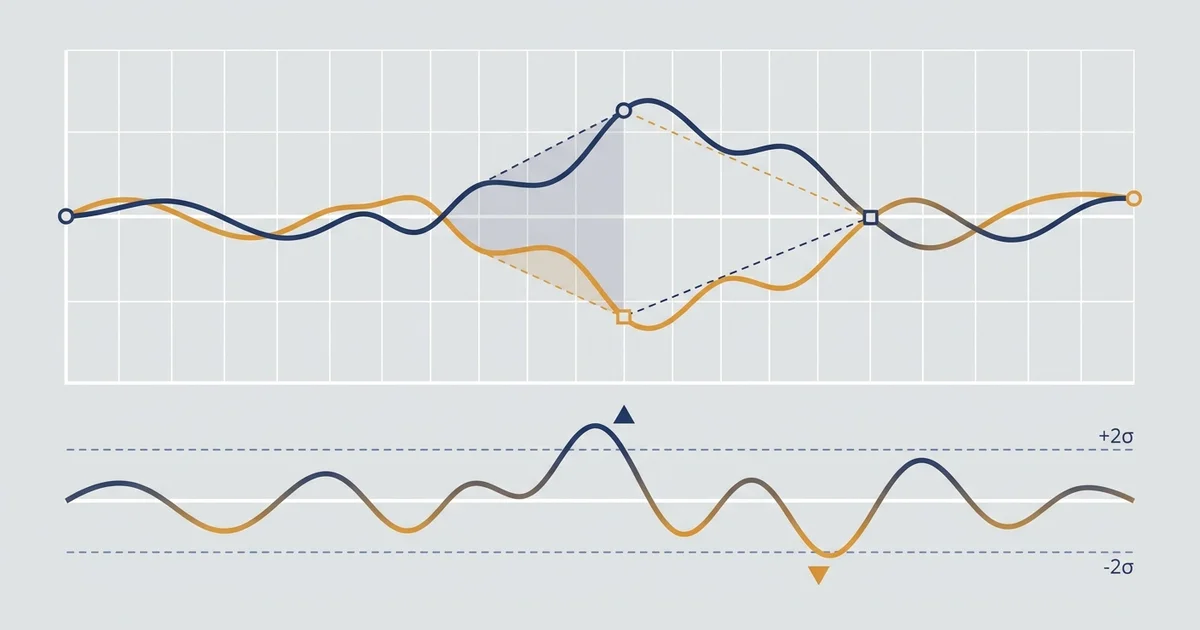

What pairs trading actually is
Most strategies pick a direction. Pairs trading refuses to.
You hold two positions at once, long one instrument and short a related one, and you profit when the distance between them closes.
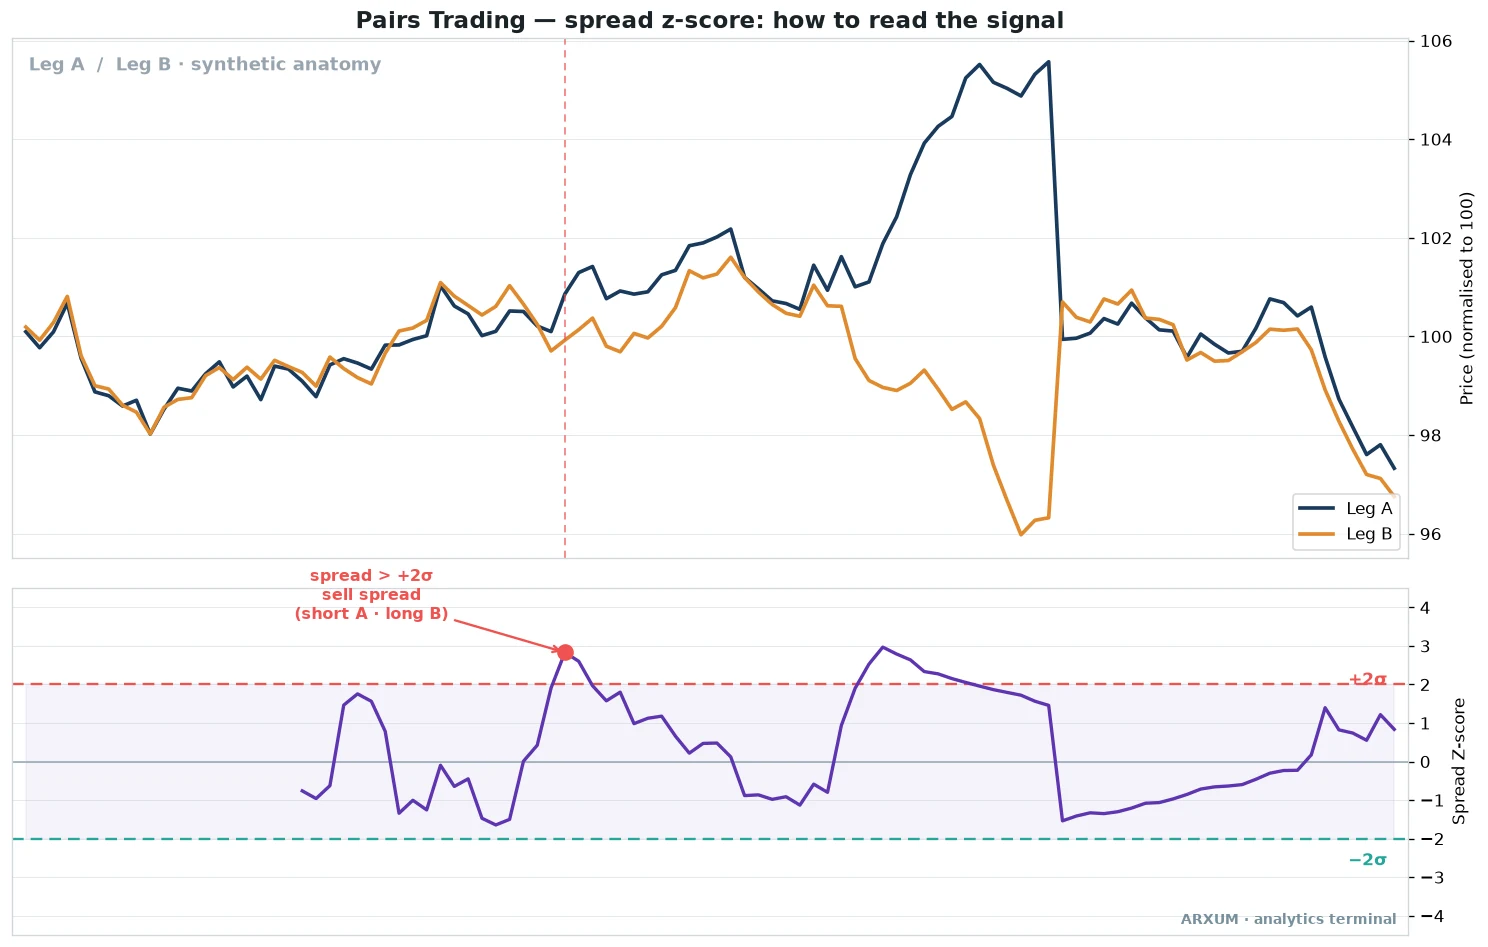
Read the chart above from the bottom panel up. The two price lines wander together for a while, then Leg A rips higher while Leg B stalls.
That gap is the spread, and the z-score in the lower panel measures how unusual it is.
- The z-score is just the spread measured in standard deviations from its own average. A standard deviation is a way of measuring how unusual a move is, so two of them is genuinely rare. Zero means the pair is at its normal distance apart.
- +2 sigma (the red line) means the spread is stretched wide, wider than it usually gets. Leg A has run too far ahead of Leg B.
- -2 sigma (the teal line) is the mirror image. The spread has collapsed, so Leg A is unusually cheap against Leg B.
- The shaded band between the two lines is the normal zone. Most of the time the spread lives in here, which is why you only act at the edges.
- The bet is that a stretched spread snaps back toward zero. You fade the extreme and wait for the convergence.
You are not asking “will gold go up.” You are asking “have these two drifted too far apart, and will they close the gap.” That is the whole idea.
The core mechanic, in one table
Two setups, two mirror actions. The exit is the same either way: the spread coming home.
| Spread reads | What it means | The trade |
|---|---|---|
| Above +2 sigma | Leg A too rich vs Leg B | Sell the spread: short A, buy B |
| Below -2 sigma | Leg A too cheap vs Leg B | Buy the spread: long A, short B |
| Back near zero | Pair converged | Close both legs, take the gap |
“Buy the spread” and “sell the spread” trip people up. It just means the two-legged position as a whole.
Buying the spread is betting the gap widens in your favour by the cheap leg catching up; selling it bets the rich leg falls back. You always hold both legs at once.
Three ways traders run pairs trading
The core idea never changes. What changes is how you pick the pair and how you decide the spread is “stretched.” Three approaches cover most of what you will see.
1. The distance and z-score method
This is the one on the anatomy chart, and the one most beginners meet first. You rebase both instruments to the same starting point, measure the spread, and standardise it into a z-score.
Then you trade the ±2 sigma edges. It works like Bollinger Bands wrapped around the spread instead of price.
How it looks on a chart:
- Two lines that track each other closely, then pull apart and rejoin.
- A spread oscillator below that swings through a middle zone and pokes past the outer bands.
- Clean signals when the lines are genuinely tied together, messy ones when they are not.
| Role | How you use it | Best read |
|---|---|---|
| Entry trigger | Spread hits ±2 sigma | Fade the extreme |
| Exit cue | Spread returns toward zero | Close near the mean |
| Stop / bail | Spread runs past ±3 sigma | Relationship may be broken |
| Best fit | Quick screening | Any two correlated markets |
The catch is honest and worth stating up front. The z-score assumes the average spread is stable.
If the two instruments quietly stop moving together, the spread can push to +3, +4 sigma and keep going, and the “cheap” leg never catches up. That is the classic way a pairs trade bleeds.
2. The correlation method, in forex
Here you pick the pair first, using a rolling correlation coefficient, then trade the spread the same way. Forex is a natural home for this, because currencies share drivers.
Two dollar pairs, or a metal and a currency, often lean on the same macro story.
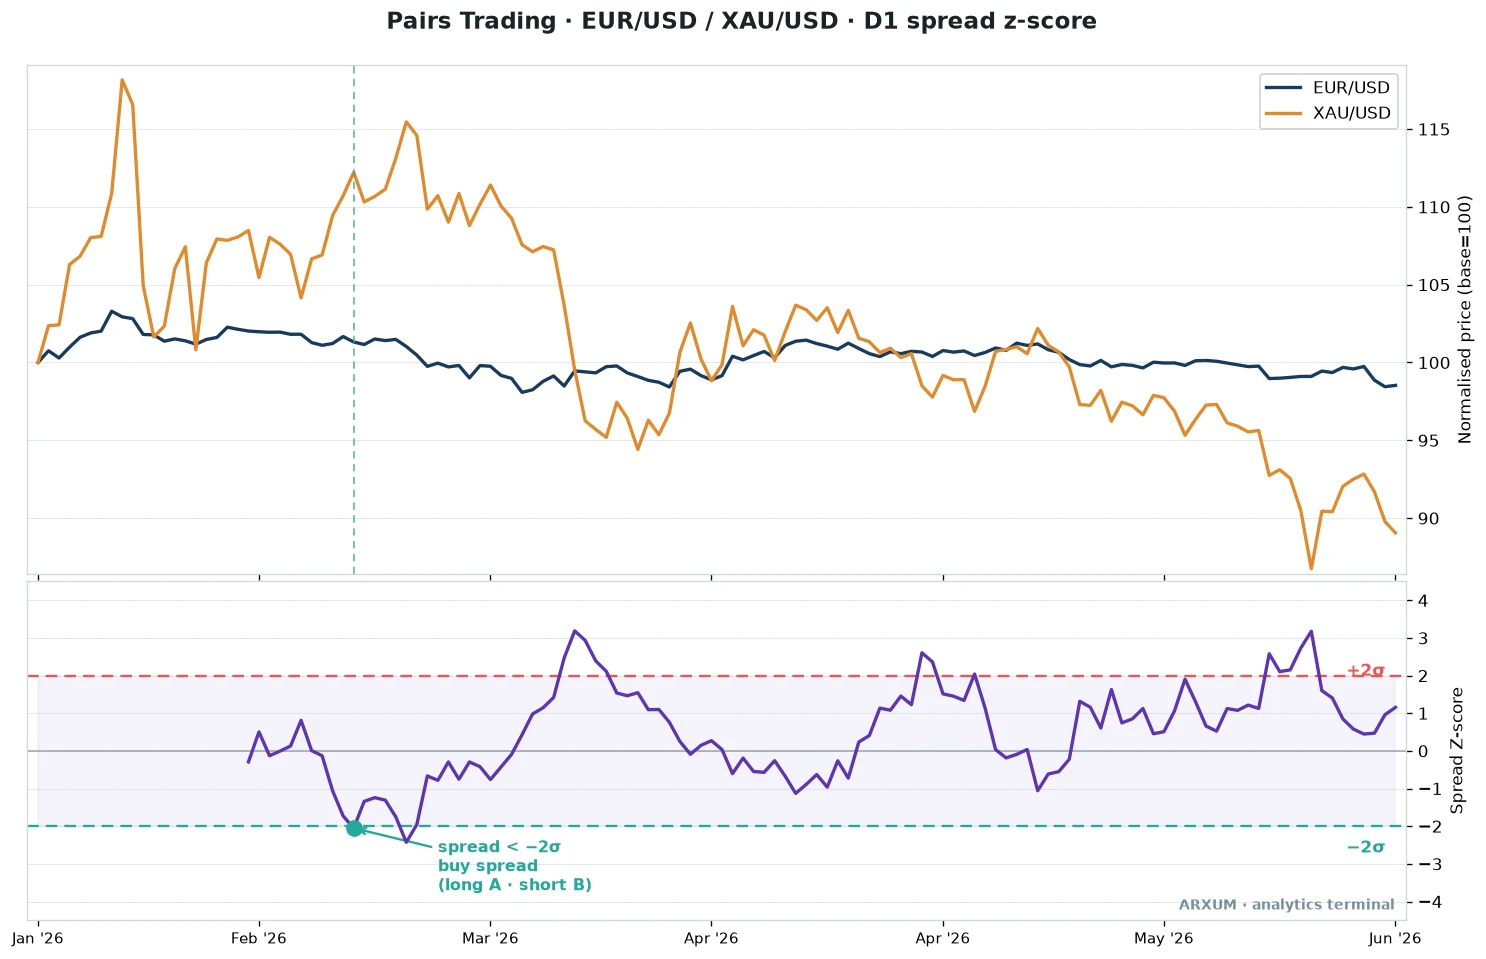
The chart below is deliberately a loose pair, so you can see what “too loose” looks like: EUR/USD against spot gold (XAU/USD) on the daily.
What the chart is really teaching:
- Gold went on a long one-way run while the euro sat flat. The two are related, but not glued together.
- The spread makes big, slow swings and touches both bands more than once.
- A signal here can stay stretched for weeks, so this pair rewards patience and punishes a tight stop.
| Role | How you use it | Best read |
|---|---|---|
| Pair selection | Rolling correlation coefficient | Trade pairs above roughly 0.8 |
| Regime read | Is the correlation holding | Falling correlation, stand aside |
| Timeframe | Daily or 4-hour | Slower bars, cleaner spread |
| Best fit | Forex crosses, sector pairs | Same-driver instruments |
Pairs trading in forex lives and dies on that correlation number. A pair of currencies that shares a central bank or a commodity link will hold together.
A macro pairing like the euro and gold drifts, so treat a chart like this one as a caution, not a green light. If you want the pieces of a good forex pair, the forex pairs guide covers how the majors relate.
3. Cointegration, and why crypto suits it
Correlation asks whether two markets move together day to day. Cointegration asks a stricter question: do they keep returning to a stable relationship over time, even if they wander in the short run.
It is the more rigorous test, and it is what serious desks lean on. Crypto majors are a good fit because they are driven by the same risk appetite and rarely decouple for long.
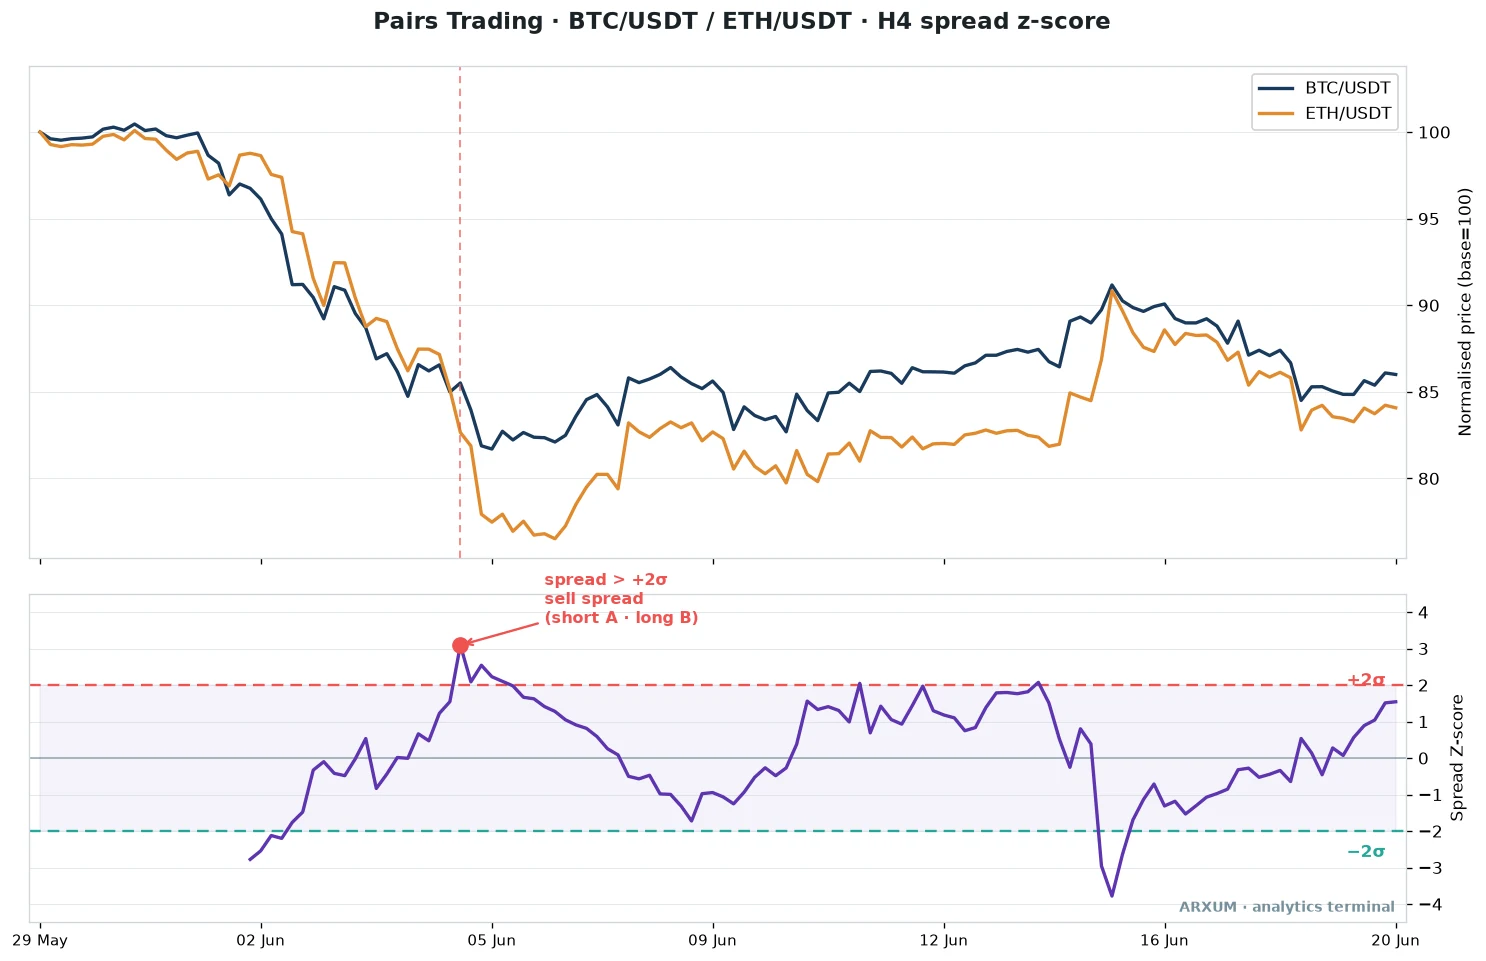
Here is Bitcoin (BTC/USDT) against Ether (ETH/USDT) on the 4-hour.
Why this is the textbook version:
- The two lines are almost stitched together, so the spread is well-behaved.
- When it hits +2 sigma it actually comes back, rather than trending away.
- Crypto trades around the clock, so there are no session gaps to distort the spread.
| Role | How you use it | Best read |
|---|---|---|
| Pair selection | Cointegration test on history | Stable long-run relationship |
| Entry trigger | Spread hits ±2 sigma | Fade the tighter the better |
| Confirming gauge | Correlation still high | Both tests agreeing |
| Best fit | Crypto majors, index pairs | Instruments that rarely decouple |
Pairs trading in crypto is popular for a reason. The majors are so tied to one risk cycle that the spread genuinely mean-reverts, which is the behaviour the strategy needs.
The trade-off is that funding costs on a short leg and the odd violent decoupling can still catch you.
How a pair fits together, by role
Whichever method you use, the moving parts do the same jobs. Reading a pair by role, rather than as one signal, is what keeps you out of a broken relationship.
| Role | How you use it | What good looks like |
|---|---|---|
| Entry trigger | Spread stretched to ±2 sigma | A clear, rare extreme |
| Regime read | Rolling correlation of the legs | Still moving together |
| Confirming gauge | Cointegration over history | Relationship returns to mean |
| Filter / context | News on a single leg | No standalone story on one side |
| Exit cue | Spread back toward zero | The gap closes, you are done |
Skip the filter and you learn the hard way. If one leg has its own catalyst, an earnings miss, a rate decision, a protocol upgrade, the pair is no longer trading its spread.
It is trading that one story, and your market-neutral hedge is suddenly a naked directional bet.
Which method to use when
A quick way to choose, from fastest to most rigorous.
| Method | Picks the pair by | Best for |
|---|---|---|
| Distance / z-score | Standard deviation of the spread | Screening, first pairs |
| Correlation | Rolling correlation coefficient | Forex crosses, sector pairs |
| Cointegration | Long-run statistical relationship | Crypto majors, index pairs |
Most people start with the z-score because it is visual and needs no coding. The correlation and cointegration checks are the upgrades that stop you trading a pair that only looked related.
You do not have to pick one forever. The z-score is your screen; correlation and cointegration are the checks you run before you trust it.
How to place a pairs trade
The mechanics, without the jargon. No numbers to memorise, just the sequence.
- Pick two instruments that normally move together, and confirm it with a rolling correlation.
- Build the spread, either the ratio of the two prices or the difference once both are rebased.
- Turn the spread into a z-score so you can see when it is unusually wide or narrow.
- Wait for the z-score to reach about +2 or -2. Below that, there is no edge, just noise.
- At +2, short the leg that ran ahead and buy the one that lagged, in roughly equal dollar value.
- At -2, do the reverse.
- Close both legs when the z-score comes back near zero. Do not hold out for the opposite extreme.
- Bail early if the correlation breaks or one leg gets its own news. A broken pair does not converge.
The equal dollar value in step five is the part beginners skip. On a small account, say $700, that might mean roughly $300 on the long leg and $300 on the short one, kept even in dollars.
Market-neutral only works if the two legs are balanced by size, so a broad market move really does cancel out. Weight one leg heavier and you have quietly built a directional trade with extra steps.
One more expectation to set. The ±2 sigma edge is rare by design, so plan for only a handful of setups and do not force a trade while the spread sits in its normal zone.
Where pairs trading breaks
The honest limitations, because this strategy fails in specific, predictable ways.
- The correlation snaps. Two markets that moved together for a year decouple, the spread trends instead of reverting, and the “cheap” leg never catches up. This is the number one killer.
- A single leg gets its own story. News on one instrument turns your hedge into a naked bet on that one thing.
- You pay two spreads and two sets of costs. Every pairs trade is two positions. On tight-margin pairs, the round-trip cost can eat most of a small convergence.
- Financing on the short leg. When you short something you are effectively borrowing it, and you pay a small daily fee to hold that short. Over days or weeks it grinds against a slow-converging trade.
- It caps your upside on purpose. Because you are hedged, a huge one-way move you would have loved to ride passes you by. Market-neutral cuts both tails.
None of this makes pairs trading bad. It makes it a specialist tool.
It shines in choppy, sideways markets where a directional strategy struggles, and it lags badly in a strong one-way trend, the exact mirror of a breakout system.
What to remember
A pairs trading strategy comes down to three things.
- Trade the spread, not the market. You are betting two related instruments converge, not that either one goes up.
- Pick the pair with care. Correlation and cointegration are what separate a real pair from two charts that happened to rhyme.
- Respect the ±2 sigma edges and the exit at zero. The discipline is the edge, and a broken correlation is your cue to leave.
Pairs trading sits alongside the carry trade as one of the few genuinely market-neutral plays a retail trader can run. It will not make headlines, and that is the point.
It earns its keep in the quiet, ranging markets where everything else is spinning its wheels.
Reproduce these charts
You can build the spread on free tools without any code.
- On TradingView, type a ratio symbol straight into the search, for example
EURUSD/XAUUSDorBTCUSDT/ETHUSDT, to plot the pair as one line. Add the “Correlation Coefficient” indicator to watch the relationship, and a “Bollinger Bands” or standard-deviation study on the ratio to see the ±2 sigma edges. - On MT4 or MT5, open both instruments and use a spread or correlation indicator from the “Insert, Indicators” menu. There is no one-click ratio chart, so most traders eyeball the two normalised lines side by side.
- The z-score panel itself is a custom calculation. If your platform does not ship one, a community script or a simple spreadsheet on the price difference does the job.
Key terms
- Spread: the gap between the two legs, either their ratio or the difference once rebased.
- Z-score: the spread measured in standard deviations from its average. Zero is normal, ±2 is stretched.
- Market-neutral: long one leg, short the other, so a broad market move cancels out.
- Correlation: how closely two instruments move together, scored from -1 to +1.
- Cointegration: a stricter test, whether two markets keep returning to a stable relationship over time.
- Convergence: the spread coming back toward its average, which is the profit in a pairs trade.
- Leg: one of the two positions in the pair.
FAQ
What is pairs trading, in plain terms?
How do you do pairs trading step by step?
Does pairs trading actually work?
What is the spread and the z-score?
How do you pick a good pair?
Can you do pairs trading in forex?
Is pairs trading good for crypto?
What is the difference between pairs trading and statistical arbitrage?
What is the best timeframe for pairs trading?
What are the main risks of pairs trading?
🌍 Our recommended brokers


Reader Reviews
Be the first to review this — tell other traders what actually helped, or where it fell short.
Leave a Review

Forex Analyst & Senior Trader
Former FX desk trader with 8 years in institutional forex. Works in multi-timeframe analysis and order flow, turning desk experience into systematic, testable rules across forex and metals.