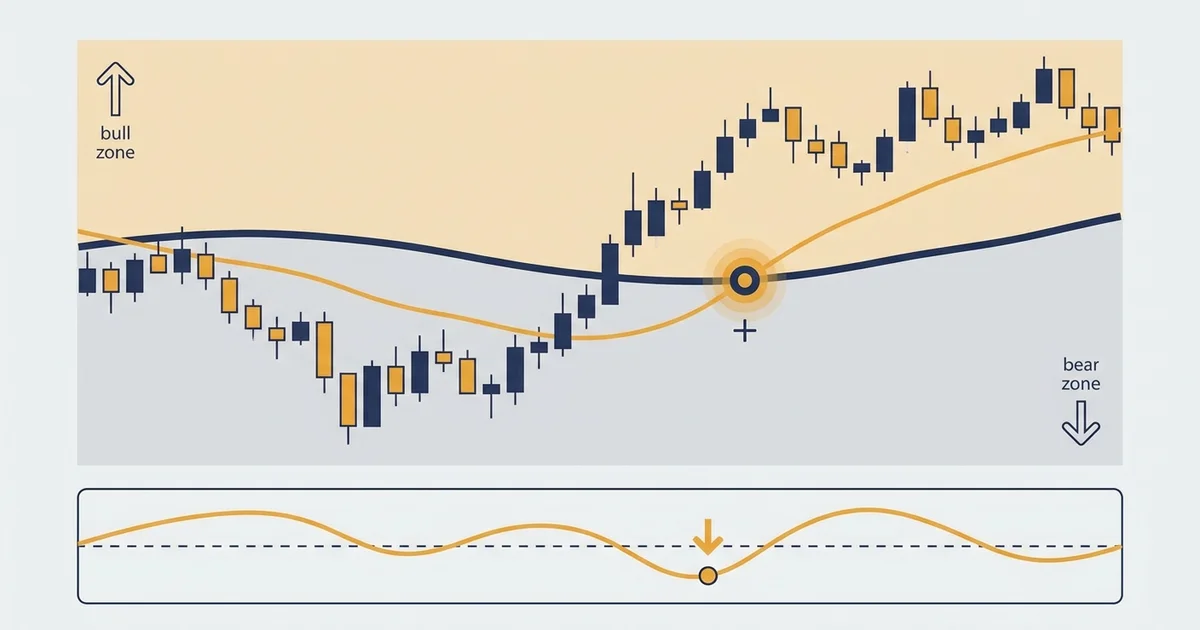

What market timing actually is
Market timing gets sold as calling tops and bottoms. That is the version that fails, and it is not what a working trader means by it.
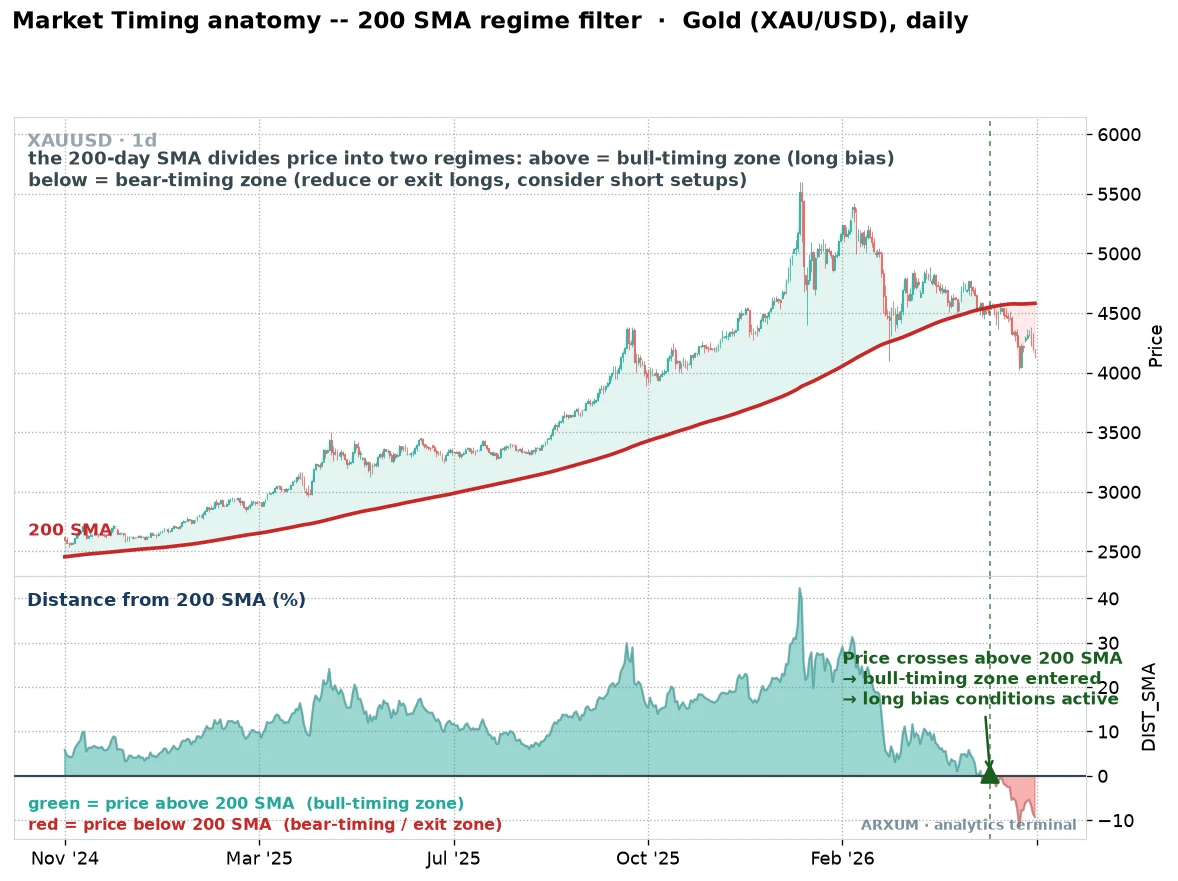
Read that gold chart from the price panel down. The thick red line is the 200-day moving average, the average close of the last 200 days, redrawn each day.
- Price above the 200-day line is the bull-timing zone. The bigger trend is up, so you time longs and treat dips as chances, not threats.
- Price below the line is the bear-timing zone. The trend has rolled over, so you cut long exposure and only a short setup earns your attention.
- The lower panel measures how far price sits from that average as a percentage. Deep green means a strong, stretched uptrend. Red means price has slipped under the line.
- The marked cross near the right edge is the moment price pushes back above the average and the read flips from bear-timing to bull-timing.
The one-line read: the first job of market timing is not the entry, it is knowing which side of the market you are allowed to trade at all.
The regime read in one glance
| What you see | The regime | What you do |
|---|---|---|
| Price above the 200-day MA | Bull-timing zone | Time longs, buy dips, ignore shorts |
| Price below the 200-day MA | Bear-timing zone | Cut longs, only short setups qualify |
| Price hugging the line, flat slope | No clear regime | Stand aside, the average is not helping |
| A clean cross of the line | Regime change | Flip your bias, wait for confirmation |
This is signal one, the slowest of the three and the one most worth learning first. It will not tell you when to click buy, only which playbook to open before you hunt a trigger, the same permission-slip job the ADX indicator does for trend strength.
Does market timing work, or should you just buy and hold
Here is the honest answer split by who is asking, because the two groups get opposite results.
| Kind of timing | Verdict | Why |
|---|---|---|
| Predicting the exact top or bottom | Poor | Nobody does it reliably, and being early looks the same as being wrong |
| Calendar guessing, gut calls | Poor | Emotion buys the top and sells the bottom, the classic retail trap |
| Regime and signal reading | Workable | You react to what the chart already shows, not to a forecast |
| Entry-window timing on a set signal | Workable | A rule picks the moment, so you skip the ones that do not qualify |
For a long-term investor, the data is blunt. Trying to jump in and out usually loses to simply staying invested.
- Studies of investor behavior, like Dalbar’s yearly report, keep finding the average investor badly underperforms the very funds they hold, mostly from mistimed buying and selling.
- Research on the stock market shows that missing only the ten best days across a couple of decades can cut a long-run return by roughly half, and those best days cluster right next to the worst ones.
- So for money you plan to hold for years, a steady buy-and-hold approach beats most timing attempts, full stop.
For an active trader, the goal is different, and that changes the verdict.
- You are not predicting the top. You are reading the current regime and timing an entry inside a move that is already underway.
- A signal, not a hunch, decides when you act, which strips out the emotion that sinks the investor above.
- Timing here means fewer, better entries, not calling the future. That version is a skill, and the rest of this guide is how it is built.
The takeaway: buy-and-hold wins the investing argument, and signal-based timing wins the trading one. They are not the same job, so stop comparing them.
The golden cross: timing a major trend shift
The golden cross is the classic slow market timing signal for a big trend change. It fires when the 50-day moving average crosses above the 200-day one, and traders read that as the tide turning bullish.
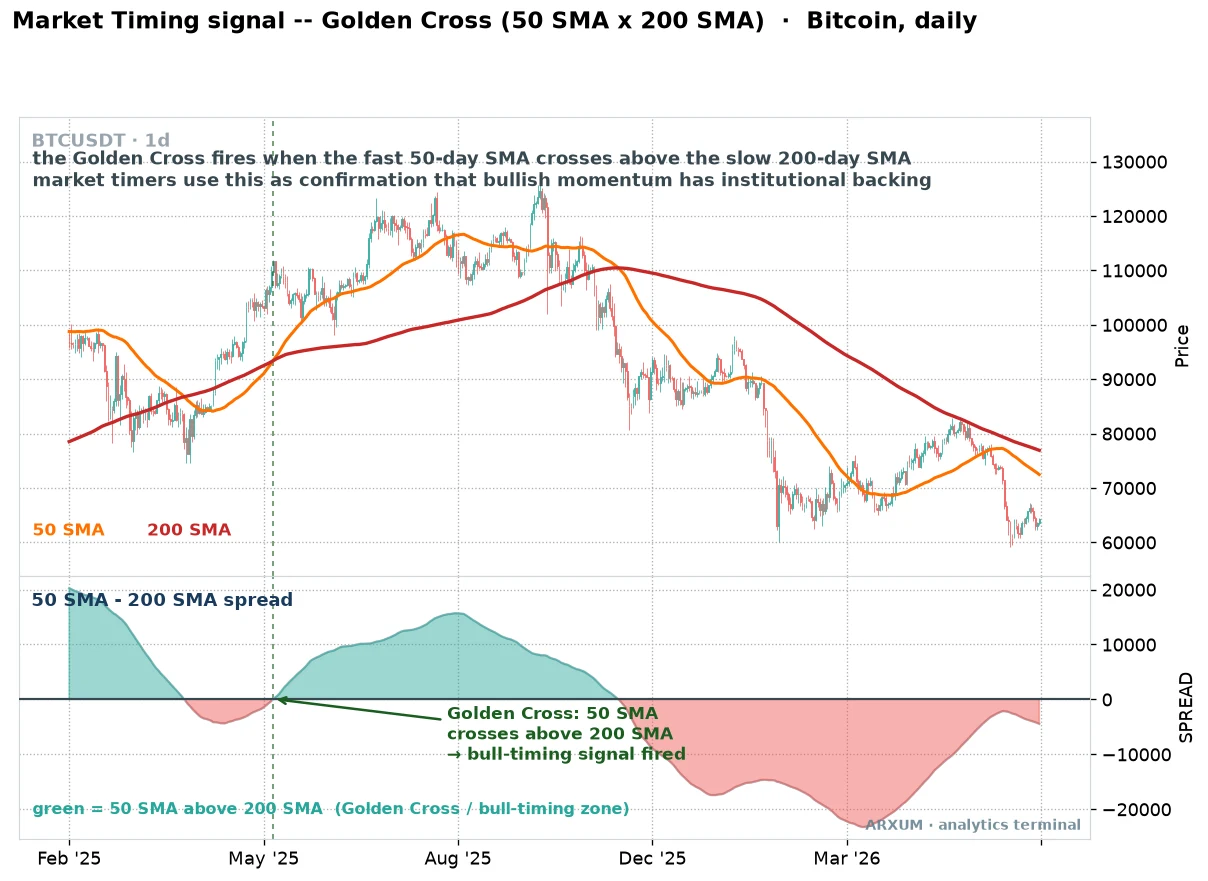
Read the Bitcoin chart around the dashed line. Before it the fast average sat below the slow one, and after it the fast average leads and the gap opens up green in the panel below.
How it looks:
- Golden cross: the 50-day average climbs above the 200-day one. Momentum has shifted, and buyers are setting the pace.
- Death cross: the opposite, the 50-day drops below the 200-day, the bearish version of the same signal.
- The spread panel shows the distance between the two averages. A widening green gap says the new trend has room, a shrinking one says it is tiring.
- The honest catch: it is a lagging signal. By the time the cross prints, a chunk of the move is already gone, so it confirms a trend rather than catching its birth.
This is a moving average crossover at heart, and it suits patient timing on the daily chart, not fast intraday calls.
| Role | How you use it | Best TF and market |
|---|---|---|
| Regime confirmation | Trust a bull bias once the 50 sits above the 200 | D1 on Bitcoin and gold |
| Trend direction | Long after a golden cross, short after a death cross | D1 on major Forex pairs |
| Exit warning | Trim as the spread panel shrinks toward zero | D1 and weekly, any market |
| Do not use it for | Precise entries, it lags too much for that | Any fast intraday timeframe |
The RSI oversold exit: timing the entry window
The regime read and the golden cross tell you the bias. This third signal times the actual entry inside that bias, using the RSI, a momentum gauge that runs from 0 to 100 and flags when a move has stretched too far.
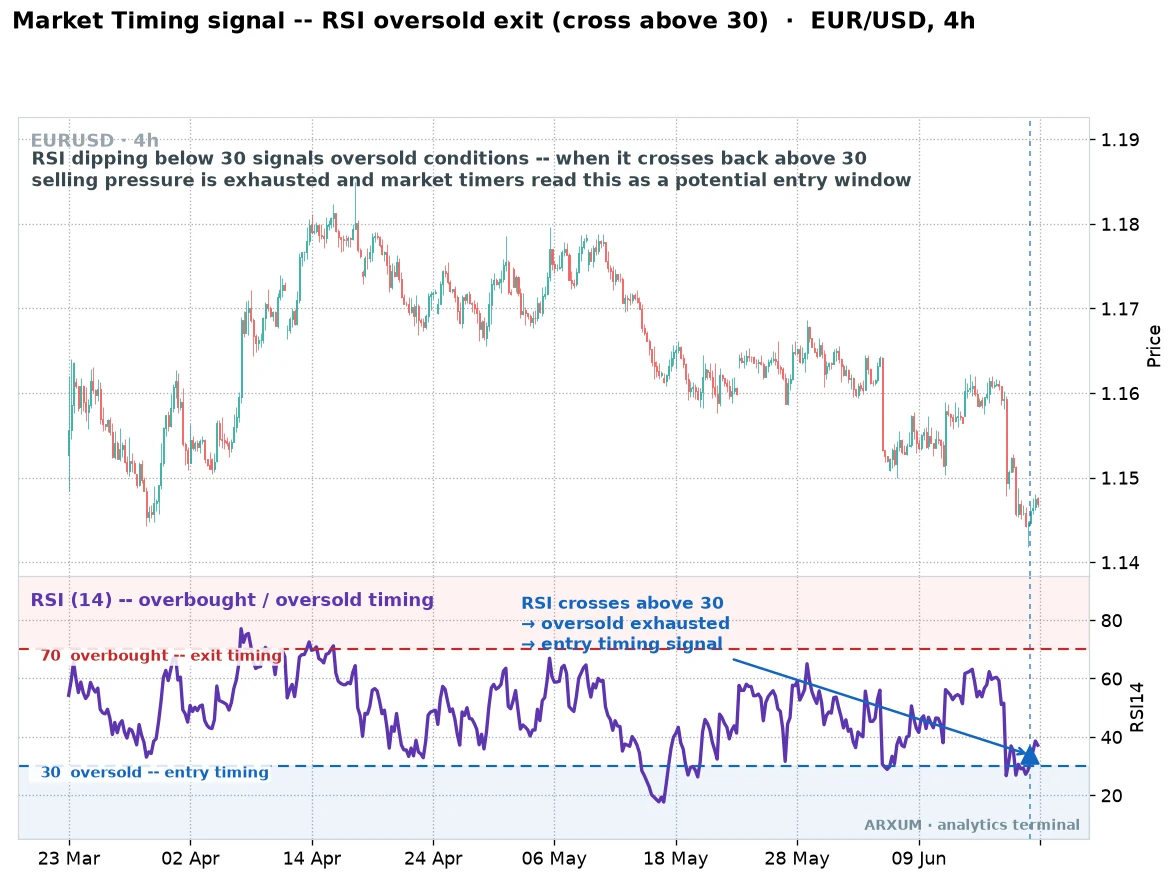
Read the EUR/USD panel. The RSI dips under the 30 line into oversold, then crosses back above it at the dashed vertical, which is the timing trigger.
How it looks:
- RSI below 30 is oversold. The recent selling is stretched, and a bounce becomes more likely, though not guaranteed.
- The cross back above 30 is the entry-timing signal. It says the exhaustion is confirming, so you act on the turn rather than trying to catch the falling knife.
- RSI above 70 is overbought, the mirror image, where a long looks for the door and a counter-trend seller gets interested.
- The honest catch: notice how price keeps sliding at the right edge. A bare oversold bounce inside a downtrend often fails, which is exactly why this trigger needs the regime filter on top of it.
The rule of thumb: take the oversold cross only when the bigger regime already agrees, a long in a bull-timing zone, not against the trend. Alone it is a coin flip, filtered it is a timed entry.
| Role | How you use it | Best TF and market |
|---|---|---|
| Entry trigger | Buy the cross back above 30, but only with the trend | H4 and H1 on Forex majors |
| Exit cue | Trim longs as RSI pushes above 70 | H4 on gold and EUR/USD |
| Timing filter | Wait for oversold rather than chasing a runaway move | Any trending market |
| Do not use it for | A standalone reversal call in a strong downtrend | Fast, one-way sell-offs |
Which timing signal fits which job
The three are not rivals. They work at different speeds and answer different questions, so a trader stacks them rather than picking one.
| Signal | Speed | What it answers | Weakness | Fits best |
|---|---|---|---|---|
| 200-day MA regime | Slow | Which side am I allowed to trade | Not an entry on its own | D1 bias on gold and stocks |
| Golden cross | Slow | Has the big trend turned | Lags, misses the first leg | D1 swing bias on Bitcoin, FX |
| RSI oversold exit | Fast | When is the entry window | Fails against the trend | H4 and H1 entries on majors |
A few plain rules drawn from that table:
- Slow signals set the bias, fast signals set the entry. Never let a fast RSI trigger override a slow regime that disagrees with it.
- Two slow signals rarely conflict. When the golden cross and the 200-day regime both read bull, the backdrop is as clean as timing gets.
- Gold and index-style trends reward the slow tools. Long one-way legs keep price on one side of the average for months, which is what these signals are built for.
- Crypto and Forex differ in speed. Bitcoin trends hard on the daily but chops intraday, while the quiet hours between London and New York leave Forex signals flat and false.
Stacking the three: a simple market timing framework
The best market timing strategy is not one clever signal. It is a short stack where each layer has to agree before you act, the same logic behind confluence trading.
Here is the framework in order, slow to fast.
| Step | The check | The question it settles |
|---|---|---|
| 1. Regime | Price above or below the 200-day MA | Am I allowed to be long or short |
| 2. Confirmation | Golden cross agrees with the regime | Is the bigger trend actually turned |
| 3. Trigger | RSI oversold cross in the trend's direction | Is this a good entry window |
| 4. Risk | Stop and size set before the entry | What do I lose if it fails |
- The best time to enter a trade is when the slow layers already point one way and the fast trigger fires with them, not against them.
- Fewer trades is the feature, not a bug. Most days no clean stack forms, and standing aside is a timing decision too.
- Timing never replaces the stop. A signal picks the moment, your risk-reward plan decides whether the trade is worth taking at all.
- The same three ideas travel across markets. Swap the instrument and the timeframe, and regime plus confirmation plus trigger still reads the same way, which is why it suits swing trading on any liquid market.
Where market timing goes wrong
Most timing failures are not bad signals. They are the trader overriding them, so this is the short discipline layer.
- Predicting instead of reading. The moment you decide where the top is and trade for it, you are guessing, and the market does not care about your guess.
- Fighting the regime. Buying an oversold RSI in a clear bear-timing zone is the single most common way this blows up. The filter exists for a reason.
- Chasing after the signal is gone. If the entry window passed and you are jumping in late out of fear of missing it, that is emotion, not timing. Let it go and wait for the next stack.
- Overtrading a quiet market. No regime, no cross, no trigger means no trade. Forcing one in a flat range is how a timing plan bleeds out, which is more a psychology problem than a chart one.
The honest frame: these signals bias the odds, they do not remove risk. Trade only money you can afford to lose, expect losing streaks, and treat any run of failures as a sign the regime may have shifted rather than a reason to double down.
What works: three market timing rules to keep
If you keep only three things from this guide, keep these.
- Time the regime, not the top. Know which side of the 200-day average price sits on before anything else, and only trade that direction. Guessing the exact turn is the version that fails.
- Stack slow and fast. Let the golden cross and the regime set your bias, then let the RSI oversold cross time the entry inside it. One signal alone is a coin flip.
- Standing aside is timing. The plan tells you when not to trade as often as when to trade, and skipping the unclear setups is where the edge actually lives.
Market timing will never call a top or a bottom in advance, and anyone who claims it does is selling something. Used for what it is good at, reading the regime and timing a sensible entry, it turns a vague hunch into a repeatable process you can run on gold, Bitcoin or any Forex pair.
FAQ
What is market timing, in plain terms?
Does market timing work?
Is market timing better than buy and hold?
Can you time the market?
How do you time the market as a trader?
What are the best market timing indicators?
What is the best time to enter a trade?
What is the 200-day moving average rule?
Does market timing work the same way in crypto and Forex?
What do the key market timing terms mean?
🌍 Our recommended brokers


Reader Reviews
Be the first to review this — tell other traders what actually helped, or where it fell short.
Leave a Review

Forex Analyst & Senior Trader
Former FX desk trader with 8 years in institutional forex. Works in multi-timeframe analysis and order flow, turning desk experience into systematic, testable rules across forex and metals.