
What confluence in trading actually means
Confluence is just agreement. It is the moment several separate reasons to take a trade all line up at one price, at one time, on the same side.
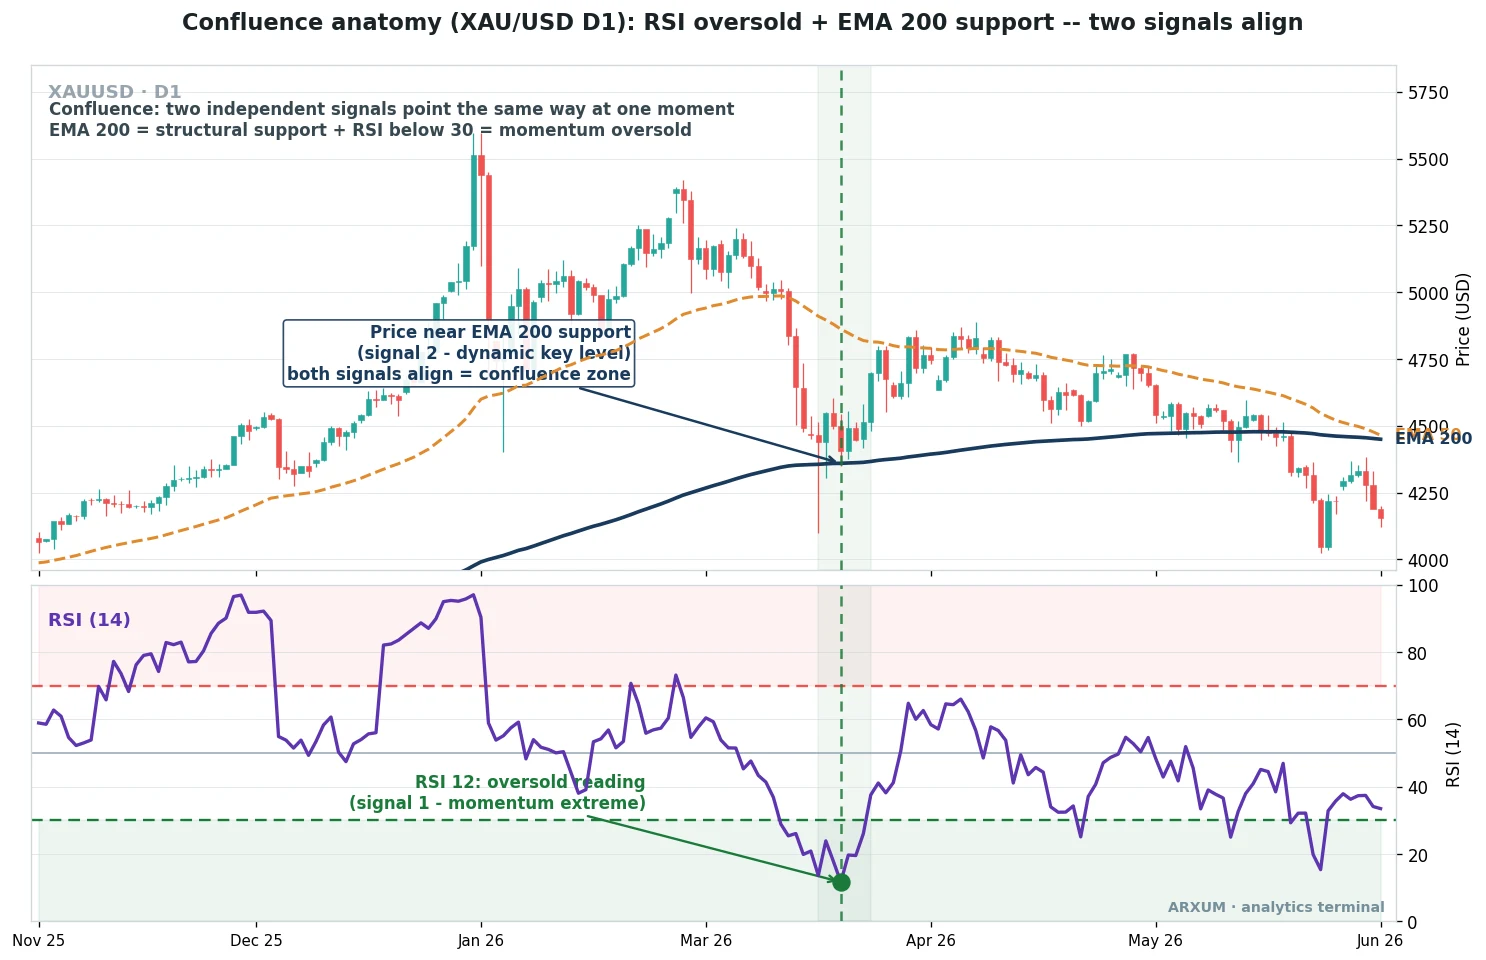
Read the gold chart above from the price panel down to the RSI panel below it.
- EMA 200 is the long navy line. An EMA is a moving average that weights recent prices more, and the 200 version marks the bigger trend and often acts as dynamic support.
- RSI (14) is the purple line in the lower panel. RSI is a momentum gauge that runs from 0 to 100, flagging oversold under 30 and overbought over 70.
- The confluence zone is where both fire at once: price taps the EMA 200 while RSI is under 30, so a level and a momentum extreme agree.
- Either signal alone is common and often fails. Both together is rarer, which is the whole point.
Confluence does not add magic, it filters. It throws away the setups where only one thing is talking, and keeps the ones where the chart tells you the same story twice.
Confluence in one glance
| Term | What it is | Plain read |
|---|---|---|
| Signal | One reason to trade | A hint on its own |
| Layer | A category of signal | Level, trend, momentum, and so on |
| Confluence zone | Where layers overlap | Several reasons meet at one price |
| Independent | Signals from different logic | The only kind that counts |
| Conviction | How many layers agree | More agreement, fewer trades |
The layers that create confluence
Confluence is built from layers, and each layer answers a different question about the trade. The trick is mixing layers that measure different things, so they can genuinely confirm each other.
Here are the five that do most of the work, and what each one adds.
| Layer | What it adds | How you use it | Best read |
|---|---|---|---|
| Support and resistance | A level that matters | Trade near it, not in open space | Higher timeframe, any market |
| Trend | The bigger direction | Trade with the EMA slope | D1 and H4 backdrop |
| Momentum | Is the move fresh or tired | RSI or MACD to time the turn | H4 and H1 for entries |
| Candlestick trigger | The exact entry bar | Confirm the level with a pattern | The entry timeframe |
| Volume | Conviction behind the move | Rising volume backs a breakout | Any, strongest on breakouts |
A few plain rules about the layers themselves:
- Mix categories, do not repeat one. A level plus a trend plus momentum is three independent reads. RSI plus Stochastic plus MACD is one read wearing three coats.
- Levels do the heavy lifting. Most strong confluence starts with a price level a lot of traders can see, like a prior swing, a round number, or a supply or demand zone.
- Momentum times it, it does not pick direction. Use the trend layer to decide long or short first, then let momentum tell you when.
- Volume is a tiebreaker, not a starter. It confirms a move that is already lined up, it rarely creates a setup on its own.
The one-line version: stack a level, a trend and a momentum read that all agree, and you have the backbone of almost every confluence setup below.
The three confluence trading setups traders actually use
These three cover most of what people mean by confluence trading, and each pairs two independent layers that read best on a different instrument and speed. Tap any row in the summary table further down to jump between them.
1. Trend plus momentum: EMA 50 with a MACD cross
This is the workhorse confluence setup for a trending market. You want the trend and the momentum turn to agree before you commit.
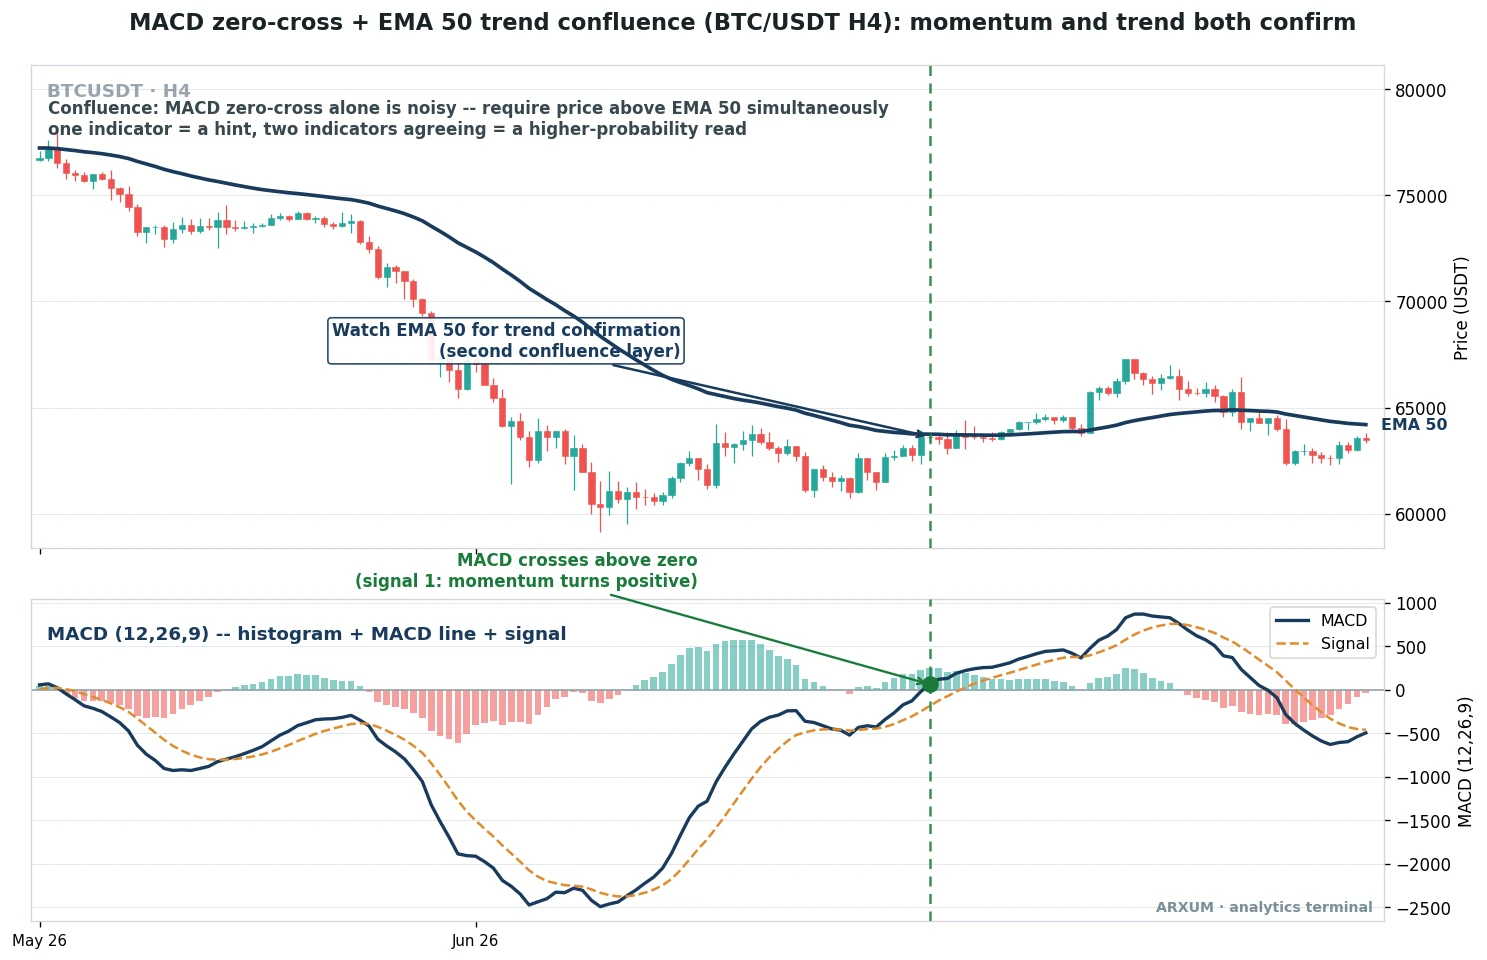
Read the Bitcoin chart around the dashed vertical line.
- EMA 50 is the navy line on price. Above it, the trend is up, and you only look for longs.
- MACD (12, 26, 9) is the lower panel. MACD tracks the gap between two moving averages, and a cross above its zero line means momentum has flipped positive.
- The confluence is both at once: price above EMA 50 and MACD crossing up. Either alone whipsaws in a chop.
How it looks:
- Price holds above a rising EMA 50, so the backdrop is bullish.
- The MACD line and its histogram push up through the zero line.
- The two align at roughly the same bar, marked by the vertical line.
- A MACD cross while price is below EMA 50 is ignored, because the layers disagree.
| Role | How you use it | Best read |
|---|---|---|
| Trend filter | Longs above EMA 50, shorts below | H4 on BTC, D1 on gold |
| Entry trigger | MACD zero-cross in the trend's direction | H4 on crypto and majors |
| Second gauge | MACD confirms the EMA slope is alive | Any trending market |
| Skip it | No trade when EMA 50 is flat | Low-volatility ranges |
The plain read: the EMA 50 says which way, the MACD says when. Two questions, two tools, one direction.
2. Signal plus filter: an EMA crossover confirmed by RSI
Here the pattern is a raw entry signal made reliable by a filter. A bare crossover fires too often, so a second condition has to agree before it counts.
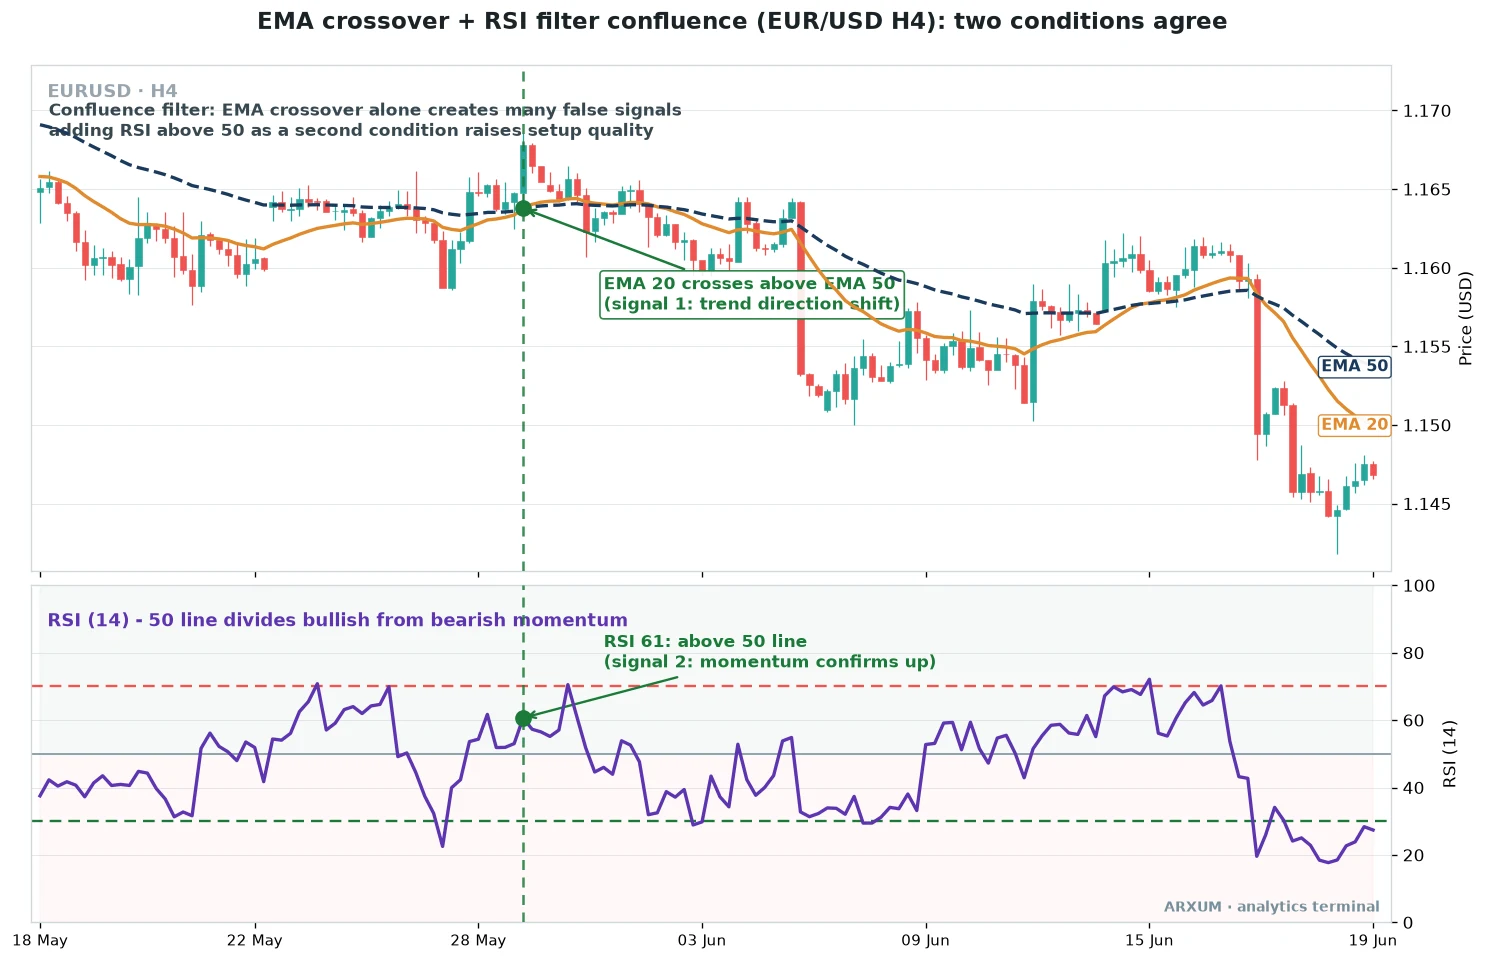
Read the EUR/USD chart at the dashed line and in the RSI panel beneath it.
- The signal is the faster EMA 20 crossing above the slower EMA 50, a shift in short-term trend direction.
- The filter is RSI holding above its 50 line, the level that splits bullish momentum from bearish.
- The confluence is taking the cross only when RSI already agrees, which cuts most of the losing crosses.
How it looks:
- The orange EMA 20 rises through the navy EMA 50 from below.
- At that same moment, RSI is above 50, so momentum backs the shift.
- If RSI were below 50 at the cross, you would stand aside.
- The 50 line, not the 30 and 70 extremes, is the one that matters for this filter.
| Role | How you use it | Best read |
|---|---|---|
| Entry signal | The EMA 20 and EMA 50 crossover | H4 and D1 on Forex majors |
| Confirming filter | Take it only with RSI past 50 | H4 on EUR/USD, GBP/USD |
| Direction call | Long above the 50 line, short below | Trending sessions |
| Avoid | Skip crosses when RSI sits at 50 | Quiet, range-bound hours |
This is the cleanest confluence forex trading setup for beginners, because both tools are one click away and the rule is a simple yes or no. It also pairs naturally with a fuller two-indicator momentum strategy once you want more structure.
3. Level plus momentum: support meeting an oversold reading
The third setup is the one on the gold chart at the very top of this guide. It waits for price to reach a level that matters and for momentum to be stretched at the same time.
How it looks:
- Price pulls back into a known level, here the EMA 200 acting as dynamic support.
- RSI drops below 30, so momentum is oversold and the sellers may be spent.
- The bounce sets up in the direction of the bigger trend, not against it.
- A candlestick trigger at the level, like a pin bar or engulfing bar, gives the exact entry.
| Role | How you use it | Best read |
|---|---|---|
| Level | Static support or a dynamic EMA | D1 gold, weekly levels on FX |
| Momentum extreme | RSI under 30 long, over 70 short | D1 and H4 |
| Entry cue | A reversal candle at the level | The entry timeframe |
| Context filter | Trade the bounce with the trend | Trending or corrective markets |
The plain read: the level says where, the oversold RSI says the pullback is tired, and the candle says go. Three independent reasons, one entry.
This is also where confluence pays off in your reward-to-risk ratio, written 1:X, where the 1 is the distance to your stop and the X is how many times that risk you aim to make back. A tight level lets you place a close stop, so the same target becomes a bigger multiple of your risk.
How to score confluence before you trade
Confluence works best as a simple count. You are not looking for a perfect chart, you are checking how many independent layers agree before you risk anything.
| Layers agreeing | What it means | What to do |
|---|---|---|
| 1 layer | A lone hint | Wait, do not trade it |
| 2 layers | A decent read | Trade small, keep it tight |
| 3+ layers | High conviction | Your standard, full-plan trade |
| 3 that repeat | Fake confluence | Treat it as 1, not 3 |
How to find confluence in trading, step by step:
- Start with the trend. Mark the direction on H4 or D1 with an EMA, and only hunt setups on that side.
- Mark the levels. Draw the obvious support and resistance, round numbers and zones where price has turned before.
- Wait for price to reach a level. No level, no trade. Open space is where confluence goes to die.
- Add a momentum read. Check RSI or MACD agrees with your direction at that level.
- Confirm with the entry bar. A candlestick trigger or a volume push is the final layer that says now.
- Three genuine layers is the sweet spot. Enough agreement to matter, few enough that you still take trades.
- More is not always better. Demanding five or six layers means you almost never pull the trigger, and you miss clean setups waiting for perfection.
- Write the checklist down. A fixed count stops you talking yourself into a one-layer trade on a slow afternoon.
Which confluence setup fits which market
The three setups are not rivals. You pick by what the market is doing and how fast you want to trade.
| Setup | What it needs | Strength | Weakness | Fits best |
|---|---|---|---|---|
| Trend + momentum | A clean trend | Rides big moves | Whipsaws in a range | H4 crypto, D1 gold |
| Signal + filter | A trend shift | Simple yes or no | Late on fast turns | H4 Forex majors |
| Level + momentum | A key level, a pullback | Great reward-to-risk | Needs patience | D1 gold, swing FX |
A few rules of thumb from that table:
- Trending markets suit setup one. Gold on the daily and Bitcoin on the 4-hour run in long legs, which is where a trend-plus-momentum stack shines.
- Ranging majors suit setup three. When EUR/USD chops between levels, the level-plus-oversold bounce reads better than chasing a crossover.
- Slower is safer for all three. Confluence reads cleaner on H4 and D1 than on the 15-minute, where every layer flickers.
- Match the tool to the regime. Trend up, ride pullbacks. Stuck in a range, fade the edges of trading confluence zones where levels and momentum meet.
The mistake that kills confluence: correlated signals
The most common confluence trap is stacking tools that all measure the same thing. It feels like three confirmations, but it is really one signal repeated, so it adds false confidence, not real edge.
What indicators create confluence, and what only pretends to:
| Looks like confluence | Really is | Why |
|---|---|---|
| RSI + Stochastic + CCI | One momentum read | All three track momentum |
| EMA + MACD + Bollinger | Mostly one trend read | All built on moving averages |
| Level + trend + momentum | True confluence | Three different logics |
| VWAP + swing level + RSI | True confluence | Two levels, one momentum |
- Pick one tool per job. One trend gauge, one momentum gauge, one level. Adding a second oscillator tells you nothing new.
- Independence is the whole test. Ask what each signal is actually measuring. If two answer the same question, count them once.
- Do not force it. If only one real layer is present, the honest move is to wait, not to bolt on a correlated indicator to feel better.
- Price levels are the anti-correlation anchor. A support or resistance level is independent of any indicator, which is why it belongs in almost every stack.
How to build a confluence check on your charts
You do not need paid tools. The three setups above use free, one-click indicators on any platform.
| Platform | What to add | Setting |
|---|---|---|
| TradingView | "Moving Average Exponential" | Length 50 and 200 for trend |
| TradingView | Add "RSI" and "MACD" | RSI 14, MACD 12, 26, 9 |
| MetaTrader 4 and 5 | Insert, Indicators, Trend and Oscillators | EMA, RSI and MACD ship built in |
Two honest notes on setup:
- On TradingView the plain “Moving Average Exponential” is the EMA, so add it twice at length 50 and 200, then add RSI and MACD from the same indicators menu.
- On MetaTrader all three are native, so you build the whole stack without hunting a custom script, unlike some tools such as the rolling VWAP.
Layer them in order: trend first, then the level by hand, then momentum on top. If you want a starting shortlist of tools by speed, the guide to the best indicators for your timeframe is a good next stop.
What works: three things to remember
If you keep only three points from this guide, keep these.
- Confluence is agreement between independent signals. A level, a trend and a momentum read pointing the same way beats any single indicator, no matter how good.
- Independence is the test that matters. Three momentum oscillators are not confluence, they are one opinion tripled. Mix different categories or you are fooling yourself.
- Three layers is the sweet spot. Enough to raise quality, few enough that you still take trades. Chasing six perfect signals means you never click buy.
Confluence will not make a bad trade good, and it will not remove losing streaks, because no filter does. What it does is cut the marginal setups and leave you trading fewer, cleaner charts.
Risk the same small slice per trade, size to your stop, and let the count of agreeing layers, not a gut feeling, decide when you are in.
FAQ
What is confluence in trading, in plain terms?
Confluence is agreement. It is the moment when two or more independent signals all point to the same trade, at the same price, in the same direction. A support level, a trend gauge and a momentum reading all lining up for a long is confluence. One signal on its own is just a hint, so confluence is a way of filtering down to the setups where the chart tells you the same story more than once.
How do I find confluence in trading?
Work top down. First mark the trend on the 4-hour or daily with a moving average, and trade only that direction. Then draw the obvious support and resistance levels. Wait for price to reach one of those levels, because no level means no trade. Then check that a momentum tool like RSI or MACD agrees with your direction, and finally confirm with the entry candle. When three of those layers line up, you have found confluence.
What indicators create confluence?
The best confluence mixes different categories, not the same one repeated. A trend tool like an EMA, a momentum tool like RSI or MACD, and a price level such as support, resistance or a supply and demand zone. Volume and a candlestick trigger add extra layers. The key is that each tool measures something different. Three momentum oscillators together are not confluence, because they all answer the same question.
Does confluence improve win rate?
It tends to raise the quality of your trades rather than promising a specific win rate. By demanding that several independent signals agree, you skip the marginal setups where only one thing is talking, which cuts a lot of noise. The trade-off is fewer trades, since you wait for alignment. It is a filter, not a guarantee, so you still get losing trades and losing streaks.
How many signals do I need for a confluence trade?
Three genuine, independent layers is the common sweet spot. One layer is just a hint and not worth trading. Two is a decent read for a smaller position. Three or more that come from different logic is a high-conviction setup. Be careful not to demand five or six, because you will almost never take a trade and you will miss clean setups while waiting for a perfect chart.
What is the most common confluence trading mistake?
Stacking correlated indicators and mistaking them for confirmation. RSI, Stochastic and CCI together look like three signals, but they all measure momentum, so it is really one read tripled. The same goes for piling on several moving-average tools. That builds false confidence. Real confluence mixes different categories, such as a level, a trend and a momentum reading, so each layer adds new information.
What is the best timeframe for confluence trading?
The 4-hour and daily charts for most traders. Confluence reads cleaner when the bars are slower, because levels, trend and momentum all mean more and flicker less. On the 15-minute or 5-minute, every layer snaps back and forth, so signals turn noisy and you get more false alignment. Confluence is a swing and intraday-swing tool first.
Does confluence forex trading work the same on crypto and gold?
The logic is identical across markets, because levels, trend and momentum behave the same way everywhere. The setups in this guide use gold, Bitcoin and EUR/USD for exactly that reason. What changes is the character: gold and Bitcoin trend in long legs that suit a trend-plus-momentum stack, while ranging Forex majors often suit the level-plus-oversold bounce. Pick the setup that matches how the market is moving.
Can I trade confluence with just two indicators?
Yes, and many traders do. The EMA-crossover-plus-RSI filter and the EMA-50-plus-MACD setups in this guide are both two-layer stacks, and they work because the two tools measure different things. Two independent signals are enough for a solid read. Just size the position a little smaller than a full three-layer setup, and make sure the two tools are not both momentum gauges in disguise.
What do the key confluence terms mean?
Confluence: agreement between independent signals at one price and time. Layer: a category of signal, such as a level, a trend, or momentum. Confluence zone: the spot where several layers overlap. Independent signals: tools that measure different things, the only kind that truly confirm each other. Conviction: how many layers agree, where more agreement means a higher-quality but rarer trade. EMA: a moving average that weights recent prices. RSI and MACD: momentum tools that time entries.
Real-time trade setups with entry, stop loss and take profit. Daily market analysis. No subscription, no complicated theory.
🌍 Our recommended brokers


Reader Reviews
Be the first to review this — tell other traders what actually helped, or where it fell short.
Leave a Review

Momentum Trader & Technical Analyst
Trades momentum across crypto and forex since 2019, built around RSI, MACD, and volume. Turns discretionary setups into rule-based, systematic entries and validates them on data before they go live.
