
What grid trading actually is
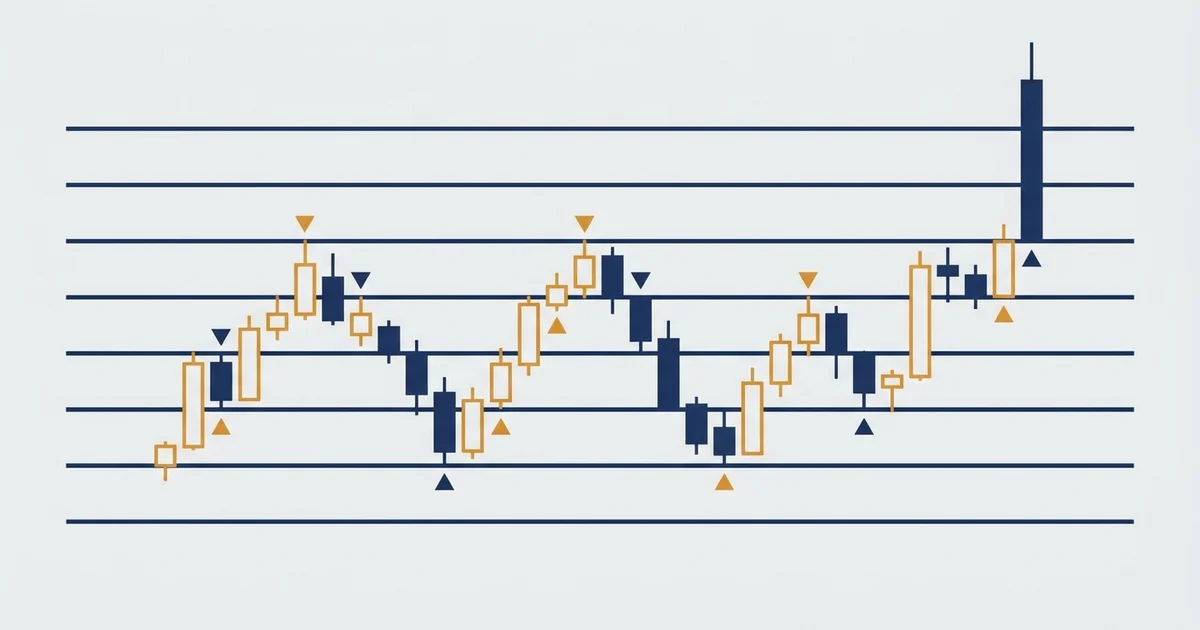
A grid is not a prediction. It is a ladder of price levels, spaced evenly apart, with a resting order waiting at each one.
You buy when price falls to a lower rung and sell when it rises to a higher rung, over and over, so the profit comes from the churn rather than from calling a direction.
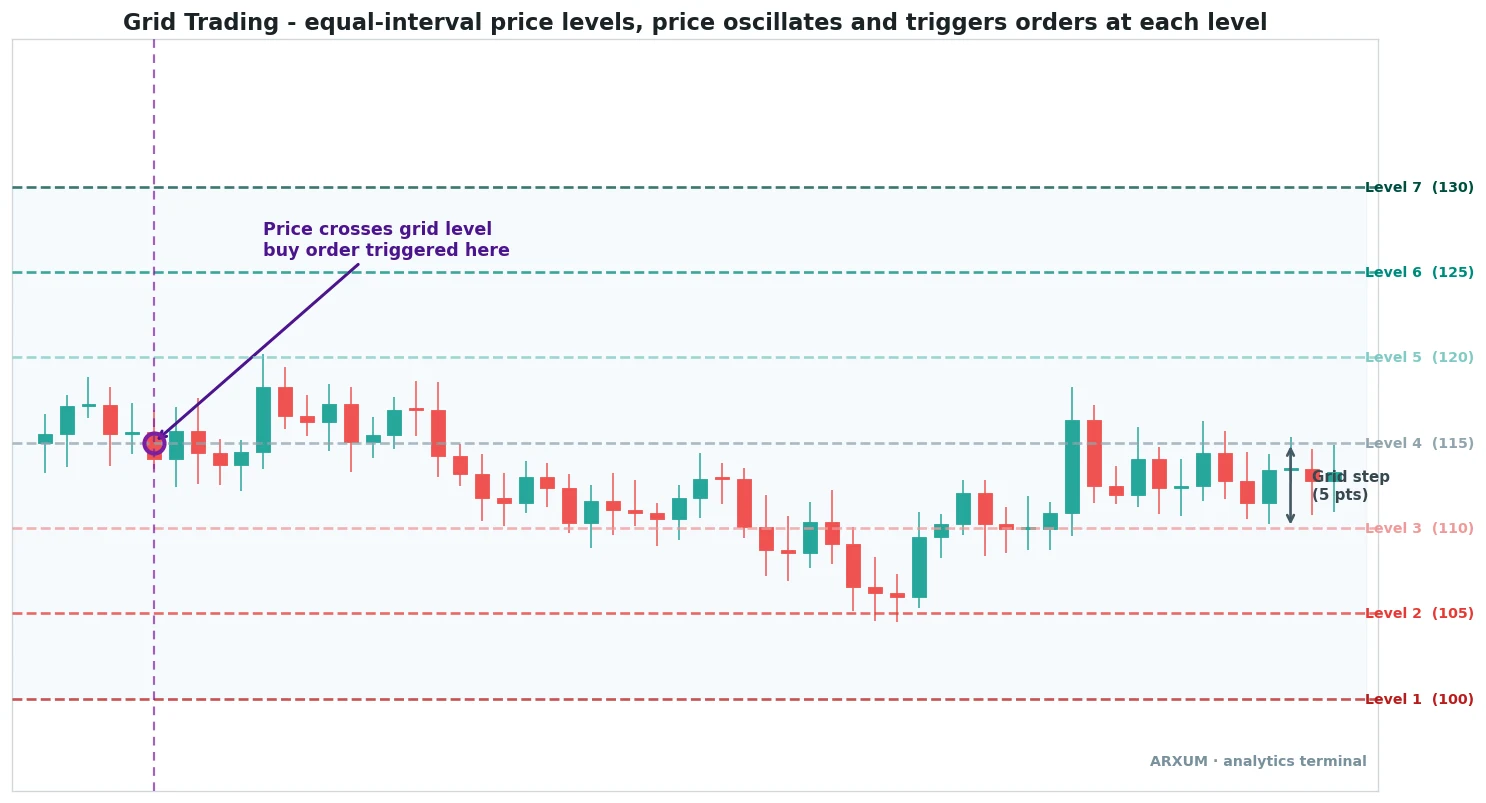
Read the chart above from the levels, not the candles. The horizontal dashed lines are the grid, and the candles just wander through them.
- The levels are the rungs of the ladder, drawn at a fixed spacing across the whole range.
- The grid step is the gap between two rungs, here 5 points. Wider steps mean fewer, bigger trades. Tighter steps mean more, smaller ones.
- A buy order rests at each level below price and fills when price drops onto it.
- A sell order rests at each level above price and fills when price rises onto it.
- The round trip is the pair that pays you: buy at one rung, sell at the rung above, pocket the step.
The one-line read: a grid turns a sideways, indecisive market into a stream of tiny, mechanical buy-low sell-high trades.
The grid in one glance
| Part | What it is | Plain read |
|---|---|---|
| Grid level | A fixed price rung with a resting order | Where a trade fires when price arrives |
| Grid step | The gap between two rungs | Wider is fewer, bigger trades |
| Upper bound | The top rung of the ladder | Above it the grid stops working |
| Lower bound | The bottom rung of the ladder | Below it the grid stops working |
| Round trip | A buy filled, then sold one step up | The small gain the grid harvests |
The parameters you set before the first order
A grid lives or dies on its settings. You are drawing a box around where you think price will chop, then deciding how finely to slice it.
Every grid, by hand or via a bot, asks for the same handful of inputs.
| Parameter | What it controls | How to think about it |
|---|---|---|
| Upper bound | Top of the range you expect | Set near recent resistance, not a round guess |
| Lower bound | Bottom of the range you expect | Set near recent support you trust to hold |
| Number of grids | How many rungs fit inside | More rungs, more trades, smaller each |
| Grid step | The spacing between rungs | Often tied to volatility, covered below |
| Order size per level | Capital committed at each rung | Total capital divided across all rungs |
| Grid mode | Neutral, long-only or short-only | Which side of the ladder is live |
Two settings do most of the damage when they are wrong:
- Bounds set too tight and price walks out the top or bottom within hours, and every remaining order is left underwater.
- Bounds set too wide and the steps stretch so far apart that price rarely reaches one, so the grid sits idle and earns nothing.
A common way to size the step is by volatility rather than a flat number. Tie the spacing to the average true range, the typical distance a market travels in a bar, so the grid breathes with the instrument instead of using the same gap on gold and on Bitcoin.
Arithmetic grid vs geometric grid
There are two ways to space the rungs, and the choice of arithmetic grid vs geometric grid mostly comes down to what you are trading.
| Arithmetic grid | Geometric grid | |
|---|---|---|
| Spacing rule | Same fixed amount between rungs | Same percentage between rungs |
| Example | Every 5 points apart | Every 1% apart |
| Rungs look | Evenly stacked on a normal chart | Evenly stacked on a log chart |
| Suits | Range-bound Forex, tight ranges | Wide-ranging crypto, big price swings |
| Weakness | Percentage shrinks as price climbs | Slightly harder to reason about by eye |
The plain-language split:
- Arithmetic keeps the dollar or pip gap constant. On EUR/USD moving between 1.16 and 1.17 it feels natural, since the percentage barely changes across that range.
- Geometric keeps the percentage gap constant. On Bitcoin swinging from 60,000 to 90,000 it is the honest choice, because a flat dollar step would be a huge percentage down low and a tiny one up high.
- Rule of thumb: narrow, stable ranges suit arithmetic, and wide, volatile assets suit geometric.
The three ways to run a grid
The grid mode decides which orders are live. Most platforms let you pick one, and the right pick depends on whether you have any lean on direction.
| Grid mode | What it does | When to use it |
|---|---|---|
| Neutral (two-way) | Buys below, sells above, both sides live | You expect pure range, no bias |
| Long-only | Only buys on the way down, sells to exit | Mild uptrend or accumulation |
| Short-only | Only sells on the way up, buys to exit | Mild downtrend, and you can short |
A few notes that matter more than they look:
- Neutral is the classic passive grid and the default on most bots. It is also the most exposed if price trends hard, because one side stacks up losers.
- Long-only behaves a lot like dollar-cost averaging with a sell rule bolted on, so it forgives a slow grind higher.
- Short-only needs a market you can actually sell, which on Forex and CFDs is just a sell order with no borrow, but on spot crypto often is not available at all.
Grid trading on Forex: the EUR/USD example
Forex majors spend long stretches going nowhere, which is exactly the diet a grid wants. A quiet, boxed-in EUR/USD is close to the textbook case.
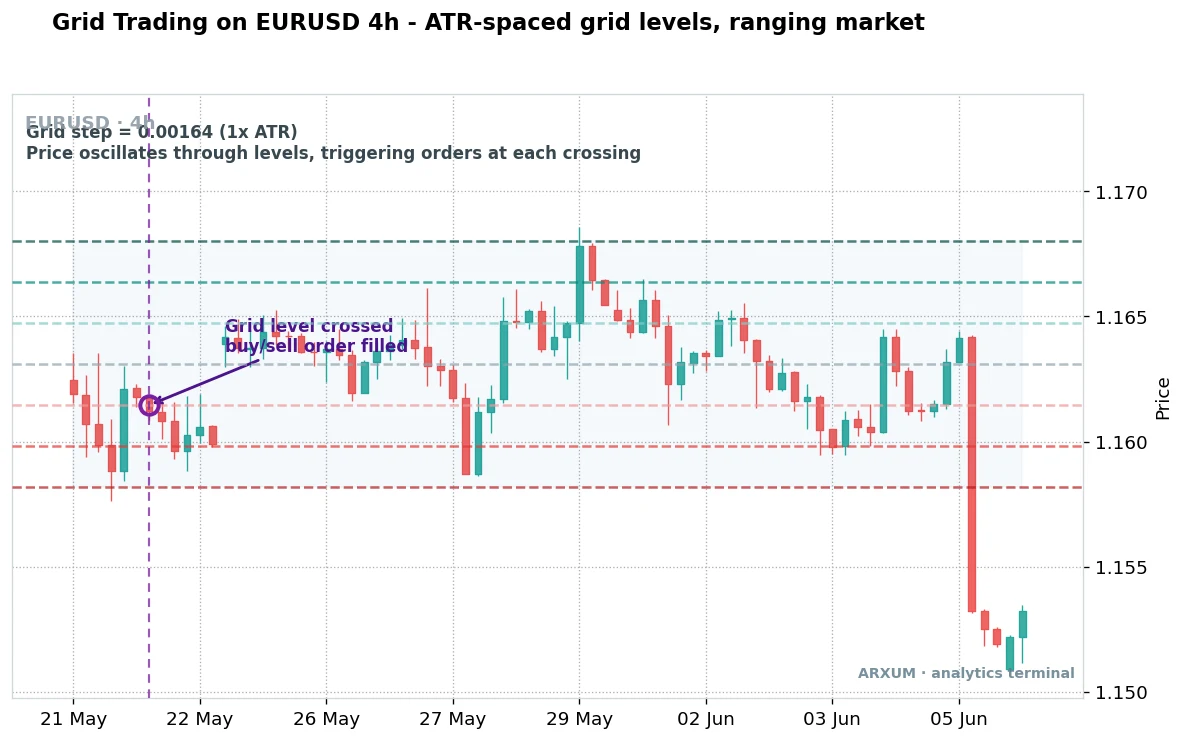
Read that EUR/USD chart in two halves. The middle is the grid doing its job, and the right edge is the warning.
How it looks:
- The dashed levels are the ATR-spaced rungs, wider apart than the anatomy chart because they scale with real volatility.
- The oscillation through the middle is the grid earning, with each crossing filling a buy or a sell.
- The purple mark shows one crossing where a resting order fills, the same event repeating at every rung.
- The sharp drop at the far right is price trending out of the box, and every buy above that level is now a loss.
Application table: a grid on Forex
| Role | How you use it | Best TF and instrument |
|---|---|---|
| Range harvest | Run a neutral grid inside a clear box | H1 to H4 on EUR/USD, GBP/USD |
| Spacing rule | Set the step to one times ATR | H4 on Forex majors |
| Bound placement | Anchor bounds to support and resistance | H4 and D1, any major |
| Kill switch | Close the grid if price closes outside the box | Any TF, non-negotiable |
Grid trading crypto: adding an RSI filter
Grid trading crypto is where the method is most popular, because coins chop violently inside ranges and never sleep. The catch is that crypto also trends hard, so a raw grid needs a sense of direction.
One clean way to add that is the relative strength index, a momentum gauge that swings between 0 and 100 and reads the market as leaning up above its midline or down below it.
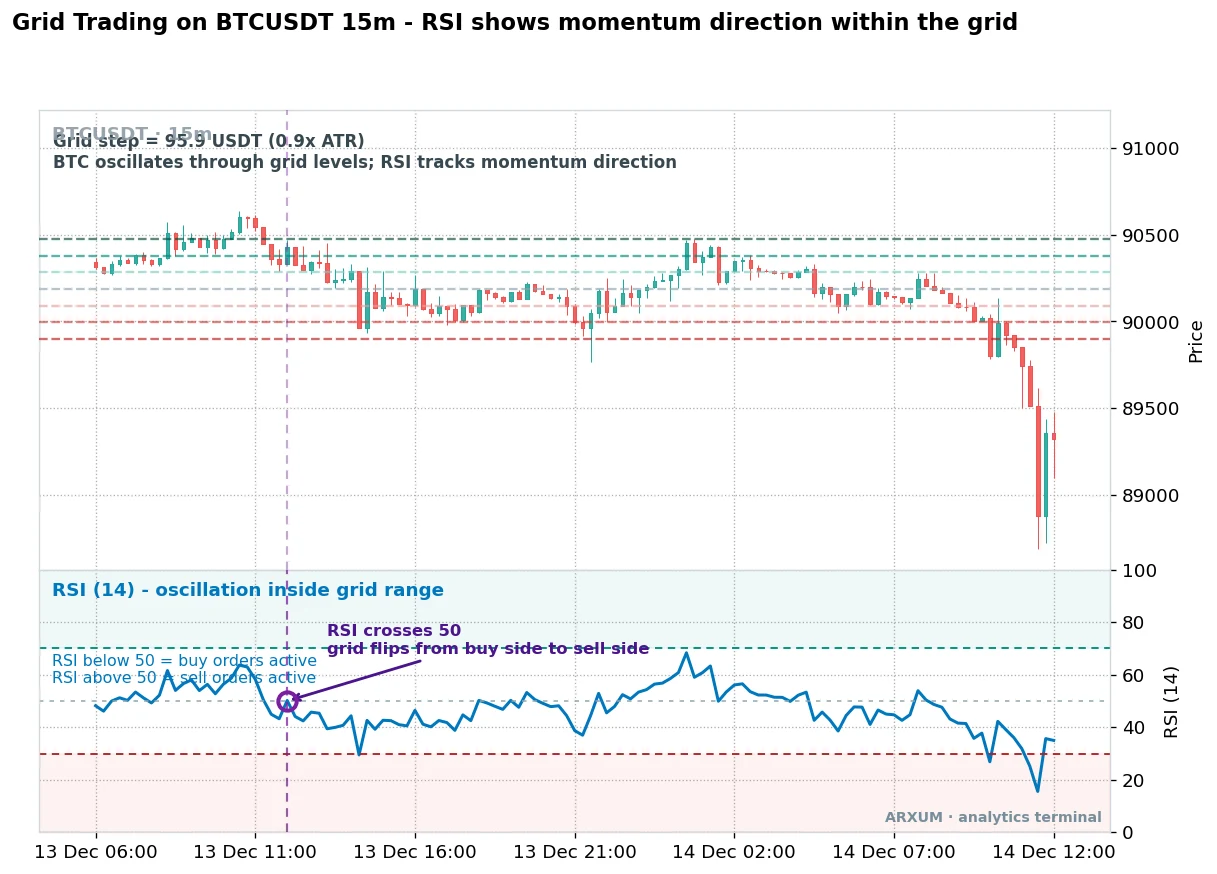
Read the two panels together. The top is the grid, and the bottom RSI line tells you which side of it to favor right now.
How it looks:
- The grid levels in the price panel are spaced to 0.9 times the ATR, tight enough for the 15-minute churn.
- RSI below 50 in the lower panel means momentum leans down, so the buy side of the grid is the safer half to run.
- RSI above 50 means momentum leans up, so the sell side is favored.
- The 50 cross, marked on the chart, is the moment the grid flips which side it trusts.
Application table: a grid on crypto
| Role | How you use it | Best read |
|---|---|---|
| Range harvest | Neutral grid inside a boxed-in coin | M15 to H1 on Bitcoin, large caps |
| Spacing rule | Step near one times ATR, or a fixed percentage | Geometric spacing on wide ranges |
| Direction filter | Favor the buy or sell side by the RSI midline | RSI 14, the 50 line as the pivot |
| Regime check | Pause the grid when a strong trend starts | Any TF, watch the higher timeframe |
When grid trading works, and when it wipes you out
This is the whole game, and it is worth being blunt about. A grid is a bet that price will keep coming back, so it wins in a range and loses in a trend.
The failure mode is not subtle. When price trends out of the box, the grid keeps buying into a fall or selling into a rally, and the open losses pile up faster than the closed round trips paid.
| Market condition | What the grid does | Verdict |
|---|---|---|
| Tight sideways range | Fills round trips constantly | Ideal, the target market |
| Choppy, volatile range | Fills big steps, earns well | Strong, if bounds hold |
| Slow drift with a bias | Long or short-only grid copes | Workable, pick the side |
| Strong one-way trend | Stacks losers outside the box | The account killer |
| Dead, flat market | Rarely reaches a rung | Idle, earns nothing |
A few honest points that the marketing around grid bots tends to skip:
- A grid is short volatility of direction. It quietly collects small gains for weeks, then a single trend can hand back a chunk of it. Respect that shape.
- The equity looks great until it does not. A rising balance in a range is not proof of an edge, it is proof the range held. The test is what happens when it breaks.
- No grid is set-and-forget. The one input you cannot automate away is the judgment to switch it off when the market starts to trend.
For a deeper look at why price tends to snap back inside a range, the mean-reversion logic under grid trading is worth reading alongside this.
Grid trading bots and where they run
Almost nobody runs a grid by hand for long. The point of a grid trading bot is to sit on every level and fire the moment price arrives, day or night, without you watching.
| Where grids run | What it offers | Watch out for |
|---|---|---|
| Exchange built-in bot | One-click grid, no coding | Limited to that venue’s markets |
| Third-party bot service | Runs across many exchanges | You hand it API keys, so scope them |
| Platform script or EA | Full control of the logic | You own the bugs and the testing |
Practical notes before you switch one on:
- Most major crypto exchanges now ship a built-in grid bot, so the barrier to trying one is low, which cuts both ways.
- API keys given to any third-party bot should be trade-only with withdrawals disabled, every time, no exceptions.
- Paper-trade the settings first. A grid that looks tidy on a past range can behave very differently live, so read the backtesting notes before risking real money.
- Fees compound on a busy grid. Dozens of small round trips mean dozens of fees, so a tight grid on a high-fee venue can trade a lot and net little.
Grid trading vs DCA
People mix these up because both buy in steps on the way down. The difference is what happens on the way back up, and it changes everything.
| Grid trading | Dollar-cost averaging | |
|---|---|---|
| Buys | At each rung on the way down | On a fixed schedule, any price |
| Sells | At each rung on the way up | Rarely, it is a hold strategy |
| Goal | Harvest the churn in a range | Accumulate a long-term position |
| Best market | Sideways and choppy | Long-term uptrend you believe in |
| Effort | Active, needs a bot and bounds | Passive, mostly ignore it |
The short version: a grid is a trading system that wants a flat, busy market, while DCA is an investing habit that wants a long climb. They are not rivals, they answer different questions.
Position sizing and risk on a grid
Every grid trading strategy hides its risk in plain sight. Because each order is small, the danger is not any single trade, it is the total you have committed across every open rung when a trend hits.
Size the whole ladder, not the rung:
- Add up every level. Ten rungs at a fixed order size means you can be holding ten open positions at once, so size as if all of them fill.
- Keep dry powder outside the box. Do not commit the whole account to the grid, since the whole point of the risk is what happens when price leaves the range.
- Set a hard exit outside your bounds. Decide in advance the price where you close the entire grid and take the loss, and let the bot enforce it.
- Match the reward you expect to the risk you carry. The reward-to-risk on a grid is lopsided by design, many small wins against a rare large loss, so the exit discipline is the edge, not the entries.
None of this needs a fancy tool. It needs the same thing every mechanical system needs, which is a plan for the day the market stops behaving.
Which grid fits which market
The table below is the whole guide in one place. Pick the row that matches what you are trading, not the one that sounds most exciting.
| You are trading | Use this grid | Spacing | The one caveat |
|---|---|---|---|
| Range-bound Forex | Neutral, arithmetic | One times ATR | Kill it on a clean break |
| Choppy large-cap crypto | Neutral, geometric | Percentage or ATR | Watch the higher-TF trend |
| A coin you want to accumulate | Long-only | Geometric | It is DCA with a sell rule |
| A slow bleed you can short | Short-only | Arithmetic | Only where shorting is real |
| A strong trending market | None | n/a | A grid is the wrong tool here |
What works: three things to remember
If you keep only three points from this guide, keep these.
- A grid harvests a range, and only a range. It turns sideways chop into small mechanical round trips. The moment the market trends out of the box, the same machine that was paying you starts stacking losses.
- Volatility sets the step, structure sets the bounds. Space the rungs by ATR so the grid fits the instrument, and anchor the top and bottom to real support and resistance, not round numbers.
- The exit is the edge. A grid makes its money on the entries and loses it all on one refusal to quit. Decide where you close the whole thing before you ever switch it on.
Run a grid for what it is, a range tool with a known weakness, and it earns a place in the toolkit. Sell it to yourself as passive income and the first real trend will correct you.
FAQ
What is grid trading, in plain terms?
Grid trading places a ladder of buy and sell orders at fixed price levels above and below the current price. As the market moves up and down, price crosses these levels and fills orders, buying a little lower and selling a little higher on every swing. Each small round trip books a small gain. The profit comes from the churn of a sideways market, not from predicting a direction.
How does grid trading work?
You draw a box around where you expect price to chop, set an upper and lower bound, and slice it into evenly spaced levels. A resting buy order sits at each level below price and a sell order at each level above. When price drops to a buy level it fills, and when it rises one step it sells for a small gain. A bot repeats this at every level automatically.
What is grid trading crypto?
It is the same method applied to coins like Bitcoin, and it is where grids are most popular because crypto chops hard inside ranges and trades around the clock. Because crypto also trends violently, many traders add a filter such as the RSI midline to favor the buy or sell side of the grid, and they use percentage-based spacing to cope with the wide price swings.
Does grid trading actually work?
It works in the market it is built for, which is a range. In a sideways, choppy market it fills small round trips steadily. It does not work in a trend, where price leaves the box and the grid keeps stacking losing positions against the move. A grid is best understood as a bet that price keeps coming back, so it wins in a range and loses in a trend.
What is the difference between arithmetic and geometric grids?
An arithmetic grid keeps the same fixed amount between each rung, for example every 5 points. A geometric grid keeps the same percentage between rungs, for example every 1%. Arithmetic suits narrow, stable ranges like a Forex major. Geometric suits wide, volatile assets like Bitcoin, where a flat step would be a huge percentage at low prices and a tiny one at high prices.
What is grid trading vs DCA?
Both buy in steps on the way down, but they differ on the way up. A grid also sells at each rung on the way back up, harvesting the churn of a range, so it is an active trading system. Dollar-cost averaging just keeps buying on a schedule to accumulate a long-term position and rarely sells. A grid wants a flat market, DCA wants a long climb.
What is a grid trading bot?
It is software that watches every grid level and fires the orders the moment price arrives, without you at the screen. Most major crypto exchanges now ship a built-in grid bot, and third-party services run grids across several venues. If you use a third-party bot, keep the API keys trade-only with withdrawals disabled, and paper-trade the settings before risking real money.
What is the best market for grid trading?
Markets that move sideways in a defined range. Quiet Forex majors like EUR/USD and choppy large-cap crypto both fit, as long as price stays inside a box you can identify. The worst market is a strong one-way trend, where a grid stacks losers outside its bounds. Anchor the grid to real support and resistance, not to round numbers.
How much money do I need to start grid trading?
Enough to fund every rung at once, not just the first one. Because a grid can hold many open positions at the same time, you should size the whole ladder as if all levels fill, and keep spare capital outside the grid for the day price trends out. Start small while you learn how the settings behave on a live market.
What do the key grid trading terms mean?
Grid level: a fixed price rung with a resting order. Grid step: the gap between two rungs. Upper and lower bound: the top and bottom of the ladder, outside which the grid stops working. Neutral grid: buys and sells both live. Long-only and short-only: only one side is active. ATR: the average true range, a measure of how far a market typically moves, often used to set the step.
🌍 Our recommended brokers


Reader Reviews
Be the first to review this — tell other traders what actually helped, or where it fell short.
Leave a Review

Momentum Trader & Technical Analyst
Trades momentum across crypto and forex since 2019, built around RSI, MACD, and volume. Turns discretionary setups into rule-based, systematic entries and validates them on data before they go live.