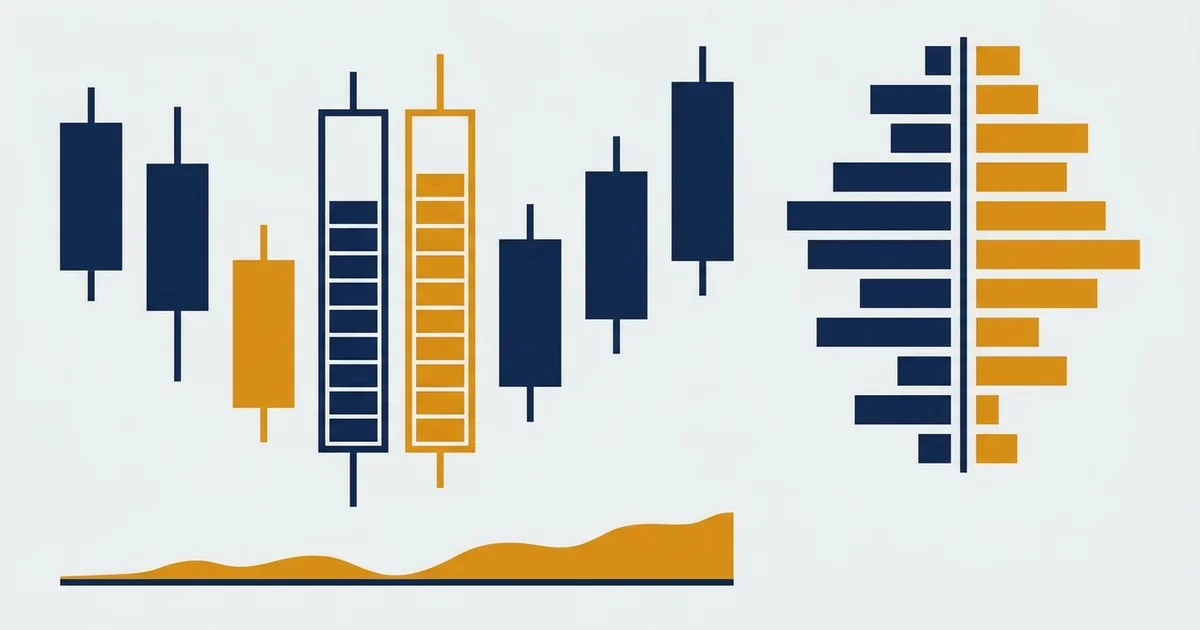

What order flow trading actually is
Order flow trading is the study of who is doing the buying and selling, and how hard, behind the price you see. It looks past the candle to the transactions that built it.
The simplest window into that, one you probably already have, is where price sits against its volume-weighted fair value.
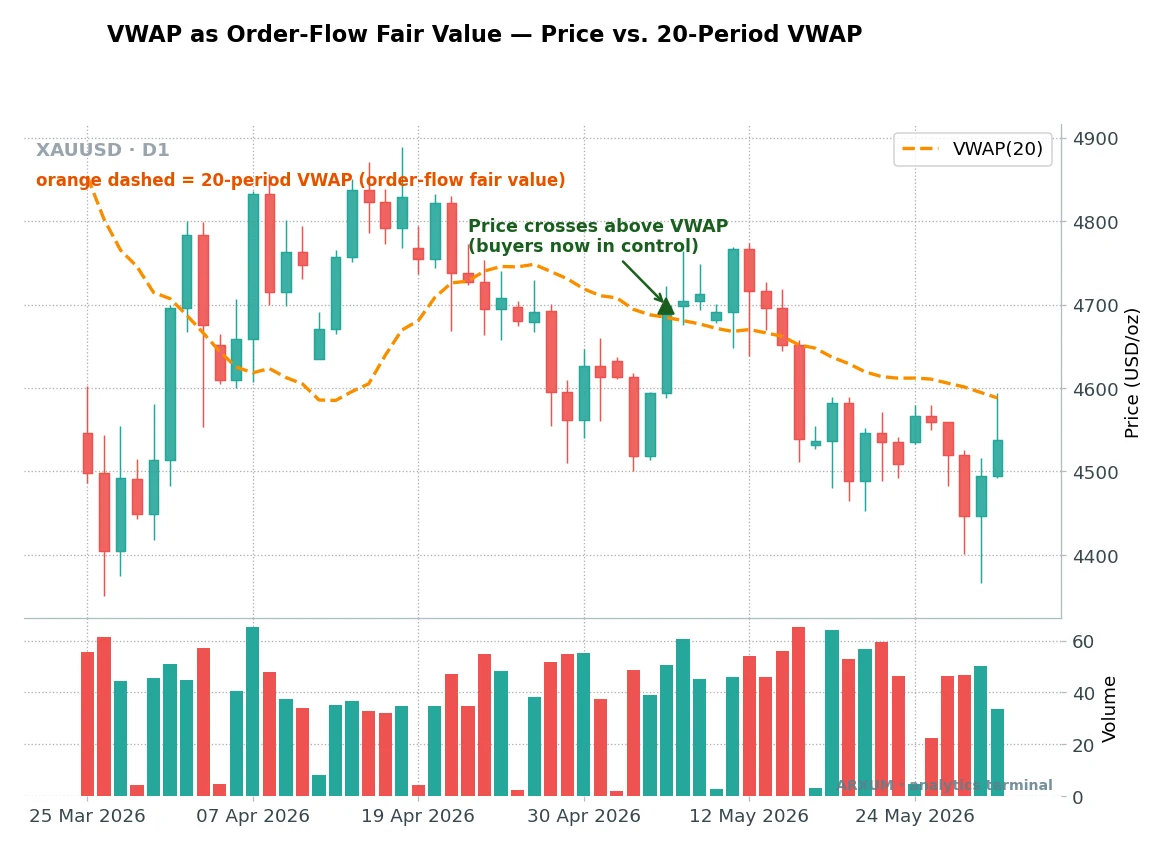
Read that gold chart and the idea lands in one look.
- VWAP is the fair-value line. It is the average price weighted by how much traded at each level, so it sits where the real business got done, not where the candles happen to close.
- Above VWAP, buyers are in control. Price accepting higher prices means aggressive buying is winning the flow, which is what the green callout marks.
- Below VWAP, sellers are in control. The same read flipped. Price pushed under fair value is buyers giving up ground.
- Volume is the fuel. A move on heavy volume carries real orders behind it. The same move on thin volume is noise, and it usually fails.
The whole discipline is that sequence: find fair value, see which side is pushing price away from it, and follow the side with the volume.
Order flow in one glance
| Term | What it means | Plain read |
|---|---|---|
| Order flow | The live stream of buy and sell orders | Who is actually trading, and how hard |
| Bid | The highest price buyers will pay | Where passive buyers wait |
| Ask | The lowest price sellers will accept | Where passive sellers wait |
| Aggression | Orders that cross the spread to fill now | The impatient side, the one moving price |
| Delta | Buy volume minus sell volume | The net winner of a bar or a session |
The order flow toolkit
There is no single order flow indicator. There is a small toolkit, and each tool shows a different slice of the same thing: who is buying, who is selling, and where.
Here is the whole kit, and the honest truth about what a retail account can reach.
| Tool | What it shows | Retail access |
|---|---|---|
| Footprint chart | Buy vs sell volume inside every candle | Paid platforms, futures and crypto |
| Depth of market (DOM) | The live order book of resting bids and offers | Futures and crypto, broker-only in FX |
| Time and sales (the tape) | Every executed trade as it prints | Futures and crypto, thin in FX |
| Cumulative volume delta | Running total of net buying minus selling | Free on TradingView, crypto and futures |
| Delta bars | Net buy or sell imbalance per single bar | Free-ish, proxy version in FX |
| VWAP | The volume-weighted fair-value line | Free on every platform |
A few of those names get searched a lot, so worth defining plainly right here.
- Footprint chart trading means reading a candle that has been split open to show the buy and sell volume at each price inside it. It is the most detailed order flow view there is.
- Market depth trading, or DOM trading, means trading off the order book, the ladder of resting orders above and below price. You watch where size is stacked and whether it holds or pulls.
- Tape reading trading is the oldest method here. You watch the raw feed of executed trades, the tape, and read speed and size to feel when one side is overwhelming the other.
The rest of this guide takes the three you can actually build a repeatable read from without a professional data feed: cumulative volume delta, delta bars, and VWAP.
Reading net pressure: cumulative volume delta
Cumulative volume delta, or CVD, is a running tally of net buying against net selling. When it climbs, aggressive buyers are winning the flow, and when it falls, sellers are.
The gold in CVD is not the line itself, it is when the line and price disagree.
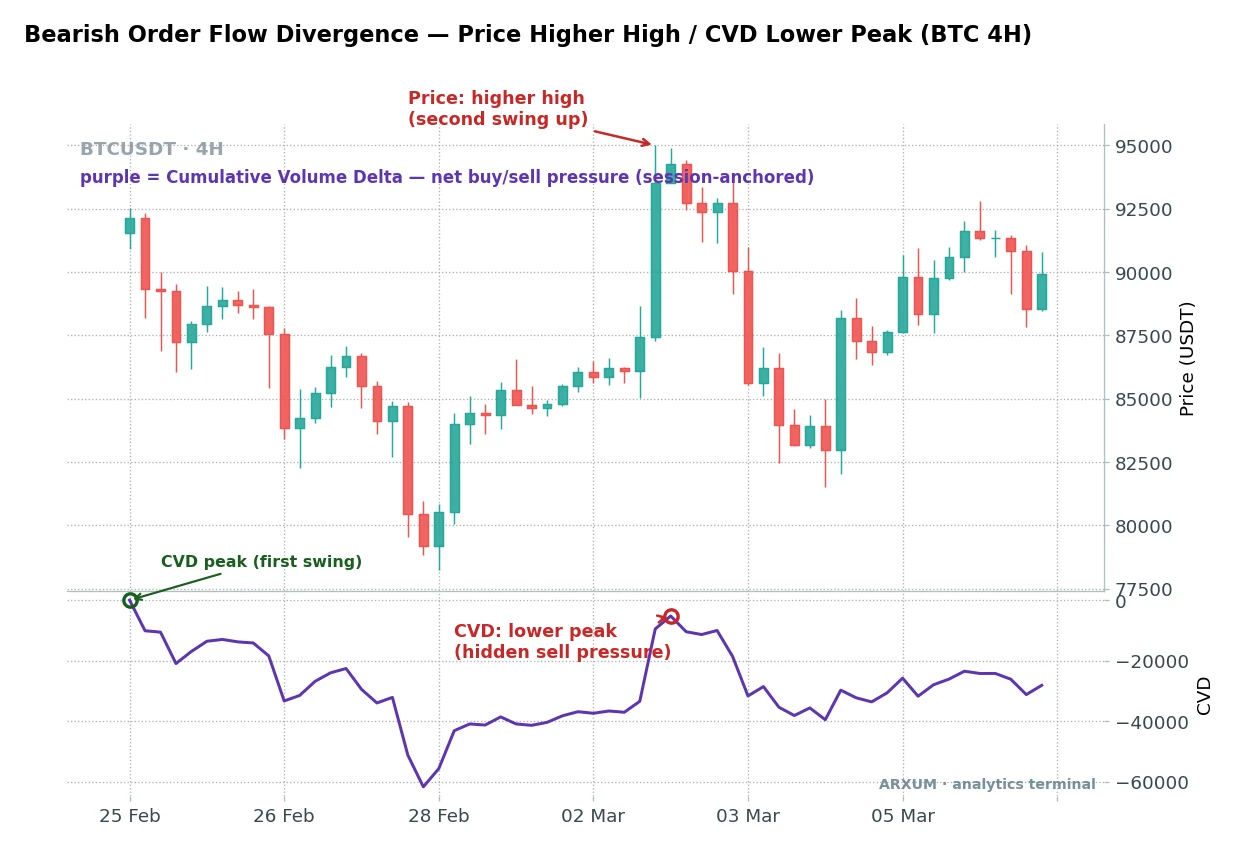
The chart names three points. Here is how to read them.
- Price higher high is the second swing pushing above the first. On the candles alone, this looks bullish and clean.
- CVD first peak is the buying pressure behind the first swing, the green ring at the start.
- CVD lower peak is the tell, the red ring. On the second, higher price swing, the net buying is actually weaker than before.
When price climbs but CVD does not follow, the move is running on fumes. Real buyers are not chasing it, and that is the warning.
How CVD looks in practice:
- In a healthy trend, price and CVD rise together. Each new high in price comes with a new high in delta.
- A bearish divergence is price up, CVD flat or down. Buying is drying up under a rising chart.
- A bullish divergence is price down, CVD flat or up. Selling is drying up under a falling chart, often before a bounce.
- CVD works cleanest where volume is real and centralised, so crypto and futures beat spot Forex here.
Application: cumulative volume delta
| Role | How you use it | Best TF and market |
|---|---|---|
| Trend read | Trust the trend while price and CVD rise together | H4 and D1 on BTC and futures |
| Reversal warning | Fade or tighten up on a clear price-CVD divergence | H4 on BTC, gold proxies |
| Confirmation | Take a breakout only if CVD breaks with it | H1 and H4 on crypto |
| Filter | Skip signals where volume data is thin or fake | Any spot Forex pair |
CVD is not a trigger on its own. It is a lie detector for a price move you were already watching.
Reading the single bar: delta and footprint
Zoom in from the whole session to one candle. Delta on a single bar is that bar’s buy volume minus its sell volume, so a big negative delta means sellers were far more aggressive inside that candle.
This is where order flow stops being abstract. You can see the exact bar where one side hit the market.
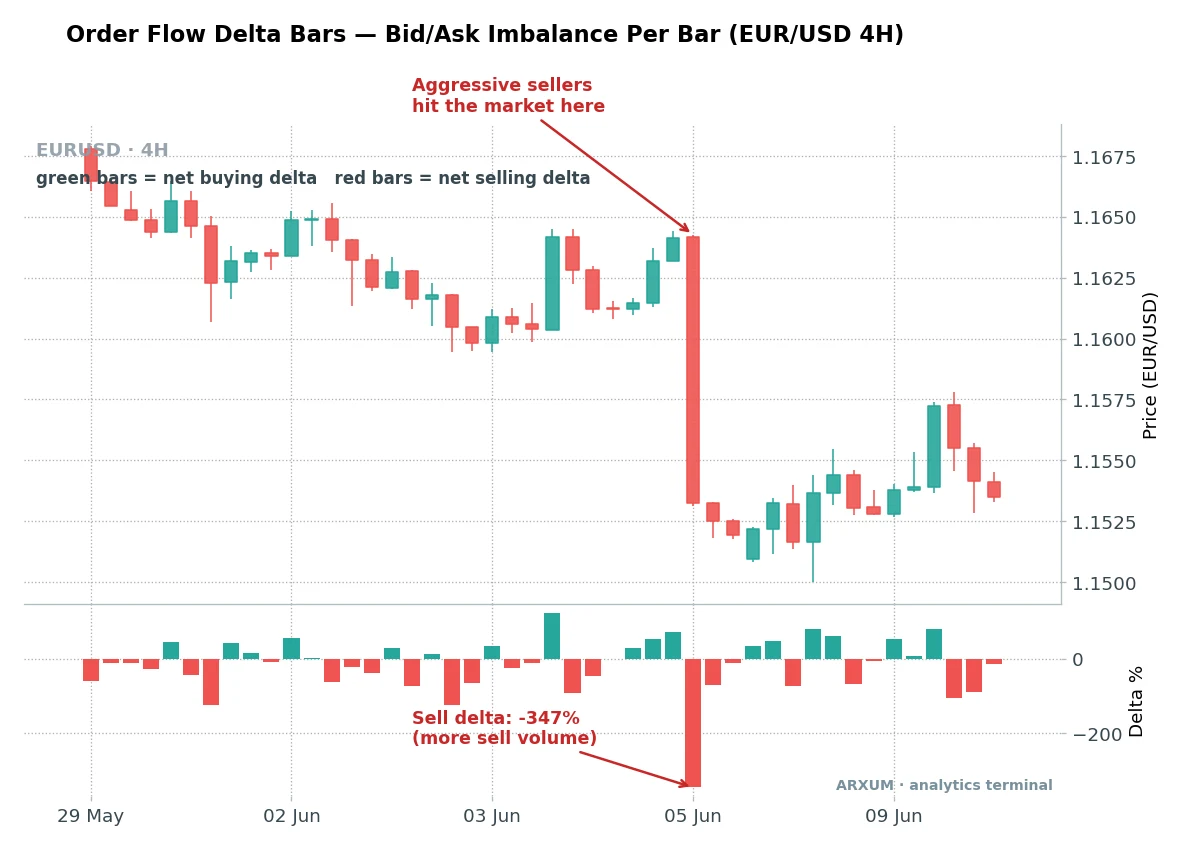
Read the labelled bar and the panel below it.
- Green bars are net buying. More volume traded into the ask, so buyers were the aggressors on that candle.
- Red bars are net selling. More volume traded into the bid, so sellers led. The size of the bar is the size of the imbalance.
- The sell-delta spike is the callout. The label reads a large negative percentage, meaning sell volume dwarfed buy volume on that single bar. That is a burst of aggression, not slow drift.
- The price candle above it is the result: a wide red bar as that selling pushed price down fast.
A footprint chart is the same idea taken to the extreme, showing buy and sell volume at every individual price inside the candle rather than one net figure. It is the fullest order flow read, and the reason footprint chart trading has a following, but it needs a paid data feed.
How delta and footprint read:
- A single huge delta bar against the prior trend often marks exhaustion, one side dumping everything at once.
- Delta agreeing with the candle, big green on an up bar, confirms the move is real.
- Delta fighting the candle, an up bar closing on heavy sell delta, warns the move is being sold into.
- On footprint charts, a stack of buying that fails to lift price is absorption, a bigger seller quietly soaking it up.
Application: delta and footprint bars
| Role | How you use it | Best TF and market |
|---|---|---|
| Aggression read | Spot the bar where one side hit the market hard | H1 and H4 on EUR/USD, BTC |
| Exhaustion cue | Watch a giant delta bar against the trend for a turn | H4 on gold, EUR/USD |
| Confirmation | Take entries where delta agrees with the candle | H1 on Forex majors |
| Absorption | Note heavy volume that fails to move price | Footprint on futures, crypto |
Depth of market and the tape
The two purest order flow tools show intent before it becomes a candle. They are also the hardest for a retail Forex trader to reach honestly.
Depth of market, the DOM, is the live order book: a ladder showing the resting buy orders below price and sell orders above it. Market depth trading is reading that ladder for where size sits and whether it holds.
| Signal on the DOM | What it hints | The catch |
|---|---|---|
| A wall of resting orders | A level someone wants defended | It can be a spoof, pulled before it fills |
| Size pulling as price nears | Fake support or resistance | Do not trust a wall until it absorbs trades |
| The book thinning out | A move can accelerate through | Common right before fast breaks |
| Orders refilling at a price | Real absorption by a big player | The strongest, hardest-to-fake read |
Time and sales, the tape, is the raw feed of every executed trade. Tape reading trading means judging the flow by speed and size.
- Speed tells you urgency. A tape that suddenly races means one side got impatient.
- Size tells you who. A run of large prints hitting the ask is a big buyer paying up, not retail nibbling.
- The trap is that both DOM and tape are cleanest on centralised futures and crypto exchanges. Spot Forex has no single book, so what a broker shows you is a partial, dealer-specific view. Read it as a hint, never as the whole market.
The honest line: DOM and tape are elite tools where the data is real and centralised. In Forex, treat any depth your broker shows as a fragment, and lean on VWAP, CVD and delta instead.
Order flow vs price action
A common question is whether order flow trading replaces plain price action. It does not: they answer different questions, and they stack well.
| Question | Price action answers | Order flow answers |
|---|---|---|
| Where is the level? | Yes, from swings and structure | No, it is not its job |
| Is the level being defended? | Only by guessing | Yes, from volume at the price |
| Who is winning right now? | Roughly, from candle shape | Precisely, from delta and CVD |
| Is a breakout real or a trap? | Weakly | Strongly, from volume behind it |
Price action, and its cousins like supply and demand zones, tells you where to look. Order flow tells you whether the level is actually holding when price gets there.
- Mark your level with structure, the way you always would.
- When price arrives, check the flow: is delta flipping, is CVD confirming, is volume showing up.
- Take the trade when the level and the flow agree, and stand aside when they fight.
That confluence is the whole point. The same logic drives smart money concepts and order blocks, which infer institutional flow from price shape alone, and order flow tools let you check that inference against real volume.
Which tool, which market, which timeframe
Order flow is not equally readable everywhere. The tools need real, centralised volume, which is exactly what spot Forex lacks and crypto and futures provide.
| Market | Order flow quality | Best tools |
|---|---|---|
| Bitcoin and crypto | High, real exchange volume | CVD, delta, footprint, DOM |
| Futures (gold, indices) | High, single central book | Footprint, DOM, tape, VWAP |
| Spot gold (XAU/USD) | Medium, via futures proxy | VWAP, CVD proxy, delta |
| Forex majors | Lower, no central book | VWAP, tick-volume delta |
Timeframe matters as much as market.
- D1 and H4 are where order flow reads cleanest. There is enough volume per bar for delta and CVD to mean something.
- H1 works with a higher-timeframe filter, useful for timing an entry into a level you found on H4.
- M15 and below turn order flow into noise for most retail feeds. Real scalpers use footprint and DOM here, but that needs a professional data setup.
The rule of thumb: use VWAP and CVD to read the bigger picture on H4 or D1, then drop to H1 to time the entry with per-bar delta. Higher timeframe for the story, lower for the trigger.
What retail can, and cannot, do
Order flow trading has a marketing problem. A lot of it is sold as a secret institutional edge, though some of the tools genuinely are out of reach.
| You can | You cannot |
|---|---|
| Read VWAP on any platform, free | See the full Forex order book, it does not exist |
| Run CVD and delta on crypto and futures | Compete with HFT firms on the tape for speed |
| Use tick-volume as a delta proxy in FX | Trust a broker’s DOM as the whole market |
| Buy footprint and DOM for futures, crypto | Get true footprint data on spot Forex |
- The accessible edge is real but modest. VWAP, CVD and delta on H4 and D1 give a genuine read on who is winning. That is worth having.
- The mythical edge is oversold. You are not going to out-read the machines on the millisecond tape. That game belongs to high-frequency trading desks, and it is an infrastructure race, not a chart skill.
- Tick volume is a proxy, not truth. In Forex, “volume” usually counts price updates, not contracts. It correlates with real activity well enough to be useful, but know what you are looking at.
Order flow does not need a fantasy to be worth learning. Used honestly, it turns “I think this level will hold” into “the flow says this level is holding,” and that is a better sentence to trade on.
For the theory of how large players accumulate quietly, the Wyckoff method is the older, chart-based ancestor of everything here.
What works: the three things to remember
Keep these three and you have the working core of order flow trading.
- Fair value plus flow beats guessing. Find where price sits against VWAP, then check whether delta and CVD agree. Following the side with the volume, from a sensible level, is the whole edge.
- Divergence is the highest-value read. Price making a new high while cumulative volume delta does not is a warning most chart-only traders never see. It is the single most useful order flow signal a retail account can get.
- Match the tool to real volume. Footprint, DOM and tape shine on crypto and futures. In Forex, lean on VWAP and CVD, and treat any order book as a fragment.
Order flow will not call every move, and none of these tools work in a dead, low-volume market. Used for what they are, a way to read who is actually buying and selling behind the candle, they add a layer of confirmation that price alone cannot give you.
Size every trade to a plan you can survive a losing run on. Reading the flow better still leaves you exposed to the ones that go against you.
FAQ
What is order flow in trading, in plain terms?
Does order flow trading actually work?
What is a footprint chart?
What is cumulative volume delta?
What is DOM or market depth trading?
What is tape reading?
What is the difference between order flow and price action?
What do the key order flow terms mean?
Real-time trade setups with entry, stop loss and take profit. Daily market analysis. No subscription, no complicated theory.
🌍 Our recommended brokers


Reader Reviews
Be the first to review this — tell other traders what actually helped, or where it fell short.
Leave a Review

Forex Analyst & Senior Trader
Former FX desk trader with 8 years in institutional forex. Works in multi-timeframe analysis and order flow, turning desk experience into systematic, testable rules across forex and metals.
