When I spent eight years on an FX desk, we never used the phrase “supply and demand zones.” We called them order blocks — the levels where we’d placed large limit orders that hadn’t fully filled on the first pass. The concept is identical. Institutional traders build positions at specific price levels, and those levels tend to attract price again before the directional move continues.
What retail traders reconstruct with supply and demand analysis is a rough map of where institutional orders likely sit. The tool is imperfect. The logic is sound.
What Makes a Zone Valid
Not every consolidation on a chart is worth trading. Three factors separate tradeable zones from noise.
Strong departure. The base candles must be followed by at least three consecutive candles moving away from the level without significant retracement. On EUR/USD 4H, that means 50-60 pips of directional movement leaving the base. Less than that is a minor retracement, not a genuine institutional order block.
Price left and has not returned. A fresh zone is one price has not re-entered since formation. Each visit to a zone consumes orders sitting there. A zone tested twice is largely used up. One tested three times or more is off my chart.
Small, indecisive base candles. Valid bases have tight candles: doji, spinning tops, narrow-range bars. Large bearish candles inside what should be a demand zone signal aggressive counter-trend selling during the base. That is contested price action, not a clean institutional accumulation area.
Identifying Demand Zones
A demand zone forms at the origin of an upward impulse. The mechanics:
The zone covers the range from the lowest wick across the base cluster to the open of the first impulsive upward candle. If three candles form the base before the launch, I take the lowest wick across all three and the open of the first strong up-candle.
On EUR/USD in Q4 2024, the Fed rate-cut environment created clean demand zones around 1.0520-1.0540. Price consolidated in a 25-pip range across three 4H candles, then launched 80 pips on an ECB announcement. That tight base before a sharp impulse is the exact pattern. The zone held on three separate retests across six weeks before finally breaking.
For entries: limit buy at the top of the demand zone. Stop 10-15 pips below the zone’s lowest wick. Target the next supply zone or a 2:1 R:R, whichever comes first.
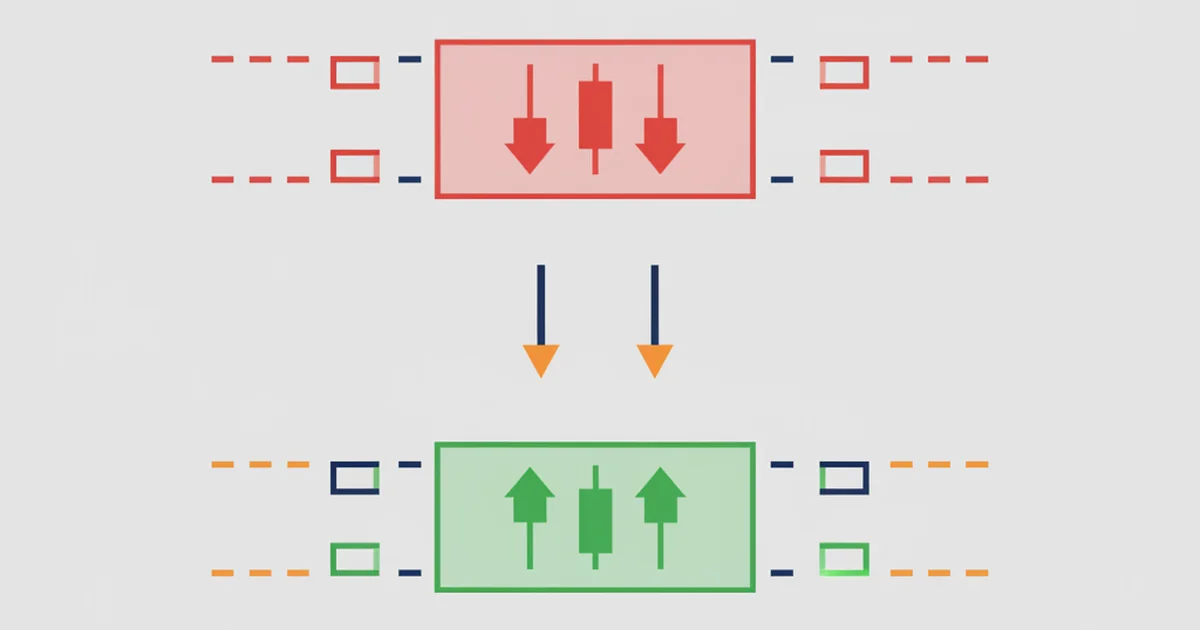
Identifying Supply Zones
Supply zones mirror demand zones. The zone forms at the origin of a downward impulse.
Draw the zone from the open of the first impulsive downward candle to the highest wick across the base cluster. The zone sits above price after formation and represents where institutional selling pressure originated.
On XAU/USD in Q1 2025, gold was trending hard toward $3,200. Most supply zones were consumed quickly in the run. The one zone that held formed at $3,150-$3,165: a 45-minute base on 4H followed by a $120 drop. I entered short on retest at $3,153, stop at $3,172 above the zone high, target at $3,000.
The trade ran over 11 days. Net: 150 pips at 0.5% risk on my live account. Nothing unusual made it work. The zone had clean structure and price had not re-entered since formation. I waited. That is the entire edge.
Two Entry Approaches
Limit order at zone: Set your entry at the zone boundary before price arrives. For demand, limit buy at the top of the demand zone. For supply, limit sell at the bottom of the supply zone. This captures the best entry if the zone holds. It misses the trade entirely if price does not reach the zone.
Confirmation candle entry: Wait for price to enter the zone and form a reversal candlestick before entering. An engulfing candle or pin bar rejecting the zone edge confirms that orders are absorbing price. You sacrifice some of the initial move in exchange for added confidence.
My live EUR/USD results across 11 months of tracking:
- Limit entries at demand zones: 58% win rate, 14 trades, average R:R 2.4:1
- Confirmation entries: 67% win rate, 9 trades, average R:R 1.7:1
Net expectancy is similar either way. I now use limit entries for fresh, high-conviction zones and confirmation entries when zone quality is less certain.
Combining With Fair Value Gaps
A fair value gap sitting inside a demand zone is the most reliable setup I track.
The logic: a fair value gap marks an imbalance left by an impulsive move, where price moved so fast it left a three-candle gap in the order book. A demand zone marks where institutional buyers likely have remaining orders. When both appear at the same price level, you have two independent reasons for price to react.
Setup on EUR/USD:
- Find a fresh 4H demand zone
- Look for an FVG inside the zone (a three-candle imbalance pattern within the base)
- Limit buy at the bottom of the FVG, stop below the demand zone’s lowest wick
- Target the next supply zone, minimum 2:1 R:R
Across 23 tracked setups combining demand zones with FVGs, win rate reached 72%. The same demand zones without the FVG filter ran 58%. That 14-percentage-point difference is large enough to wait for it.
For a broader framework covering how supply and demand fits within the ICT methodology (order blocks, liquidity sweeps, market structure), the ICT trading guide covers the full system.
Zone Invalidation
Delete a zone from your chart when any of these occur:
- Full breach: A candle opens inside a demand zone and closes below its lowest boundary. Orders are consumed. The zone is done.
- Second full entry: Once price enters and exits a zone twice, treat it as used-up. The third entry rarely holds with enough force to run the full target.
- New zone forms inside the old one: When a tighter base forms within your existing zone, the newer and smaller zone supersedes the old one. Draw the tighter zone, delete the wider one.
Most traders using supply and demand fail not in zone identification but in zone hygiene. Old zones kept on the chart generate false signals and clutter the analysis.
Supply and Demand vs. Standard Support and Resistance
Support and resistance levels are drawn at price pivots — where price reversed. Supply and demand zones are drawn at the origin of a move, before the reversal. On a chart, S&R lives at the swing high or low itself. S&D lives at the base that preceded it.
For range-bound markets with clear swing structure, S&R levels perform well. For trending markets where price is building a directional structure, S&D zones provide tighter entries with better-defined stops. I use both: S&R for overall context, S&D for precise entries within that context.
Common Mistakes That Kill Zone Trades
Mixing timeframes. A 1-minute supply zone sitting inside a daily demand zone is a conflict, not a setup. Always verify that your trade timeframe zone aligns with the higher timeframe structure. A 4H demand zone directly below a daily supply zone is a low-probability entry. The daily supply will push price back before the 4H demand absorbs it.
Entering before price reaches the zone. Anticipating zone touches leads to premature entries with oversized stops. The zone either holds on contact or it does not. If price gaps past the zone, there is no trade.
Keeping too many zones on the chart. Five to eight active zones is the practical maximum. More than that and you are drawing support everywhere rather than identifying genuine institutional interest. Quality beats quantity every time.
Ignoring spread on tight-stop entries. Supply and demand entries often have 10-20 pip stops. A 2-pip spread on EUR/USD eats 10-20% of your risk budget before the trade starts. I tested FP Markets raw spread accounts specifically for these setups. EUR/USD averaged 0.0 pips raw with a fixed commission of $3-4 per lot, keeping execution cost from destroying the math on tight-stop strategies.
FAQ
How do I draw supply and demand zones correctly?
How is a demand zone different from standard support?
How many times can price test a zone before it breaks?
Do supply and demand zones work on crypto?
What is the difference between a supply zone and an ICT order block?
Where should I place my stop loss on zone trades?
🌍 Our recommended brokers
Reader Reviews
The zone hygiene section finally gave me a framework for something I had been doing wrong for nine months. I was keeping every supply zone on my chart indefinitely, including ones price had entered and exited twice. The ones I should have deleted kept generating false signals that looked convincing until the trade moved against me. Clearing all zones that had seen two full entries immediately simplified my EUR/USD 4H chart from 23 active zones down to 6 clean ones. Over the next eight weeks I took 12 setups, nine of which came from fresh one-touch zones. Eight of those nine reached the target. The three from older zones stopped out. The pattern was clear. I now delete a zone the moment price closes inside it for the second time, not after it fails. Monthly return averaged 7.4% over those eight weeks at 1.5% risk per trade on a $4,200 FP Markets account.
The limit order approach versus the confirmation entry comparison is the most useful analysis I have found in any supply and demand guide. I had been taking confirmation candle entries because they felt safer, but the math here made me reconsider. My tracked results on EUR/USD over four months show limit entries averaging 2.1:1 R:R and confirmation entries averaging 1.6:1 on the same zones. Win rates were close enough that the difference in average R:R made limit entries the clearly better option on fresh high-quality zones.
I had been applying supply and demand zones to 15-minute charts on GBP/USD for six months before reading the section on timeframe alignment. The fresh zone concept did not fully register until the guide explained that retail-driven price action on shorter timeframes consumes zone validity faster than institutional order flow on the 4H and daily. Moving my analysis entirely to the 4H chart improved base candle quality noticeably. Across seven weeks of 4H supply zone entries on GBP/USD, win rate was 63%. On the 15-minute chart over the same instrument in the prior period, it was 44%.
The FVG plus demand zone combination changed my trading more than any single adjustment in the past two years. I had been trading demand zones alone and running a 57% win rate across 21 EUR/USD setups. After filtering to only take setups where an FVG sat inside the demand zone, the qualifying setups narrowed to 14. Of those, eleven hit the full target, two stopped out, one is still running. The win rate on the filtered group was 78% versus 57% on unfiltered zones. The tradeoff is patience - most demand zones do not have an FVG sitting inside them, and some weeks there is no qualifying setup at all. But the setups that qualify are noticeably cleaner. Monthly account return averaged 8.1% during the four months I ran the combined filter at 1.5% risk per trade. The XAU/USD trade from Q1 2025 described here matches a setup I had taken myself at $3,148, with nearly identical entry and stop placement.
The common mistakes section saved me from the spread problem before I experienced it on a live account. I had set up supply and demand entries on EUR/USD with 12-pip stops through a fixed-spread account. The 2.2-pip spread was consuming 18% of my risk budget before the trade started, which mathematically requires a higher win rate just to break even. Switching to a raw spread account with EUR/USD averaging 0.1 pips kept execution cost below 5% of risk on a 12-pip stop. My net results on the same strategy improved by approximately 0.8% per trade from the execution fix alone, without changing entry or zone logic.
The invalidation rules are the clearest I have found in any supply and demand resource. Most content describes how zones form but almost none of it explains when to delete them. The three-condition checklist, full breach below zone boundary, second full entry, and new zone forming inside the old one, gave me exact deletion triggers I could apply consistently. Clearing expired zones based on these criteria removed twelve false setups from my EUR/USD chart in the first two weeks of applying the framework.
Working through the FVG section led me to run a backtest across my own trade journal. I went back through 11 months of demand zone entries on EUR/USD 4H and separated them into two groups: setups with an FVG inside the zone and setups without. The FVG group had 9 trades with a 78% win rate. The non-FVG group had 14 trades with a 56% win rate. That gap was larger than I had expected, and I had not been tracking it as a separate category. The FVG acts as a second confirmation within the same zone, which explains why the accuracy difference is so consistent. I now run the FVG filter as a required pre-entry check on every demand zone setup. Monthly return on the filtered setups over the past five months averaged 7.8% at 1.5% risk per trade.
The difference between supply and demand zones and standard support and resistance is the distinction I needed a year ago. I had been drawing support at swing lows and wondering why my entries were always late and my stops too wide. Drawing zones at the base of the impulse move instead of at the reversal point gave me entries consistently 15 to 20 pips tighter on EUR/USD, which improved stop-to-target ratios without changing the trade thesis. Over six weeks after applying this approach, average R:R improved from 1.4:1 to 2.1:1 on the same instruments.
Leave a Review

Forex Analyst & Senior Trader
Former FX desk trader with 8 years in institutional forex. Works in multi-timeframe analysis and order flow, turning desk experience into systematic, testable rules across forex and metals.