
How to trade silver: know its character first
Most people who learn how to trade silver start by expecting a cheaper gold. It is not.
Silver is a louder, faster cousin that happens to share the same bull theme.
Most retail traders trade it as a silver CFD (XAG/USD), a contract that simply tracks the price so you can go long or short without owning any actual metal. That is the instrument this guide uses throughout.
Here is the difference in one picture. The same six-week window, silver on the left and spot gold on the right, drawn to their own scales.
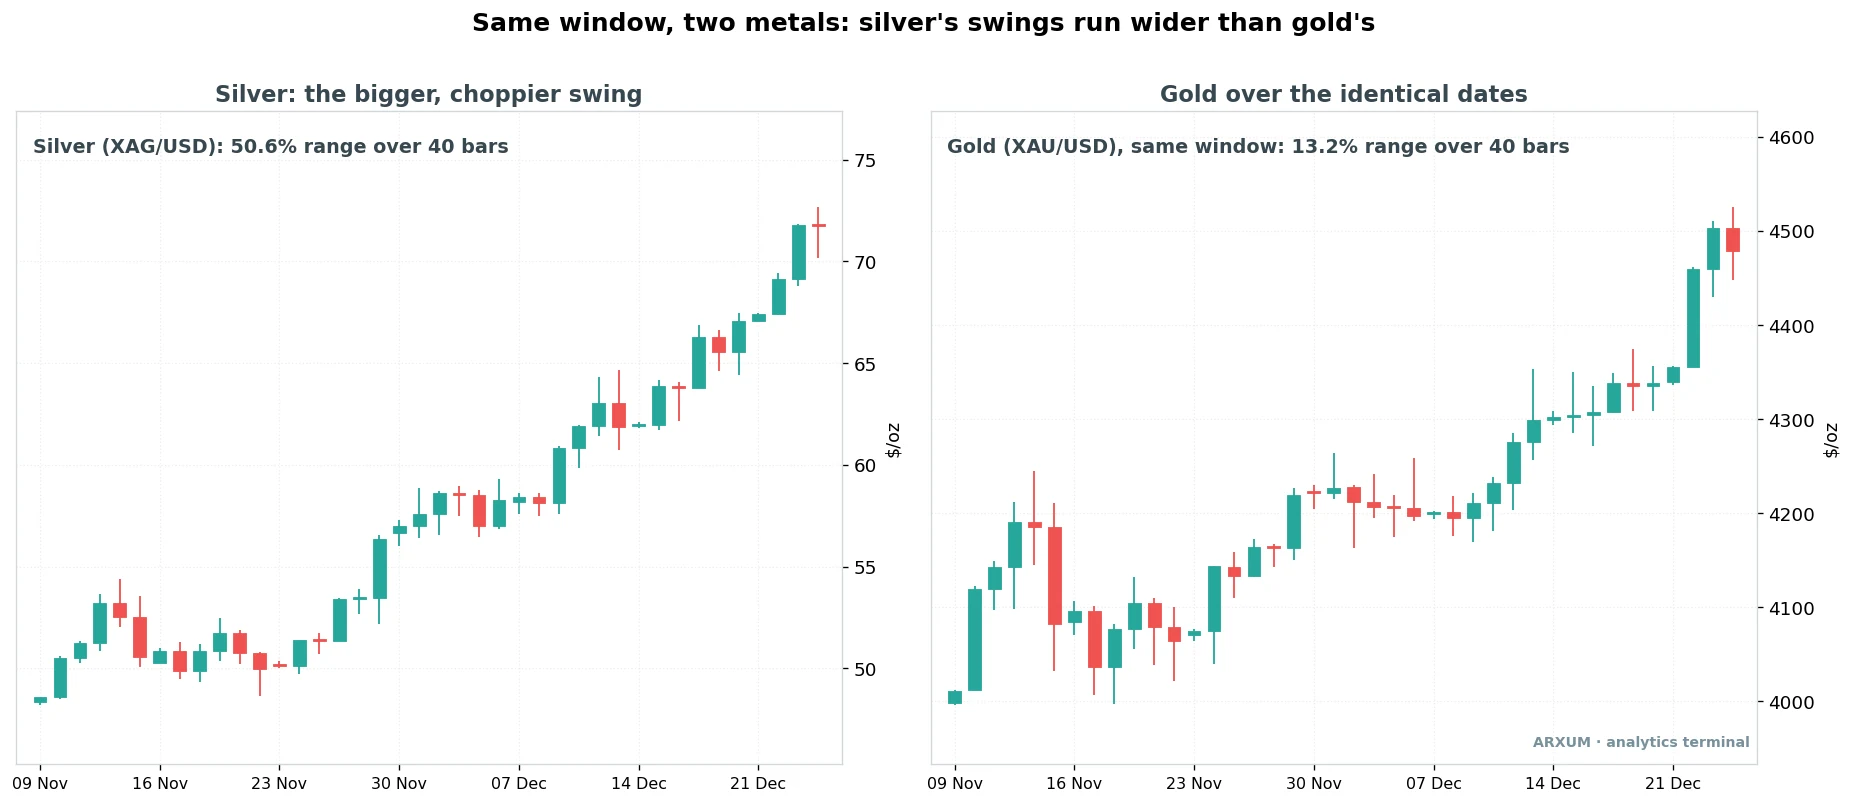
Same calendar, same trend, wildly different rides. Silver ran a 50% range while gold covered 13%.
The candles on the left are fatter and the pullbacks are deeper.
This particular window is a wilder one than average, picked to make the difference easy to see. Over the full eight years silver settles to about twice gold’s daily range, not four times it, which the next section measures directly.
This is the first thing to internalize before you place a single trade here. A stop that is sensible on gold is often far too tight on silver. Get the sizing wrong and a normal wobble stops you out of a trade that was fine.
The rest of this guide is the honest version of what works on that character, tested rather than asserted. Silver is our subject here, but the lead metal in this whole complex is gold.
If you want the calmer instrument first, the gold trading guide covers XAU/USD on its own terms.
Silver moves about twice as hard as gold
That opener was one window. The obvious question is whether it holds, or whether we just picked a wild patch.
So here is the whole eight years.
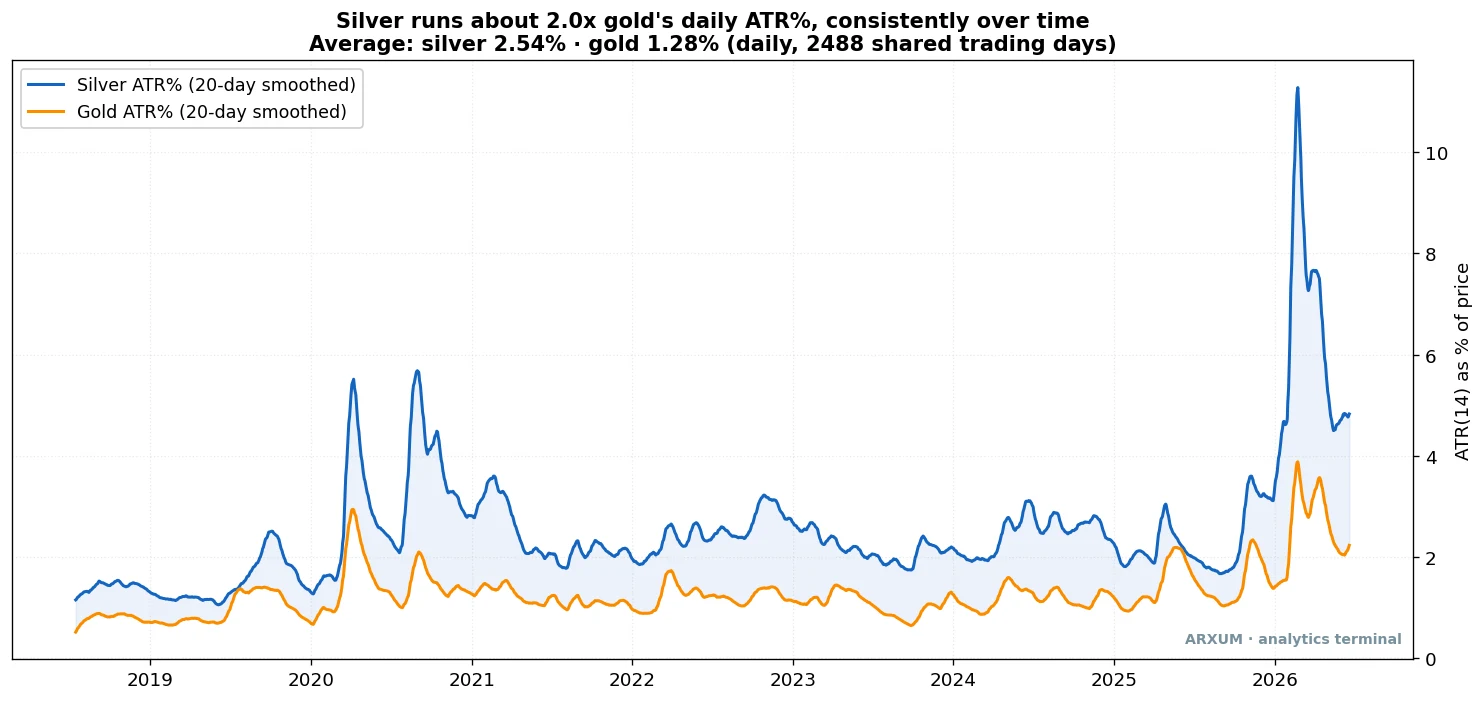
The blue line is silver’s daily range as a percent of price, smoothed. The orange line is gold’s.
It sits above gold at every point across the full window, not just on average.
One term, because it carries the point. ATR% is the average true range written as a share of price: roughly how far the market travels in a day, in percent.
Silver’s ATR% is 2.54%, gold’s is 1.28%, so it runs about twice as far each day.
That 2x is the single most useful number for a silver trader:
- Your stops need roughly double the room you would give gold, in percent terms.
- Your position size comes down to keep the dollar risk the same.
- The payoffs are bigger too. A clean silver trend produces larger winners than the same trend on gold, which is the upside of the volatility.
The spike on the far right of that chart is real. Silver had a violent squeeze recently where its smoothed range pushed past 11%.
That was an extreme, not the norm, and I will flag where it flatters the numbers later.
The gold-silver ratio, and what it actually tells you
Before the setups, one idea every silver trader eventually hears about: the gold-silver ratio. It is worth understanding because it is genuinely useful, and worth caveating because it is badly oversold.
The ratio is just the gold price divided by the silver price. Folklore says a high ratio means silver is cheap relative to gold and due to catch up.
We tested that honestly by bucketing every day into a high, middle, or low ratio and reading the metal’s own forward return from there.
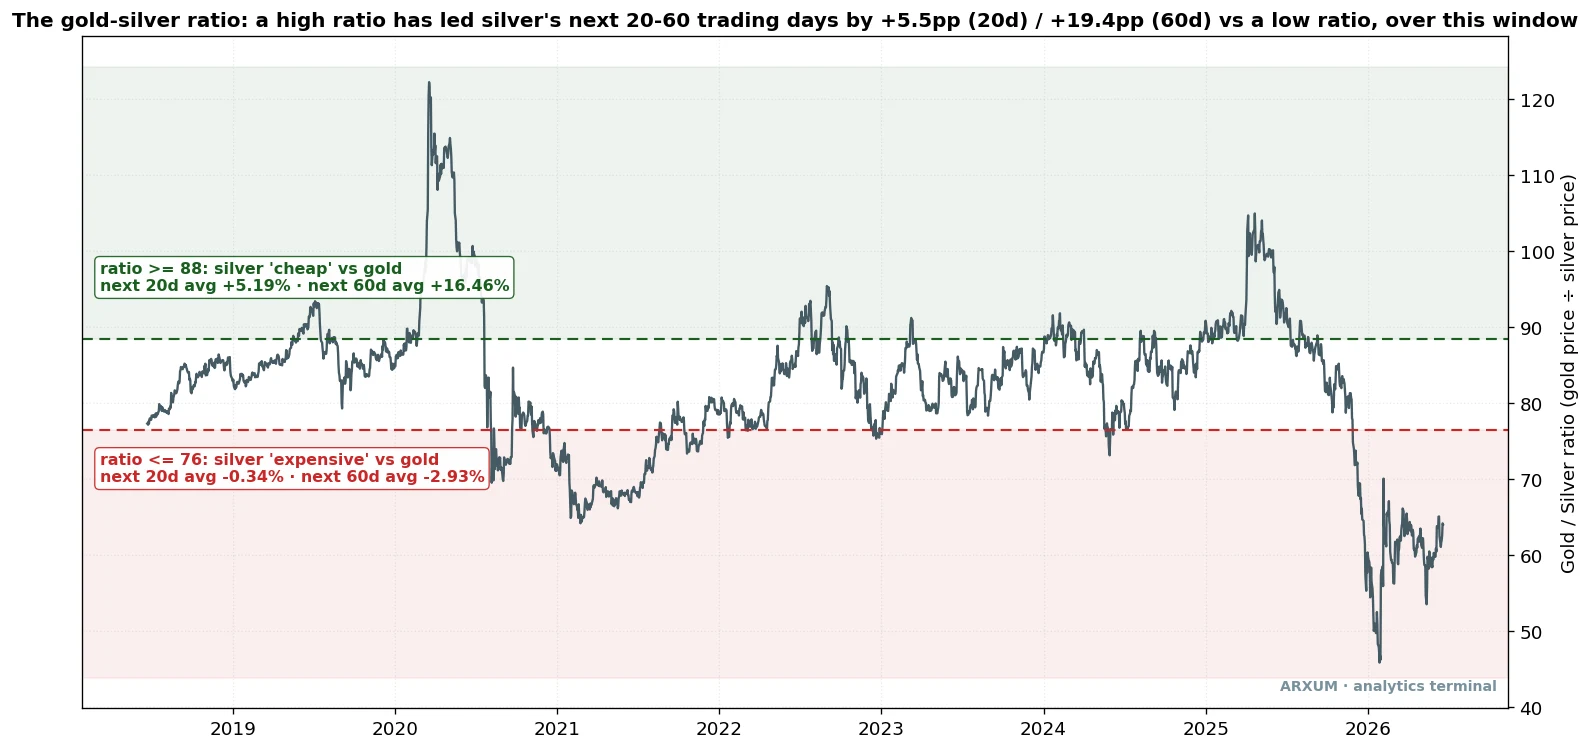
The read is clear on the long horizon. When the ratio was high, meaning the metal was historically cheap against gold, its next stretch was materially stronger.
- From a high ratio: silver averaged +5.2% over the next 20 trading days. Stretch the horizon to 60 days and that grew to +16.5%.
- From a low ratio: silver averaged -0.3% over the next 20 days. Over 60 days it was -2.9%, the opposite tilt.
So the folklore holds, on a slow lens. But here is the honest limit.
This is a positioning read, not a trade trigger. On a faster 4-hour window the same effect nearly vanished, because “20 to 60 bars” there is only a few calendar days, and the ratio does not work that fast.
Treat it as context. A high ratio is a quiet tailwind for holding silver longs over weeks and months, not a reason to buy this afternoon.
The one lesson that governs every silver setup
Now the setups. We built three mechanical plays and tested each one long and short across eight years.
The single most important result is this chart, so look at it before the details.
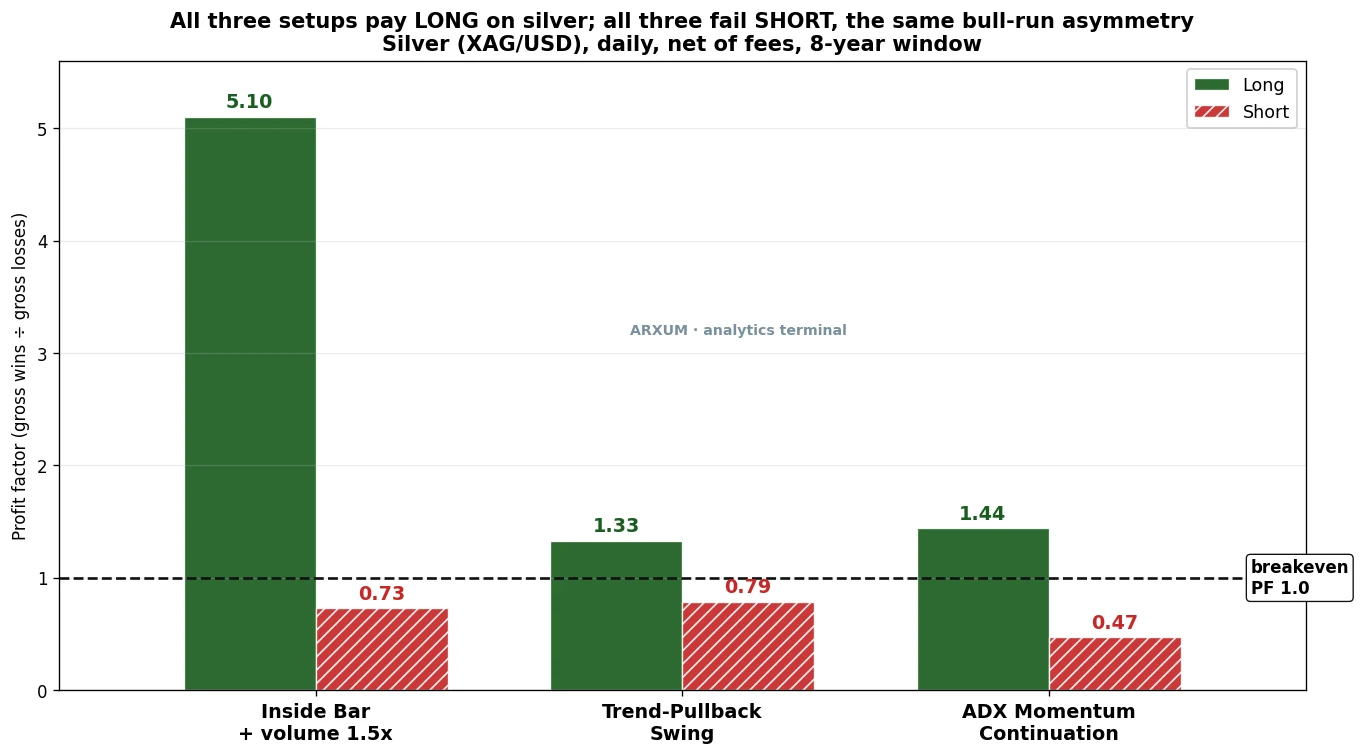
The metric on that chart is profit factor: every dollar a setup won divided by every dollar it lost. Above the dashed 1.0 line it makes money; below it, it bleeds.
The green bars are long, the red hatched bars are short. Read the shape: all three setups clear the line long, and all three sit under it short.
The inside-bar play is the standout at 5.10, the other two are solid at 1.33 and 1.44, and every short version loses.
That is not a coincidence across three different triggers. It is silver’s bull run showing through. On a market in a strong uptrend, a mechanical short is a bet against the tide, and it drowns.
Keep that in your head through the next three sections. We will lead with what works, then explain why the short side fails.
Setup 1: the inside-bar breakout on volume
This is the headline, the setup that earned a profit factor of 5.10 on the daily chart. It is also the simplest to see.
We break the pattern itself down on its own, across more markets, in the inside bar guide.
One thing to know before the examples below. Each worked trade is pulled from a different year of the eight-year test, so silver trades at very different price levels from one to the next, anywhere from the $30s to the $80s, and that is the price moving over the years, not the setup changing.
An inside bar is a quiet day that trades entirely inside the previous day’s range. The big prior day is the mother bar; the small day that coils inside it is the inside bar.
It is a pause, a coil, and when price breaks out of the mother bar’s range the coil releases.
The rules, coded strictly:
- Regime: only take longs while price is above the 200-EMA. Regime just means what kind of market you are in, up-trending or not. The 200-EMA is a slow average of the last 200 days, and above a rising one means an uptrend. It is the trend filter.
- The pattern: a mother bar, then an inside bar coiling within it.
- Entry: a buy-stop at the mother bar’s high. A buy-stop is a resting order that fires automatically only if price rises to your level, so you are in only when the breakout actually happens and you do not have to watch the screen.
- The confirmation: the breakout bar’s volume must be at least 1.5 times its 20-day average. A real break brings a crowd. One caveat on a silver CFD: that volume histogram is tick volume, a count of price updates rather than true contracts traded, so read it as relative not absolute. It still works cleanly as the filter here.
- Stop: below the setup. Target: twice the risk, a 1:2 reward.
Here is one that worked.
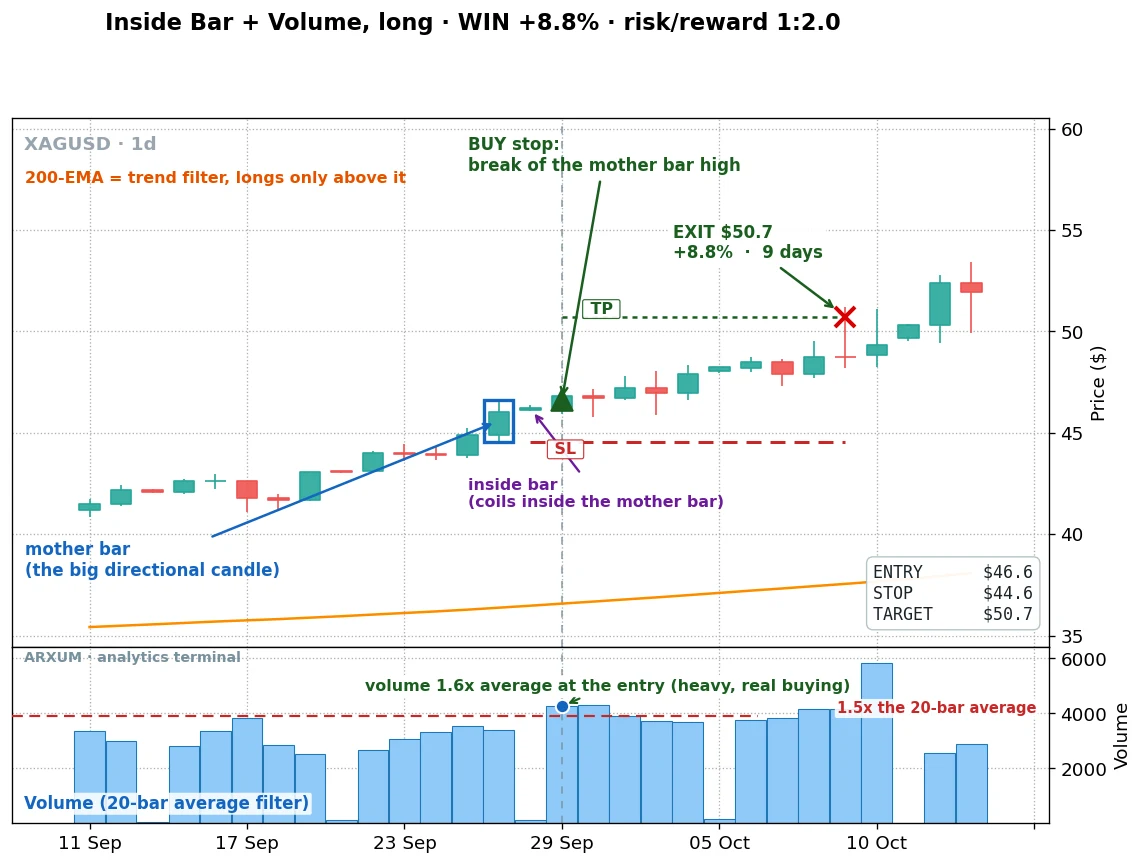
Trace it. The blue-boxed mother bar is the big directional candle, and the small inside bar coils inside it.
Price then broke the mother bar’s high, and the volume bar underneath jumped to 1.6 times average, so the filter passed.
The entry was $46.6, the stop $44.6, the target $50.7, reached nine days later for +8.8%. The vertical line marks the entry instant across both panels, so you can see the breakout candle and the volume spike line up.
The volume 1.5x rule is the whole edge here. Without it the same pattern is close to a coin flip. With it, you skip the quiet breakouts that drift over the line and fail, and keep the ones with real buying behind them.
To read it on your own chart, add a 20-period volume average and only take the break when the breakout bar clearly towers over it.
Now the honest half. A filter improves your odds; it does not buy certainty.
Here is one that qualified and still lost.
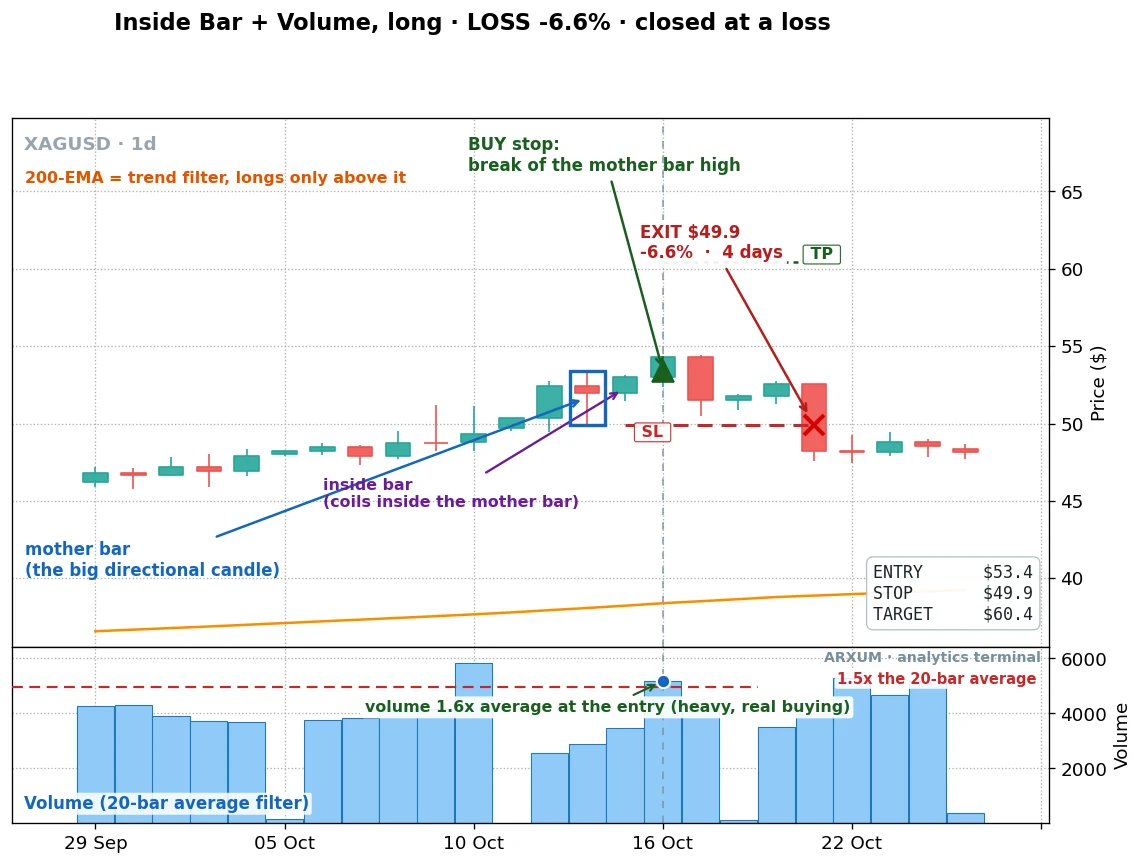
Same setup, same 1.6x volume read at entry. Price broke out at $53.4, stalled, rolled over, and hit the $49.9 stop four days later for -6.6%.
The filter did its job and the trade still lost. That is normal, and the math survives it because the winners run to a full 1:2 while the losers stay capped at the stop.
Two winners and a loser are anecdotes. Here is the whole trade history, a $1,000 account compounded through every signal at 2% risk per trade.
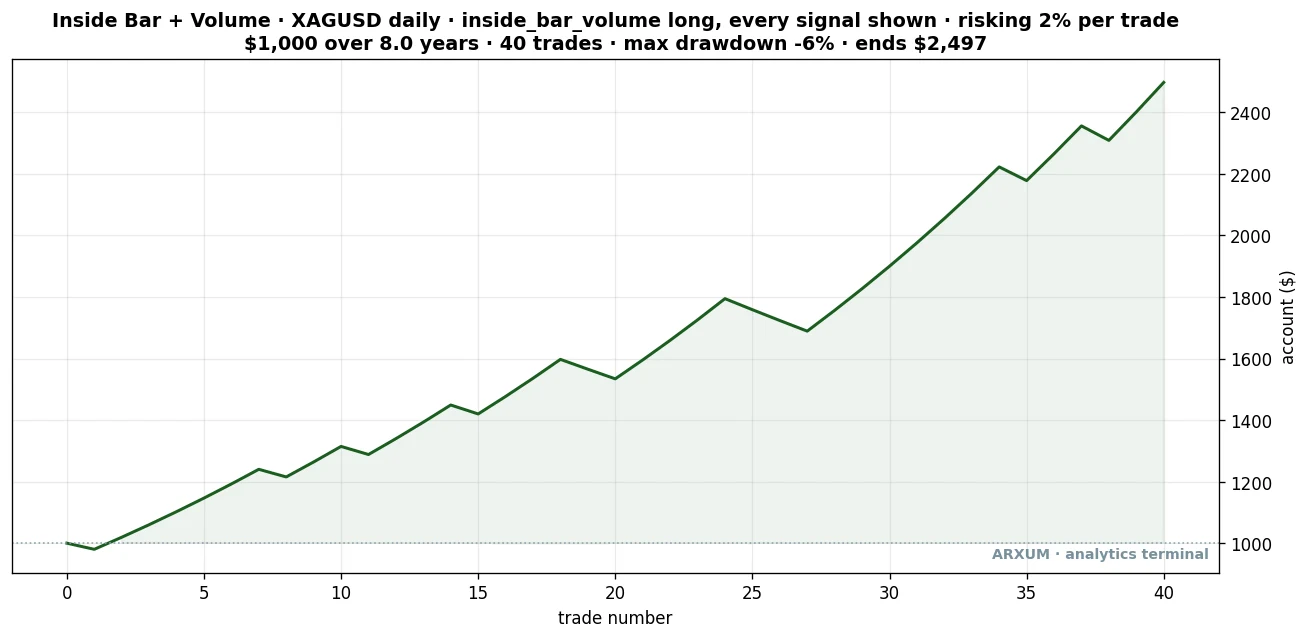
| Trades | 40 |
| Win rate | 72.5% |
| Reward-to-risk | 1:2.0 |
| Profit factor | 5.10 |
| Net return on $1,000 | +150% (→ $2,497) |
That is the standout curve of this whole study: a 72.5% win rate, a smooth rise, and a drawdown that never got worse than 6%. Drawdown is the deepest dip from a high point in your account, so a 6% one means the roughest stretch cost you 6% before recovering.
That 6% is the risk-managed equity path, the account curve when every trade is sized to 2% risk. The same setup measured as a raw sum of its wins and losses had a deeper 14.3% dip, and the 2% sizing rule is exactly what compresses that into the gentle 6% you see above.
The volume filter is selective, so it only took 40 trades in eight years, but the quality of those trades is why the line is so steady.
One number to be square about. That result checked out on data it was never fit to: the edge survived when we split the years and tested the later, unseen half.
It is real, not a curve-fit to one lucky stretch.
Why the short side of this setup fails
Flip the same rules to sell the breakdown of a mother bar’s low, and the setup falls apart.
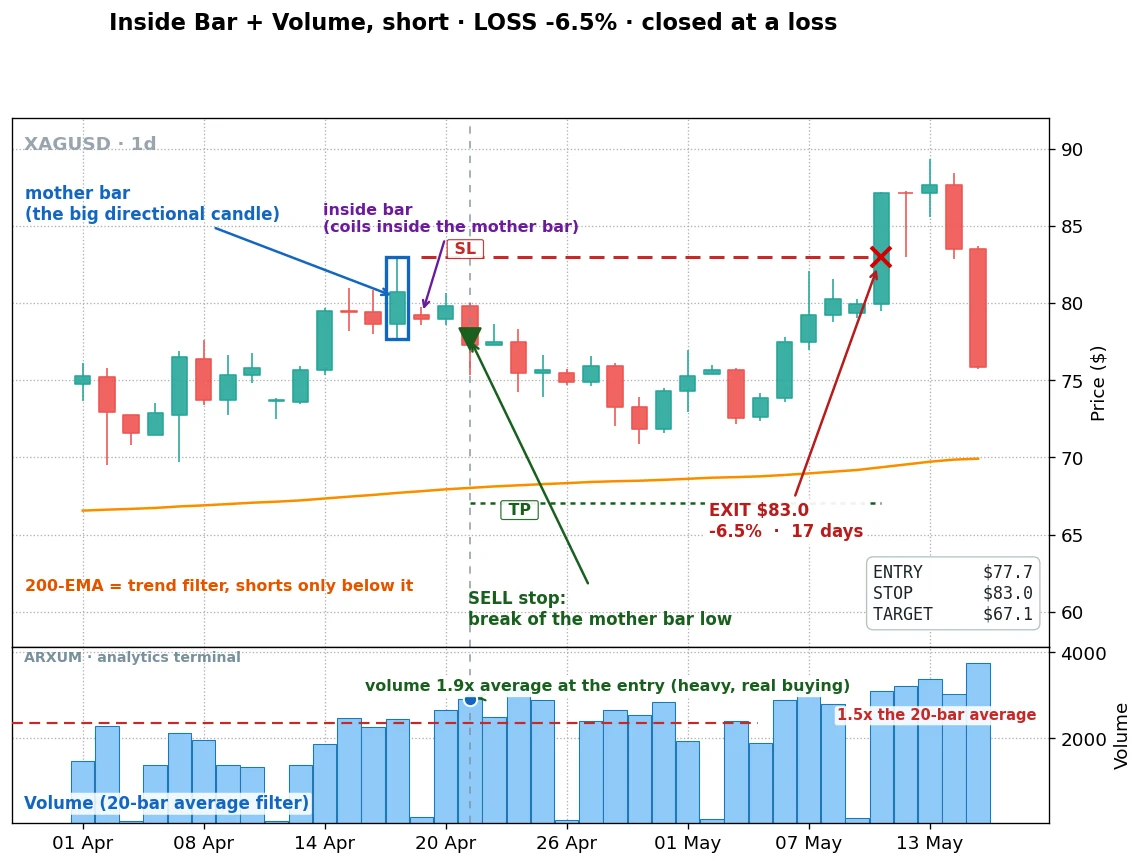
This short even had a heavier 1.9x volume read, the kind of conviction you would want. It did not matter.
Price broke the mother bar low at $77.7 and dropped briefly, exactly as a short wants. Then the bull trend reasserted and dragged it back up to the $83.0 stop, a -6.5% loss.
The trend was up, and the short was a bet against it.
Across the full test the short version posted a profit factor of 0.73, a clear loser. Same trigger, same volume filter, opposite result, entirely because of direction.
Setup 2: the trend pullback, which wants calm not volume
The second setup is a different animal, and it teaches an important lesson: the confirmation that helped setup 1 actively hurts this one. There is no single magic filter you bolt onto everything.
The same pullback logic, tested across five markets, lives in the swing trading guide.
The idea is to buy a dip inside an uptrend rather than a breakout. The rules:
- Regime: price above the 200-EMA, an uptrend.
- The pullback: price dips to touch the 20-EMA, a faster average that tracks the recent trend, then closes back above it.
- Entry: the re-close on the trend side. Stop: the recent swing low. Target: 2.5 times the risk.
Here is a clean one.
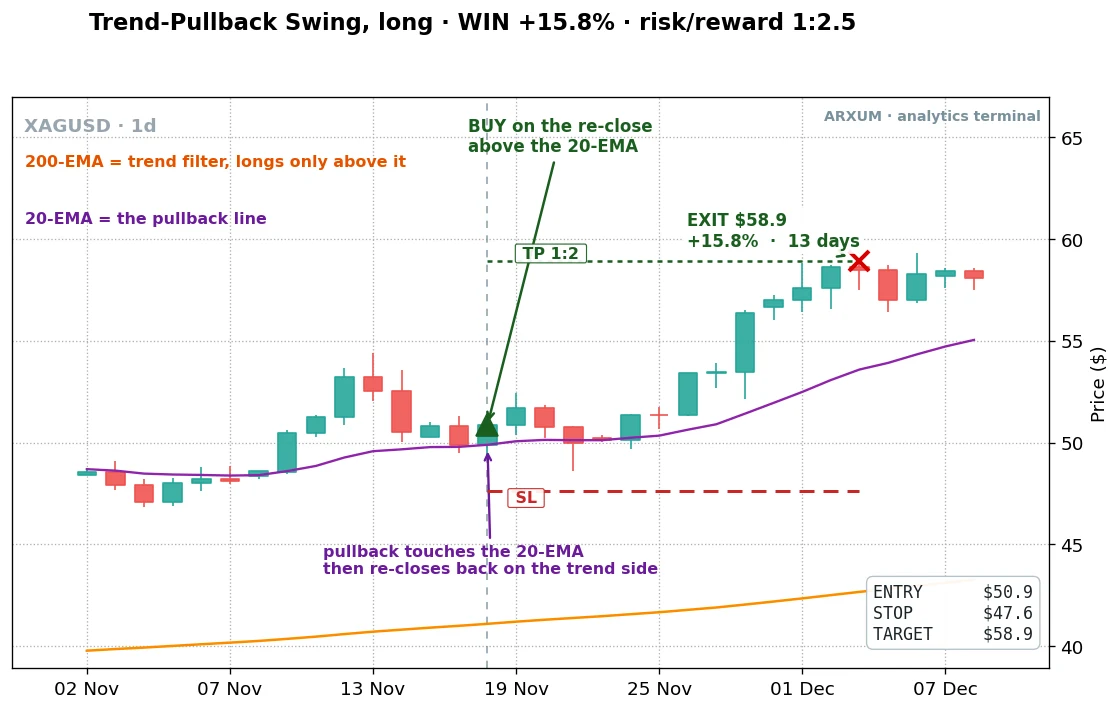
Price was above the 200-EMA, so the trend was up. It dipped to the purple 20-EMA, then closed back above it, which was the buy.
Entry $50.9, stop $47.6, target $58.9, reached 13 days later for +15.8%.
For this setup, the confirmation the data rewarded was not volume. It was a calm market: taking the pullback only when the recent range was quieter than usual lifted the edge, while a volume filter dragged it down.
The plain reason is that a pullback in a calm, orderly trend is more likely to resume than a jerky one in a chaotic tape. You read calm by eye when the candles shrink and the daily range tightens before the entry.
The losers here tend to be quick. When the trend is not really there, the re-close fails fast.
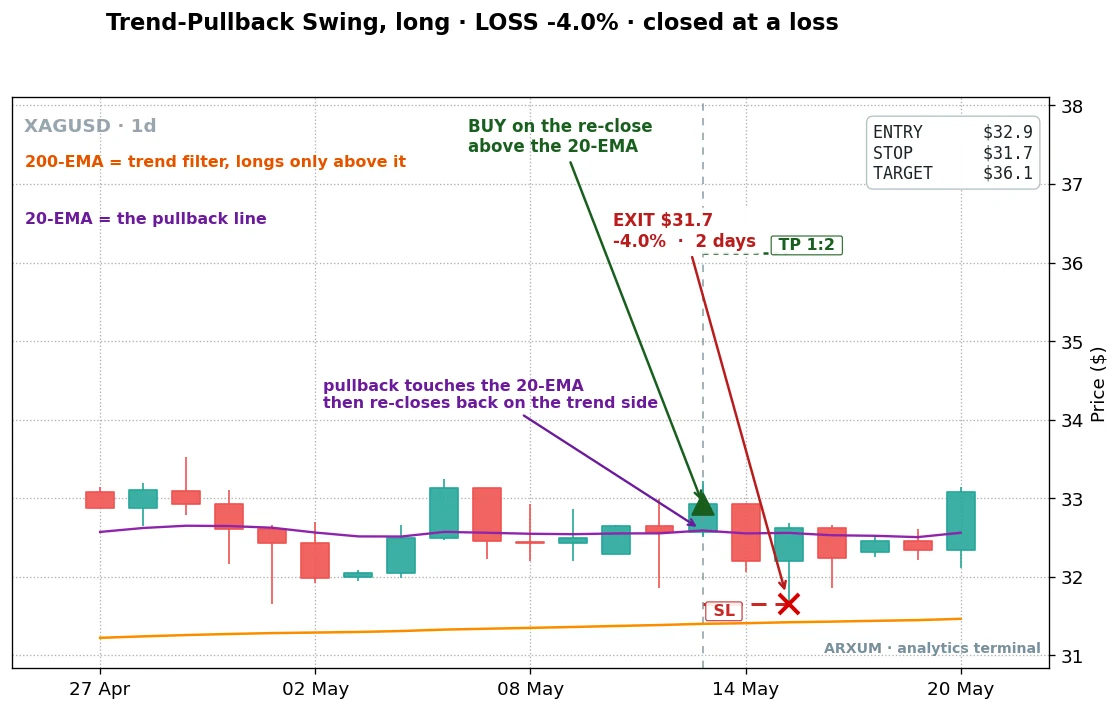
This one entered at $32.9 on the re-close, but the market was going sideways rather than trending, so it stopped at $31.7 two days later for -4.0%. A small, fast loss, which is exactly what you want a losing trade to be.
Here is where the calm filter earns its place. On its own, taking every pullback, this setup posted a 1.33 profit factor, the modest green bar on the edge chart above.
Screening for calm conditions lifts it to the numbers below.
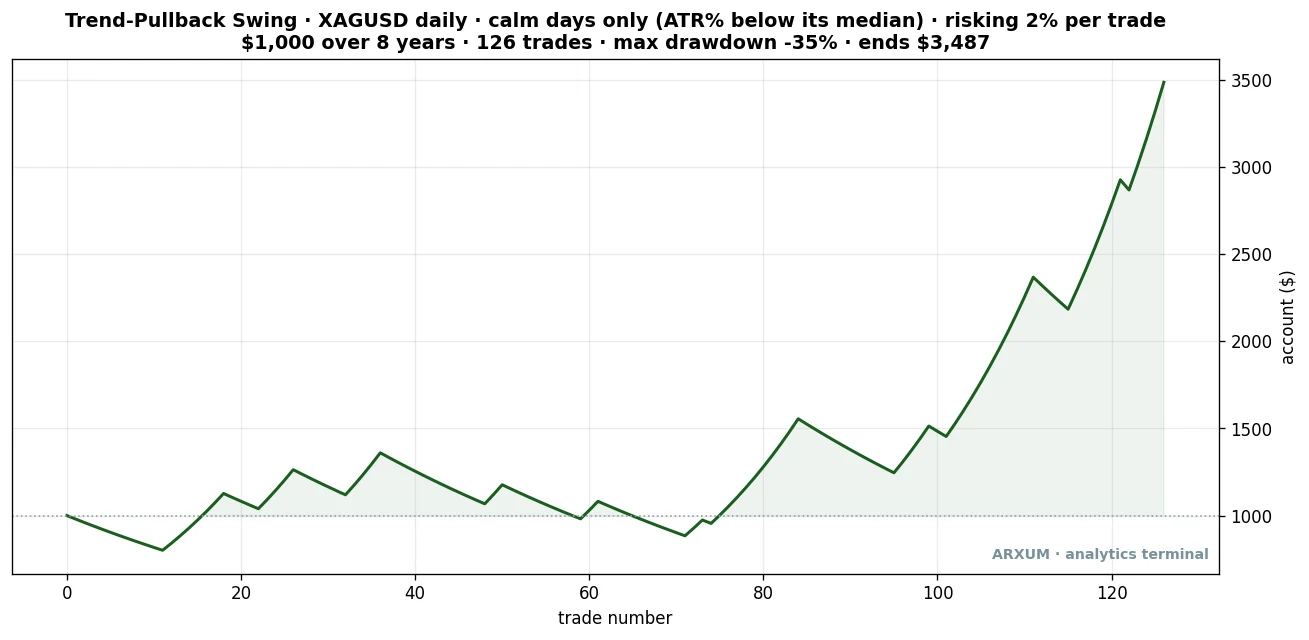
| Trades | 126 |
| Win rate | 43.7% |
| Reward-to-risk | 1:2.5 |
| Profit factor | 1.96 |
| Total return | +215.8% |
A 43.7% win rate with a 1.96 profit factor is the honest profile of a trend-follower: you lose more often than you win, and the 1:2.5 reward more than carries it. This filtered version fires often enough to be the workhorse of the three.
One honest note on the ride. Measured raw as a full unmanaged position, rather than the 2%-risk equity path, this setup’s roughest dip ran to about 90%, and that deep number is exactly what the 2% sizing rule exists to keep survivable.
Like setup 1, this one also held on data it was never fit to, its profit factor rising to 1.72 on the later, unseen half of the years.
The short version of this pullback lost too, a 0.79 profit factor, the same story as setup 1.
Setup 3: ADX momentum, and an honest caveat
The third setup buys strength directly: a fresh high while the trend is already established. It is the most aggressive of the three, and it comes with the biggest asterisk.
The rules:
- Regime: price above the 200-EMA.
- The trigger: a fresh 20-day high.
- The strength filter: ADX above 22. ADX is a trend-strength gauge; above 22 means a real trend is in force, not chop. It says nothing about direction, only about whether a trend exists.
- Stop: the recent swing low. Target: twice the risk.
Here is a clean win, deliberately chosen from a normal stretch rather than the wild squeeze.
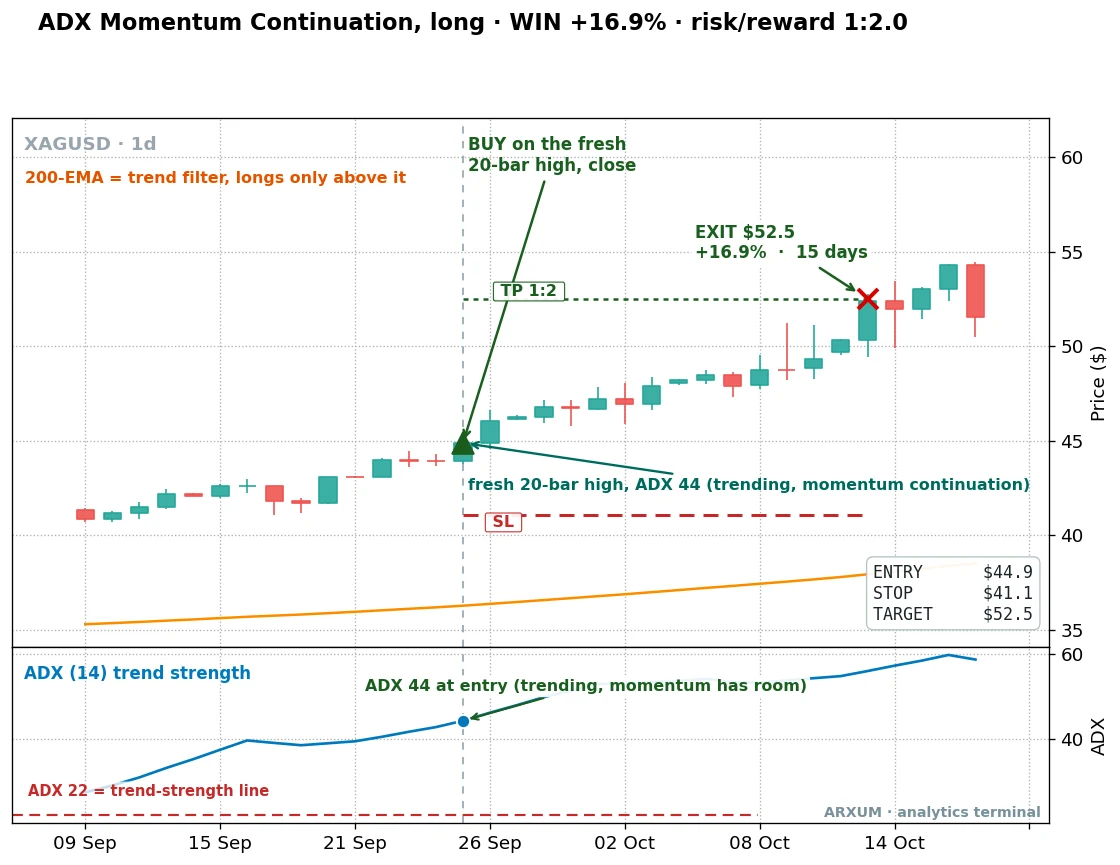
Price made a fresh 20-day high while the lower ADX panel read 44, well above the 22 line, so the trend had real force. Entry $44.9, stop $41.1, target $52.5, hit 15 days later for +16.9%.
The ADX panel is the point: you can see the strength reading at the entry bar, not just guess at it.
Now the loss, and it is a big one, which is the caveat made visible.
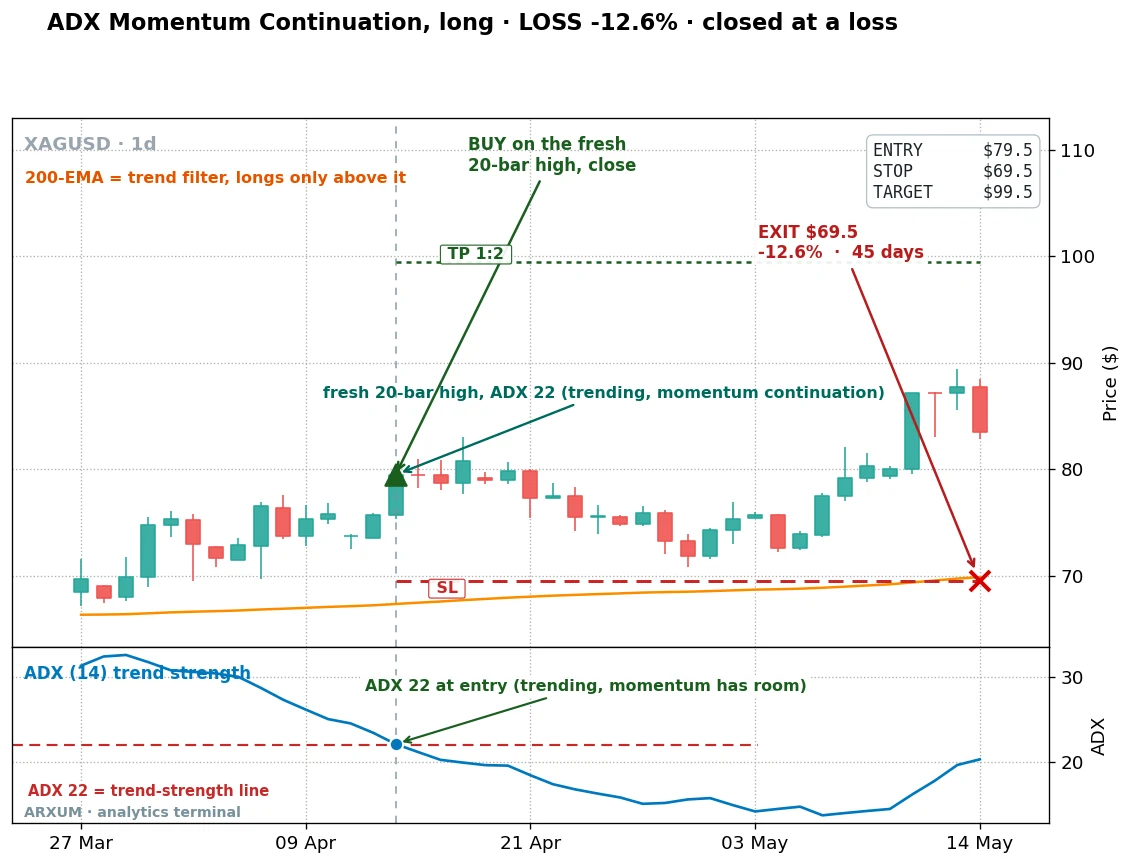
This entry came on a borderline 22 ADX reading, the weakest that still qualifies. Price never followed through, ground sideways and down for 45 days, and stopped at $69.5 for -12.6%.
Note the difference from the winner: ADX at 44 had force behind it, ADX at 22 was a trend barely worth the name.
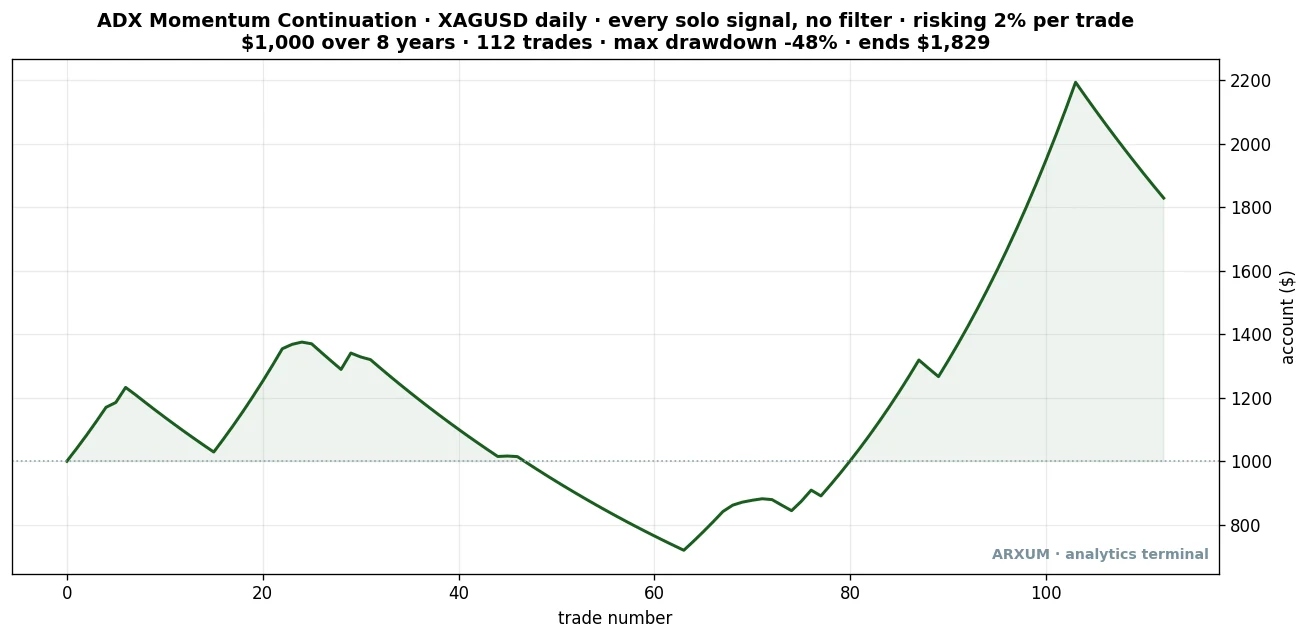
| Trades | 112 |
| Win rate | 45.5% |
| Reward-to-risk | 1:2.0 |
| Profit factor | 1.44 |
| Total return | +285.2% |
Here is that flattering I promised to flag, plainly. This setup’s headline return is flattered by that recent silver squeeze.
Several of its largest wins clustered in one six-week window where the metal went vertical. Measured raw as a full unmanaged position, its worst drawdown over the eight years ran to about 96%, the deepest of any setup here, and only the 2% sizing rule turns a curve that rough into something a real account can hold.
The setup genuinely works beyond that event, and its profit factor is positive on the calmer years too. It also held on the later, unseen half of the data, its profit factor there coming in at 1.63.
But do not expect squeeze-sized gains as the norm. It is the most volatile of the three in every sense.
Like the others, the short version was a loser, a 0.47 profit factor, the worst short result of the three.
Why every short failed, and what to do about it
Three different triggers, three different filters, one identical short-side verdict: they all lost. That is the most important thing this study found, so it deserves a plain explanation rather than just a number.
Silver has been in a multi-year uptrend. Buy-and-hold returned nearly +300% over this window.
When a market rises that hard for that long, any mechanical short is fighting the primary trend, and the trend wins far more often than the trigger. Even a technically perfect short setup gets run over, exactly like the 1.9x-volume short earlier.
This does not mean shorting silver is impossible forever. It means:
- In the current bull regime, trade silver long only. The data is unambiguous.
- The 200-EMA is your regime switch. As long as price holds above a rising 200-EMA, you take longs and ignore short signals.
- If the bigger trend genuinely reverses, and the 200-EMA rolls over with price beneath it, the short side can open up. Let the regime tell you, not a single red candle.
Match the tool to the market. Right now the market is up, so the tool is a long.
Profit factor and reward-to-risk are not the same thing
Two numbers in this article both look like “1-point-something,” and beginners blur them. They answer different questions.
- Reward-to-risk (1:X) is about a single trade. The 1 is your risk, the distance from entry to stop. The X is the reward. A 1:2 trade makes twice what it risked. It is set before you enter.
- Profit factor is about the whole strategy: total dollars won divided by total dollars lost across every trade. Above 1.0 the strategy makes money. The inside-bar’s 5.10 means it won $5.10 for every $1 it gave back.
You can have a strong per-trade reward-to-risk and a weak profit factor if you lose often enough, which is why both matter. The risk-reward ratio guide walks through the per-trade figure in detail.
How to trade silver, step by step
Here is the whole method for how to trade silver, in order, with a real sizing example so the numbers are concrete.
- Confirm the regime. On the daily XAG/USD chart, is price above a rising 200-EMA? If yes, you are looking for longs only. If no, you stand aside.
- Pick your setup. The inside-bar breakout for the cleanest, most selective entries; the trend pullback for the most frequent; the ADX momentum play for riding established strength.
- Wait for the trigger. A mother-bar-high break on 1.5x volume, or a 20-EMA pullback re-close in a calm tape, or a fresh 20-day high with ADX above 22.
- Place the order. Three fields. A buy order at the trigger price, a stop-loss at the setup’s swing low, and a take-profit at twice the risk (2.5 times for the pullback). For the inside-bar play, that is a buy-stop resting at the mother bar’s high.
- Size it for silver’s swings, then sit still. Size to your risk, not your conviction, and let the trade reach its stop or target without fiddling.
Now a worked example, from the account down, on silver itself. Its low price per ounce makes it far more affordable to size than gold, which is a real advantage for a small account.
Say you have $500 to trade, you risk 2%, and a trend-pullback trigger fires with entry at $32.0 and stop at $30.5.
- Risk budget: 2% of $500 = $10.
- Risk per ounce: $32.0 entry − $30.5 stop = $1.50 per ounce.
- Position size: $10 ÷ $1.50 = about 6.5 ounces of silver.
Now you turn 6.5 ounces into an order. Brokers do not sell loose ounces; they sell in lots, the standard trade unit you type into the Volume box.
This is where the account type decides everything.
On a standard micro account the smallest silver lot you are allowed to buy is around 50 ounces. That is nearly eight times the 6.5 ounces your risk allows, so the smallest trade you could place would blow well past your 2% limit.
On a micro account, with $500, you stand aside on this one.
A cent account solves it, because it lets you trade a fraction of a lot where a micro account will not. Your position in lots is just your 6.5 ounces divided by that same 50-ounce standard lot, which comes to 0.13 of a lot, the number you enter in the Volume box.
The “hundredth of the normal size” is the other half of why this works: a cent account values each lot at roughly a hundredth of a standard one, so committing 0.13 of a lot there stakes cents of margin rather than the full amount. The lot figure and the hundredth are two different things, one your position size and one the account’s scaling, and together they are what make a $10 risk placeable on $500.
Your loss if the stop hits is your planned $10. That is the real, placeable version of this silver CFD trade on $500.
The rule underneath it is the one that keeps you alive: the size bends to the risk, never the other way. Never widen the stop to force a bigger position, and never risk more than your 2% to make a lot fit.
If the smallest lot your broker offers already risks more than 2% of your account, that account and setup do not match yet, so either use a cent account or trade a smaller position elsewhere. Charting is free on TradingView, so you can practice reading these triggers before a cent is live: type the ticker XAGUSD, then open the Indicators button and add the 200-EMA and ADX to have the two filters this guide leans on on your screen.
On MT4 or MT5 the same two filters sit under Insert, then Indicators, then Trend for the Moving Average set to 200 with the Exponential method, and Oscillators for ADX.
What silver costs you, and the discipline that pays
Silver rewards patience and punishes ego, more so than gold because everything is amplified. Two of the three setups win less than half the time.
The money is made by letting the winners reach a full 1:2 or 1:2.5 while the stop keeps every loss small.
That shapes the discipline in a way specific to this market:
- Expect losing streaks, and size for them. The pullback and ADX setups win around 44 to 46% of the time, so three or four losses in a row is ordinary variance, not a broken method. On silver those losses hit harder in dollar terms if you oversized, which is why the 2% rule is not optional.
- Six losses in a row is the warning bell. That is beyond normal, and the signal to check whether silver has stopped trending and gone sideways. Chop is where these trend setups quietly stop working.
- Do not chase the squeeze. When silver goes vertical, the temptation is to pile in bigger. That is exactly when the deep drawdowns happen. Keep your size constant.
- Watch live results calmly against these numbers. A rough week is variance, not a verdict. A sustained gap, live running much worse than the test across a real sample of trades, is the signal to step back and check whether the regime has changed, not to double down.
None of this is a promise. It is a tested edge in one bull regime, and edges fade when conditions change.
Only ever trade money you can afford to lose, and let the 200-EMA, not your mood, decide when silver is a buy.
If you remember three things from this guide, make them these:
- Trade long only while price holds above the 200-EMA. That single line is your regime switch.
- Each setup has its own filter, so use it. Volume for the inside bar, a calm tape for the pullback.
- Size to 2% risk, and on $500 that means a cent account. The size bends to the risk, never the reverse.
Where to go from here
The tools this method leans on each have their own guide:
- The inside bar pattern breaks down the mother-bar setup that anchored the strongest silver result, across more markets.
- The Average True Range guide explains the volatility measure behind silver’s 2x character, and how to use ATR to set stops that respect it.
- Exponential moving averages covers the 20-EMA and 200-EMA that do the regime and pullback work here.
- The gold trading guide is the calmer sister market, worth reading side by side to feel the difference in ride.
- The risk-reward ratio explainer covers the 1:X figure every trade in this article is measured by.
FAQ
How to trade silver, in plain terms?
Does trading silver actually work?
Why is silver more volatile than gold?
What is the best silver trading strategy?
What is the gold-silver ratio and can I trade it?
Can you short silver?
What timeframe is best for trading silver?
How much money do I need to start trading silver?
Why does a low win rate still make money on silver?
How many losses in a row should I expect trading silver?
What do the key silver trading terms mean?

Quant Researcher & Systems Builder
Quantitative researcher who builds the automated systems behind Arxum strategy testing. Works in Python and Pine Script, using AI alongside classic backtesting to validate strategies on years of real data.