

What is swing trading? The idea in one picture
Here is the whole idea on one real chart of gold. Price is in an uptrend, it dips for a few days, then it turns back up and runs.
A swing trade tries to buy near the bottom of that dip and ride the leg back up. If you want the textbook swing trading definition in one line, that leg is the “swing,” and holding it for several days is the trade.
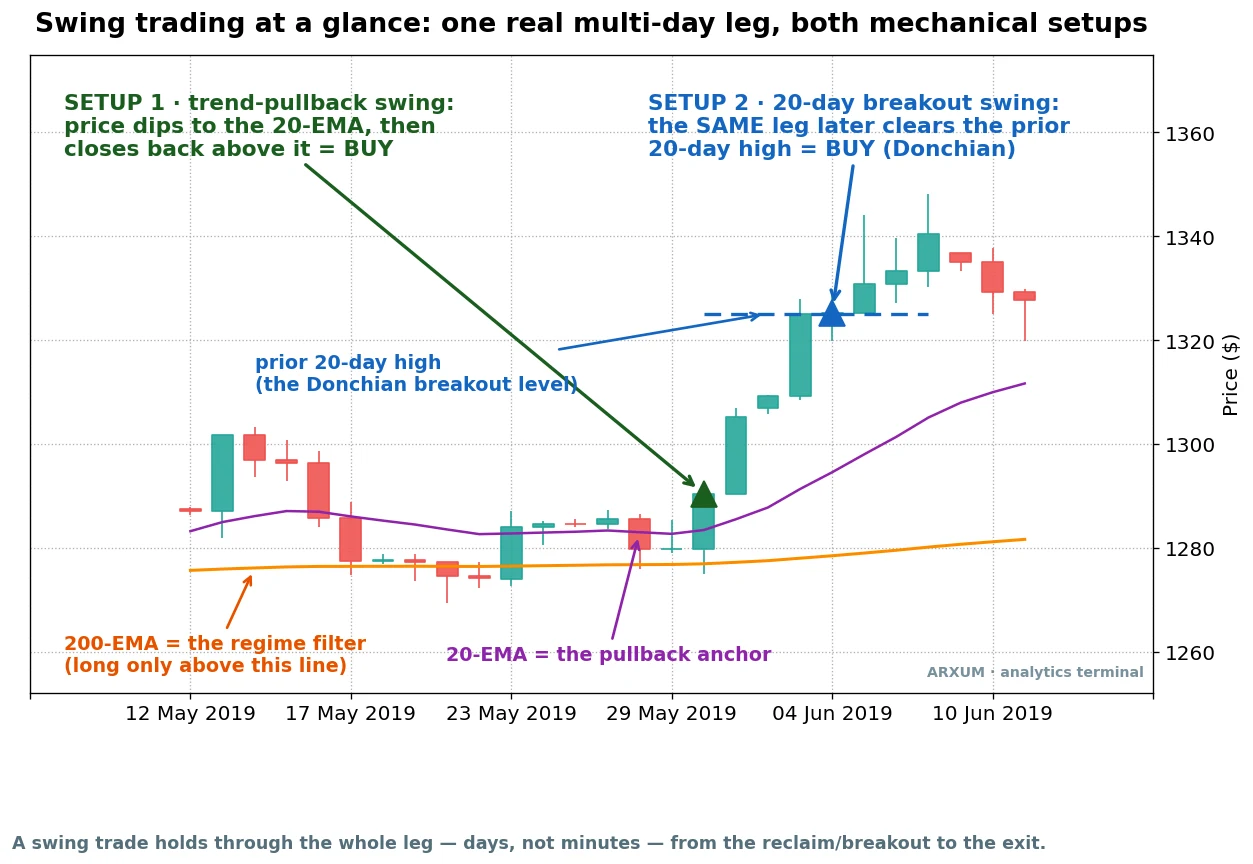
Look at the two triangles. The green one is a pullback: price sagged to the purple line, the 20-EMA, a fast moving average defined in the next section, then closed back above it.
That reclaim is a buy. A few days later the same leg pushed through the prior month’s high, the dashed blue level, and that breakout is a second, separate way to buy the exact same move.
Both trades want the same thing: a market that is already trending, then a defined moment to get in. Everything below is about turning those two moments into rules, then showing you what the rules actually did over eight years, wins and losses both.
The one-line definition: a swing trade holds through a whole leg of a move, days to weeks, from the entry to the exit. That is the entire concept.
The skill is in the entry, the exit, and knowing which market to point it at.
The simplest way to explain swing trading is by what it is not. You are not a day trader closing everything by the bell, and you are not an investor holding for years through every dip.
You are catching one clean move and stepping aside.
Where swing trading sits
Swing trading is the middle gear between frantic and glacial. It helps to see it next to its neighbours before we go further.
| Style | Hold time | Trades a month | Screen time | Overnight risk |
|---|---|---|---|---|
| Day trading | Minutes to hours | 50-200 | Hours a day | None, flat by the close |
| Swing trading | 2 days to a few weeks | 5-20 | 30-60 min a day | Yes |
| Position trading | Weeks to months | 2-8 | Minutes a day | Yes |
| Investing | Months to years | A handful a year | Almost none | Yes |
The trade-off is honest and worth stating. Against day trading, you give up nothing in screen time but you carry positions overnight, so a gap while you sleep can move the trade before you can react.
Against investing, you are far more active, and you will miss the biggest multi-month runs because you take profit on a single leg. For someone with a job, swing trading is usually the only active style that fits a real schedule, which is a big part of why swing trading draws so many people leaving the day-trading grind.
A fuller side-by-side lives in our swing trading vs day trading breakdown.
The parts of a swing trade, named up front
Before a single number, here are the four things every setup below uses. Meet them now so no line on a chart is a mystery later.
- The 200-EMA (the regime line). EMA just means a moving average that leans on recent prices more than old ones. The 200-day version is a slow line that tells you the big-picture direction. Price above it, the trend is up and you only look for buys. Price below it, the trend is down and you only look for sells. It is the orange line on every chart here, and it is free on any charting site.
- The 20-EMA (the pullback anchor). A faster average, about a month of trading. In an uptrend price keeps dipping to this line and bouncing. It is the purple line, and it is where the first setup hunts for an entry.
- ADX (the trend-strength gauge). One number, roughly 0 to 50, that says how forceful the current trend is, not which way it points. Higher means a stronger push. We mark it in a panel under each trade chart with a line at 22, because that is the level where a trend is real enough to bother with. Common cut-offs are 20 and 25; 22 is simply where the edge showed up in our testing.
- The prior 20-day high (the breakout level). The highest daily close of the last month, drawn as a dashed line. When today’s close clears it, price has made a fresh one-month high, and that is the trigger for the second setup. This is a Donchian level, named after the trader who popularised it; there is a deeper dive in our Donchian channel guide.
That is the whole toolkit. Two averages, one strength gauge, one breakout line.
Nothing else is needed to trade either setup.
Setup 1: the 20-day breakout swing
This is the swing trading setup to learn first, because it made money on every single market we tested. The idea is old and plain: in an uptrend, buy the moment price closes at a fresh one-month high, because that break usually means a new leg is starting.
The rules, start to finish:
- Regime: only look for buys when price is above the 200-EMA. Uptrends only.
- Entry: buy when today’s close breaks above the highest close of the prior 20 days.
- Stop: the opposite side of the channel, the lowest low of the recent window. It is a wide stop on purpose, so normal noise does not shake you out of a good breakout.
- Target: a fixed reward of twice your risk. If your stop sits a certain distance below the entry, your target sits twice that distance above it. That is a reward-to-risk of 1:2: you stand to make two dollars for every one you put at risk.
- Direction: long only in an uptrend. The short mirror is covered further down, and it comes with a large asterisk.
Here is one of those trades on spot gold (XAU/USD), a clean recent winner.
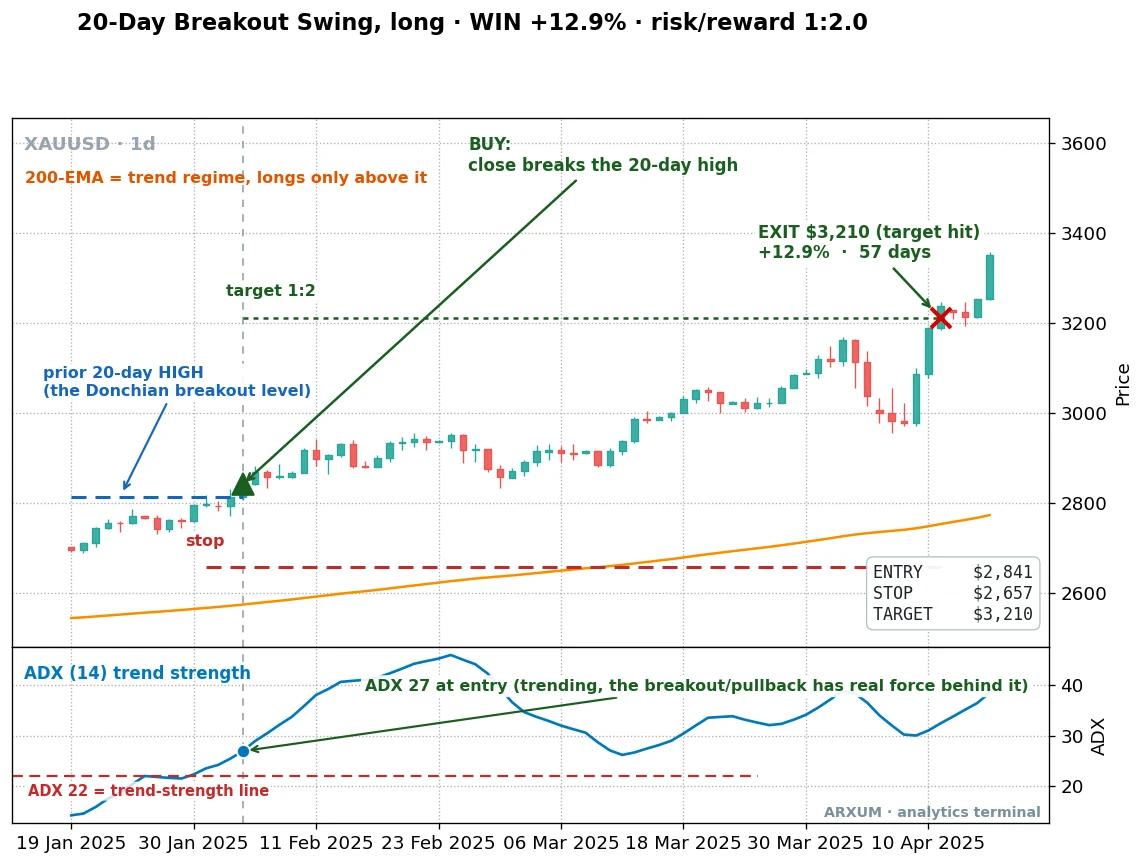
Walk it through. Price had spent weeks capped under the dashed blue level.
One candle closed cleanly above it, and that close is the green entry triangle at $2,841. The stop went under the channel at $2,657.
The target, twice the risk, sat at $3,210.
Check the panel underneath. ADX read 27 at entry, comfortably over the 22 line, so this was a genuine trend and not a limp drift.
From there the trade did nothing exciting for almost two months, which is exactly what a swing trade is meant to feel like. It ground higher, tagged $3,210, and closed for a 1:2 winner, up about 13% over 57 days.
Now the same setup ground up over the full eight years, one dollar at a time.
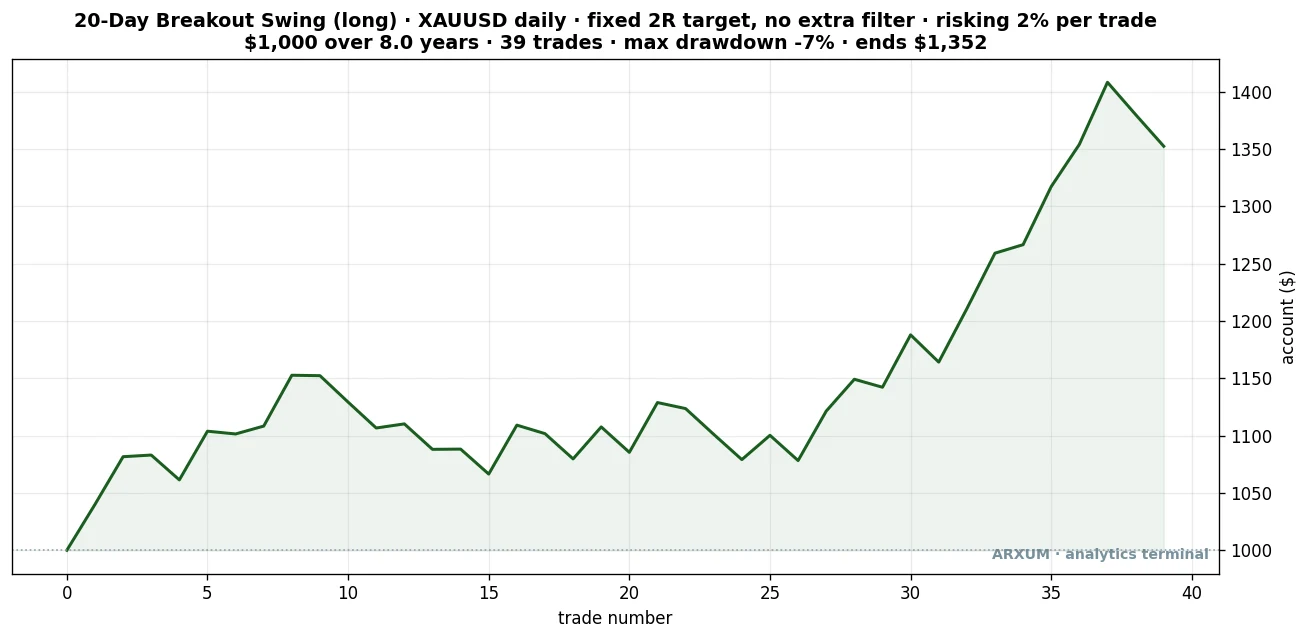
A balance curve is just your account plotted dollar by dollar as each trade closes. A beginner cannot read one at a glance, so here is how to read this one:
- The line climbs when the setup wins, dips when it loses. Read the shape, not the exact dollars.
- It is jagged, with a long flat-to-down stretch in the middle. That patch is a losing streak, and it is completely normal.
- The account risked 2% a trade over 39 trades and eight years, never drew down worse than about 7% from a peak, and ended at $1,352.
Slow, patient, positive. That is what a real edge looks like, not a straight line up.
| Trades | 39 |
| Win rate | 53.8% |
| Reward-to-risk | 1:2 |
| Profit factor | 1.80 |
| Net return on $1,000 | +$352 |
Two of those rows carry the article, so define them plainly.
Profit factor is total dollars won divided by total dollars lost across every trade. Above 1.0 is profitable, and 1.80 means the setup made $1.80 for every $1.00 it gave back.
Win rate is just how often it won. At 53.8% it wins a little more than half the time, and you do not need better than that when your winners are twice the size of your losers.
One more check before trusting these numbers: we split the eight years in half and re-ran the breakout on the later, held-out half alone. The edge held up there too, not just in the earlier years the rules were shaped against, which is what tells you this is a real pattern and not a curve fit to one stretch of history.
When the breakout fails
A setup that only shows you winners is a sales pitch. Here is the same breakout on gold, stopped out for a loss.
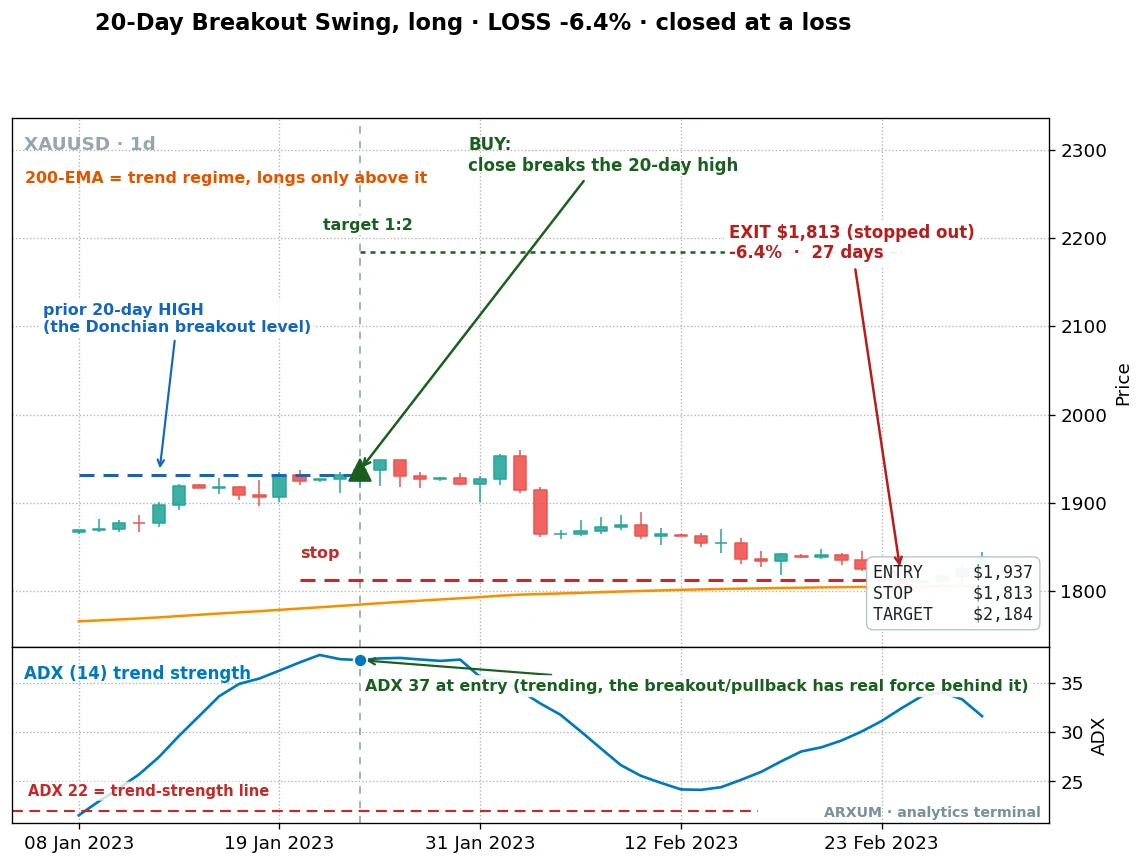
This one did everything right on the way in. Price closed over the dashed level, ADX read 37, a strong trend by any measure.
It qualified cleanly. Then it rolled over, drifted down, and clipped the stop 27 days later for a 6.4% loss.
The target line at $2,184 is drawn even though price never got near it, so you can see exactly where the trade would have paid.
That is the honest half of any breakout system. A strong reading at entry is not a promise.
Some clean breakouts just fail, and the wide channel stop is what keeps that failure to a single, bounded loss instead of a disaster.
Setup 2: the trend-pullback swing
The second swing trading setup buys the same uptrend a different way. Instead of waiting for a fresh high, it waits for a dip and buys the recovery.
The logic is that strong trends do not go straight up; they breathe. Each pullback to the 20-EMA is a chance to join the trend at a better price.
The rules:
- Regime: price above the 200-EMA. Uptrends only, same as before.
- Entry: price pulls back to or below the 20-EMA, then closes back above it. That reclaim is the buy.
- Stop: the low of the pullback itself, the swing low that just formed.
- Exit: here is the twist. Instead of a fixed target, we trail the 20-EMA. Once the trade has gained as much as you first risked, the stop ratchets up under the rising 20-EMA and follows it, locking in ground as the trend runs. You exit when price finally closes back below the line.
Because a trail exits wherever the trend finally dies, its reward-to-risk is not fixed at 1:2. Each trade lands on a different figure, and you only know it after the fact.
That is why the numbers below vary trade to trade.
Here is a pullback buy on gold that used that trailing exit.
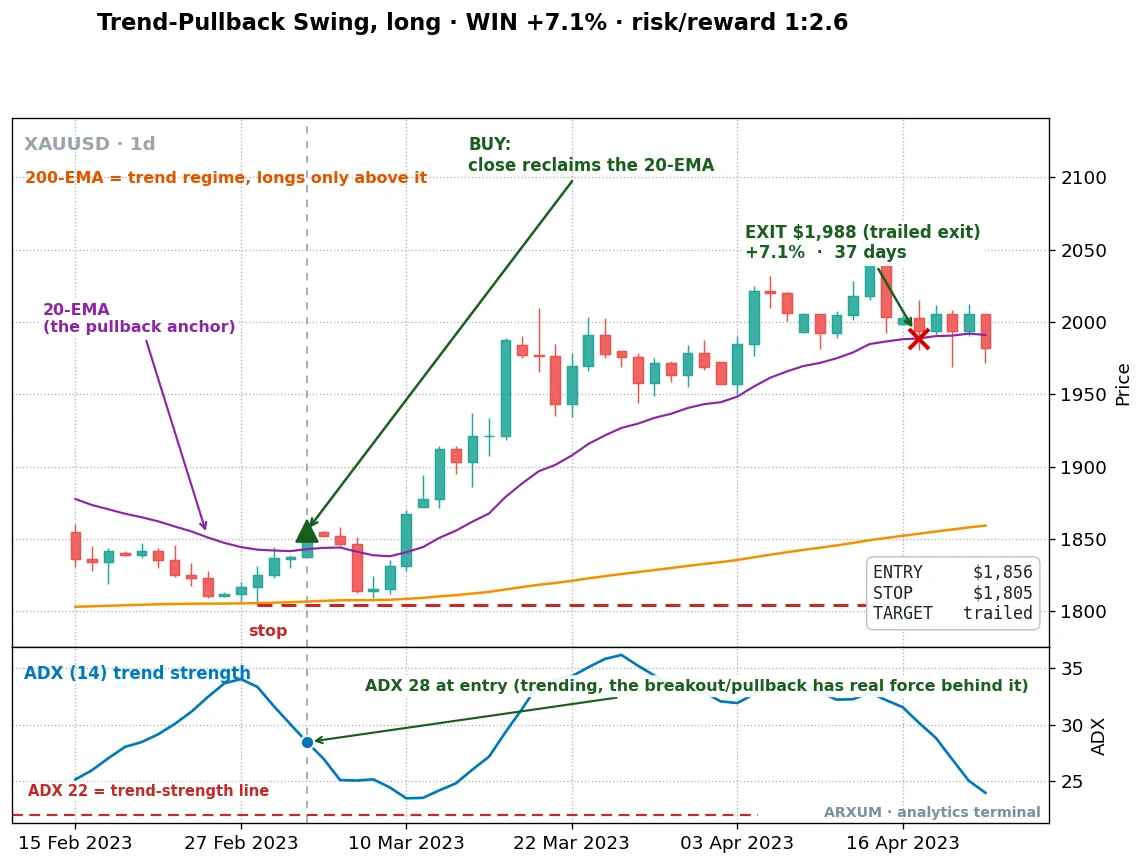
Price had dipped under the purple 20-EMA, then closed back above it. That reclaim is the green entry at $1,856, with the stop tucked under the pullback low at $1,805.
ADX read 28, a real trend. Then, instead of aiming at a fixed price, the exit trailed the rising 20-EMA.
The trade rode the line up for 37 days and closed when price finally lost the average, banking about 7%. Because it ran further than a fixed 2:1, that reward-to-risk came out at 1:2.6: the winner made about 2.6 times what it risked.
Its balance curve over eight years is a different shape from the breakout’s, and that difference is the whole point.
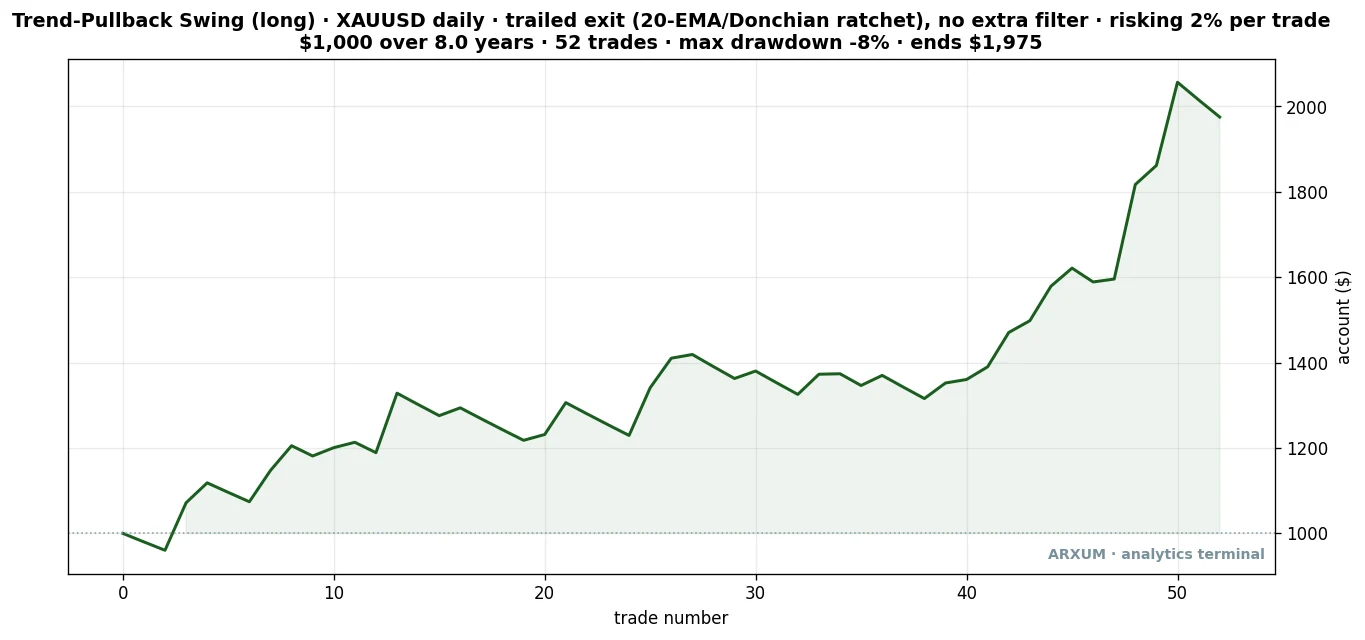
Same starting stake, same 2% risk, same market. This version took 52 trades, drew down about 8% at its worst, and finished at $1,975, nearly double where it started.
Put the two gold curves side by side and the pullback with a trail clearly outran the breakout with a fixed target. Hold that thought, because it is the finding this whole guide turns on.
| Trades | 52 |
| Win rate | 53.8% |
| Reward-to-risk | 1:1.7 average |
| Profit factor | 1.70 |
| Net return on $1,000 | +$975 |
That 1:1.7 averages all 52 trades, losers included. Single strong winners like the 1:2.6 above run higher.
When the pullback fails
The pullback fails the same honest way the breakout does. Here is one on gold that got caught in a fast reversal.
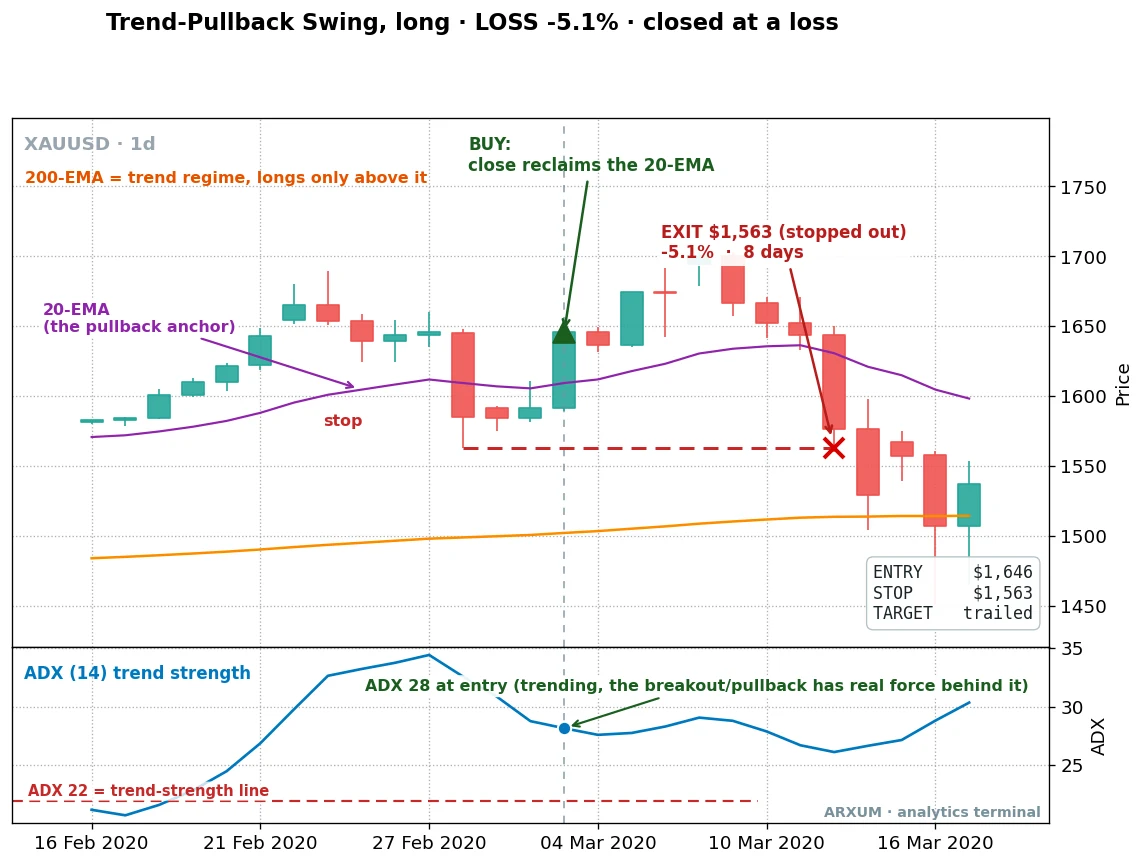
Price reclaimed the 20-EMA cleanly, ADX read 28, everything lined up. Then the broader market cratered and dragged this trade down with it.
It was stopped out just 8 days later for a 5.1% loss. Even a valid entry into a real trend fails when the whole market turns over fast.
The stop under the pullback low did its job and kept the damage small.
The exit matters more than the entry
Here is the lesson buried in those two gold curves, and it is the most useful thing in this guide. We tested both swing trading setups two ways: with a fixed 2:1 target, and with the trailing exit.
The exit choice moved the numbers more than the entry choice did.
- The pullback loves a trailing exit. On gold its profit factor climbed from 1.33 with a fixed target to 1.70 with the trail, and the total return more than doubled.
- On silver the same swap took it from barely-working to a profit factor above 2.0. Letting a pullback trade run under a trailing stop, rather than capping it at 2:1, is where its edge comes alive.
- The breakout prefers a fixed target. Counterintuitively, trailing actually cost the breakout a little on gold, dropping its profit factor from 1.80 to 1.39.
- A breakout tends to make one clean measured move, so grabbing a fixed 2:1 and leaving beats giving profit back waiting for more.
So there is no single right exit in swing trading. It depends on the entry.
A pullback wants room to run; a breakout wants to book its move and go. That nuance is worth more than any indicator setting, and it lines up with a rule we see in every system we build: how you get out matters at least as much as how you get in.
Does the swing trading edge travel? Five markets
One market proves nothing. A swing trading setup that only works on gold in a bull run is a story, not an edge.
So we ran both setups, long and short, across five markets over eight years and lined up the results.
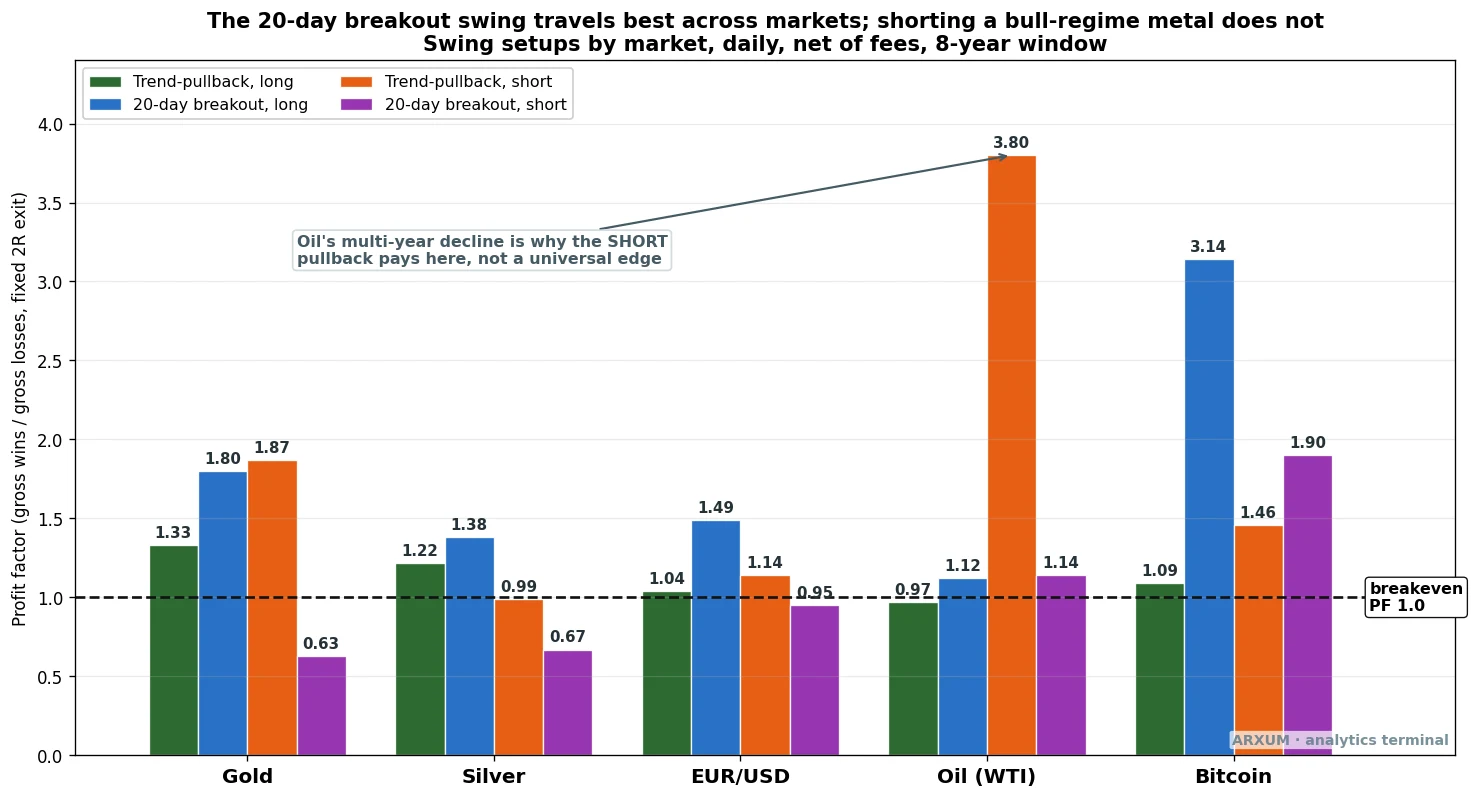
The blue bars are the 20-day breakout long, and they tell the cleanest story on the chart. That setup stays above the profit line on every market: gold, silver, the euro, oil and Bitcoin.
Nothing else is that consistent. If you take one thing from this section, take the breakout long as your default swing tool.
A few honest reads off that chart:
- The breakout long is the traveler. It clears the profit line on all five markets, from a solid 1.80 profit factor on gold up to a striking 3.14 on Bitcoin, and never dips below breakeven anywhere. The blue bars in the comparison chart carry the exact figure for each market.
- Shorting a rising metal is the worst combination. Look at the purple bars for gold and silver, both well under 1.0. Selling breakouts down in a market that is structurally rising is exactly backwards, and the data punishes it. Direction has to match regime, and the regime on metals over these years was firmly up.
- The euro is the weakling. Every bar for EUR/USD huddles near the line. That is not a flaw in the setups; it is the euro. Over these eight years it went basically nowhere, and a trend-following setup starves when there is no trend to follow.
That euro point deserves a plain takeaway, because most readers here trade Forex. These two setups want a market that actually trends.
Gold trended, oil trended, Bitcoin trended, and they paid; the euro chopped sideways and they didn’t.
The honest advice for a Forex trader is to point these setups at a trending pair or a trending market like gold, and to sit on your hands when your pair has gone flat. Matching the tool to the market beats forcing a trade.
The oil short: a real exception, honestly explained
There is one bright orange bar on that chart that breaks the pattern. On oil, the pullback short posted a profit factor of 3.80, the best single number on the board.
That is real, and it needs an honest explanation rather than a victory lap.
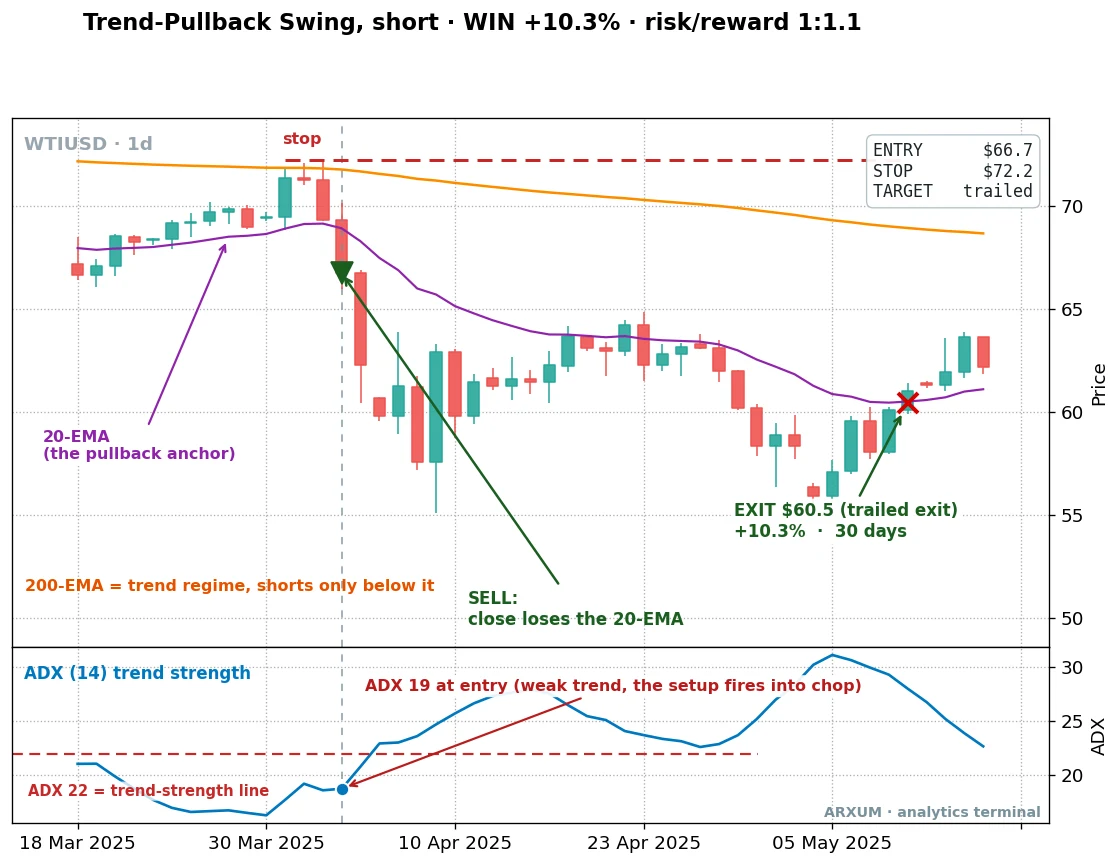
This is the mirror of the pullback setup, flipped for a downtrend. Price rallied up to the 20-EMA, then closed back below it, and that breakdown is the sell, the green triangle at $66.70 (green marks the entry whether you are buying or selling).
The stop went above at $72.20. The trade trailed the falling 20-EMA down for 30 days and closed near $60.50, up about 10%.
A quick note on how a retail trader takes a trade like this: through a CFD, a contract that simply tracks the price of oil or gold so you can go long or short without owning the barrel or the bar. It is the standard account type for trading these markets, and on it a short is nothing exotic, just a sell order.
Notice the ADX panel: it read 19 at entry, under the 22 line, a weak trend. This one paid anyway, an honest reminder that the levels are guides, not gospel.
So why does shorting work on oil when it fails on gold? Because oil spent most of these eight years grinding lower, while gold spent them climbing.
Over the window, simply buying and holding oil returned about 10%; gold returned over 200%.
In a market that drifts down for years, selling every rally back below the 20-EMA keeps paying. This is not a universal short edge you can carry elsewhere.
It is the specific consequence of oil’s soft decade, and the same short setup loses money on the rising metals. If you want to trade oil specifically, our oil trading guide goes deeper on why it behaves this way.
Bitcoin: the biggest number, with a caveat
For completeness, here is the breakout on Bitcoin, the strongest raw result in the whole test.
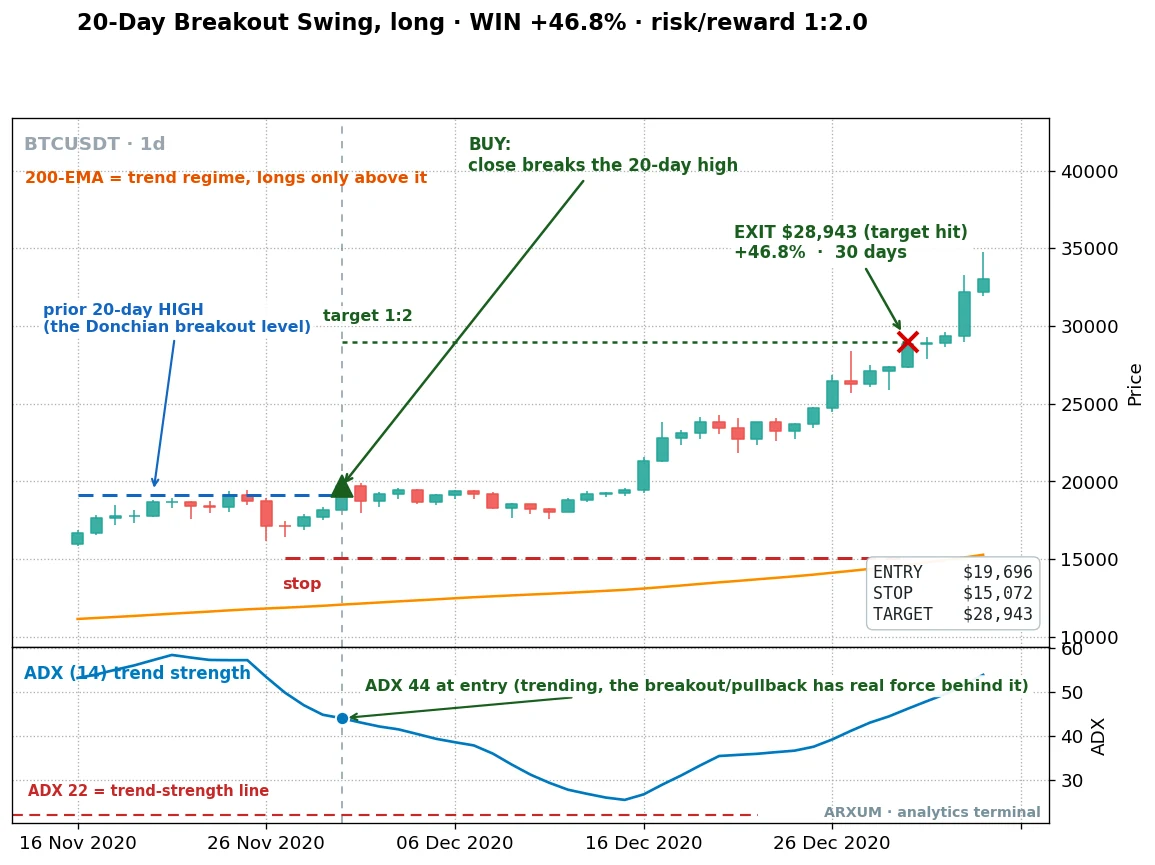
Same rules exactly. Price closed above the prior 20-day high at $19,696, ADX read a blazing 44, the stop sat at $15,072, and the target twice the risk was hit at $28,943 for a 46.8% gain in 30 days.
That single trade shows why Bitcoin’s numbers look so gaudy.
The caveat is important, though. Bitcoin rose so much over these years that any long strategy looks heroic on it, because a big chunk of the gain is just the market rising, not the setup being clever.
That is why we trust the profit factor and the fact that the edge survived on data it was never tuned to, rather than the eye-popping percentage. Gold and silver already prove the breakout travels without Bitcoin’s enormous tailwind.
If crypto is your focus, the same regime logic runs through our crypto trading strategies guide.
Profit factor and reward-to-risk are not the same thing
Two numbers in swing trading both look like “1 point something,” and beginners blur them constantly. They answer different questions.
- Reward-to-risk (1:X) is per trade. It compares one trade’s target to its risk. A 1:2 trade risks one unit to make two. It is set before you enter, by where you put the stop and target.
- Profit factor is for the whole strategy. It is every winning dollar divided by every losing dollar across all trades. Above 1.0 means the system made money overall.
They can disagree. A setup can have a modest 1:2 reward-to-risk per trade and still post a strong profit factor if it wins often enough.
The breakout on gold is exactly that: a plain 1:2 on each trade, but a 1.80 profit factor over 39 trades because it won 54% of the time.
So judge a single trade by its reward-to-risk, and judge the whole strategy by its profit factor. For a fuller walkthrough of the per-trade math, our risk-reward ratio guide lays it out.
The confirmation everyone reaches for is the wrong one
Most swing trading guides tell you to bolt a volume filter onto a breakout: only take the break if volume spikes. It sounds obvious.
The data says it is a mistake here.
When we demanded a volume surge at entry, it actively hurt the strongest setups. The gold pullback’s profit factor fell from 1.33 to 0.71, dropping it below breakeven.
Silver’s breakout collapsed the same way. Volume is not the tell for these swing setups.
One caveat worth stating plainly: on forex, metals and oil, the “volume” your platform shows is tick volume, a count of price updates used as a proxy, not the real traded volume you get on an exchange, which is exactly why skipping it costs you nothing there and why Bitcoin, priced off real exchange volume, is the cleanest market to test the finding on.
What did travel was calm. Entries taken when the market was quieter than usual, with the range tightening rather than expanding, outperformed.
On gold the breakout’s profit factor rose to above 2.5 when we filtered for calm conditions. The plain read: a fresh breakout out of a quiet base beats one chasing an already-loud, over-extended move.
How to see “calm” on a live chart: the candles shrink and the daily range tightens in the days just before the break. You do not need an indicator for it; your eye can spot a market coiling.
If anything, the ADX panel already helps here, and the 200-EMA regime gate is doing the heavy lifting. That is the honest confirmation stack for these setups: trade with the 200-EMA regime, prefer a calm base, and skip the volume filter your instinct wants to add.
Which markets and timeframe for swing trading
Both swing trading setups were built and tested on the daily chart, and that is where they belong. A swing trade holds for days to weeks, so the daily bar is the natural unit.
Faster charts turn the same rules into noise; slower charts give you too few trades to bother with.
On markets, the ranking from the test is clear:
- Best: trending markets. Gold, oil and Bitcoin all trended hard over the window and paid well.
- Weak: flat markets. The euro went nowhere for eight years and starved both setups. A ranging pair is the wrong tool for a trend-following method; a mean-reversion approach suits a range far better.
The lesson is regime, not asset class. These setups reward a real trend wherever you find one, and they bleed in a chop wherever you force them.
One swing trade, worked in real money
Percentages stay abstract until you size a real trade with them, so here is one you could actually place on a small account.
Gold is the star of this guide, but it is an awkward first trade for a beginner. At today’s prices, a 2% risk on a $500 account is $10, and gold’s stops are so wide in dollar terms that $10 does not even reach the smallest tradable size on most brokers.
That is worth saying plainly: on a $500 account, you often cannot take the gold trade at honest risk. You would need a broker offering fractional or cent-sized positions, or simply a cheaper market.
So let’s size the oil short instead, which fills comfortably on a small account. Say you have $500 and you risk 2%, the discipline we will hold to below.
- Account: $500
- Risk budget: 2% of $500 = $10 on this trade
- Entry: sell at $66.70, the close below the 20-EMA
- Stop: $72.20, above the recent swing high. Your risk per barrel is $72.20 − $66.70 = $5.50
- Position size: risk budget ÷ risk per barrel = $10 ÷ $5.50 = 1.8 barrels. On an oil CFD that is well within micro-sized dealing, so the trade actually fills.
- Exit: you trailed the 20-EMA down and closed near $60.50. That is a gain of $6.20 a barrel, so 1.8 barrels made about $11, a touch over one unit of risk.
The point is not the exact eleven dollars. It is that the numbers reconcile: you risked $10, the reward-to-risk was roughly 1:1, and every step is a division you can redo yourself.
Learn the arithmetic on a market you can actually trade, then scale the same math up as the account grows. This is the part of swing trading that quietly separates the people who last from the people who blow up.
If sizing is new to you, our position sizing guide works through it slowly.
How to actually place a swing trade
First, where. To place a real swing trade you need an account with a broker that deals these markets in small, micro or cent-sized positions, so your 2% risk is enough to actually open a trade.
That is the account this guide assumes. TradingView’s free tier is perfect for charting the setups and setting price alerts, but it is a charting tool, not a place to trade, so you still need a broker for the order itself.
On TradingView, type the ticker (XAUUSD, for example) into the search bar, then click the Indicators button and add the 20-EMA, the 200-EMA and ADX by name. In MT4 or MT5 the same three live under Insert, then Indicators, then Trend for the two Moving Averages (set the period to 20 and, separately, to 200, with the method set to Exponential), and under Oscillators for ADX.
Then the clicks. Knowing the size is not the same as knowing where to type it. Take the exact oil short we just sized, so the fields match the trade you already worked out:
- Order type: a sell-stop at $66.70. That means “sell automatically if price falls to this level,” so you don’t have to watch the screen.
- Stop-loss field: $72.20, above the trade, where the setup is wrong.
- Take-profit field: leave it blank. This exit trails, so there is no fixed target price.
- Size field: 1.8 barrels, the number you calculated, small enough that a full stop-out costs only your $10.
- Then manage the trail: every few days, move the stop down to sit just above the latest 20-EMA reading, or let your platform’s trailing-stop tool do it for you.
A breakout buy, the setup we recommend you start on, is the same idea flipped up: a buy-stop at the breakout price, the stop-loss below it at the channel low, and because the breakout uses a fixed exit you do fill in the take-profit, at twice your risk distance above entry. That fixed target is one less thing to manage than a trail, which is why the breakout is the gentler first trade once you have an account that can afford it.
The discipline that keeps you in the game
Neither swing trading setup wins every trade. The breakout on gold loses nearly half its trades; the pullback the same.
They come out ahead because the winners are bigger than the losers, not because they are right often. That single fact drives the whole risk approach.
- Risk 2% of the account per trade. Not more. At 2%, even a rough patch of six losses in a row costs about 12%, which stings but recovers. The equity curves above never drew down worse than 8% precisely because the risk stayed small.
- Expect losing streaks. With a win rate near 54%, four, five, even six losses in a row are ordinary variance, not a broken system. You saw the flat stretch in the middle of the gold breakout curve; that is what a streak looks like. It is not a signal to abandon the plan.
- Don’t chase, don’t revenge-trade. A missed breakout is not a reason to jump in late. A loss is not a reason to double the next size to win it back. The setups only work if you take them as written, including the boring waiting.
- Watch for a genuine, sustained gap, calmly. If your live results run materially worse than these tests over a meaningful run of trades, the market’s character may be shifting, say from trending to ranging. One bad week is noise; a long, persistent gap is worth stepping back to check conditions. Neither is a reason to panic. Only trade money you can afford to lose, and the euphoria after a big winner is exactly when to stick to the same size, not raise it.
None of this is a formula for getting rich by Friday. Swing trading is a patient method with a real, tested edge and honest losses along the way.
That combination, boring as it sounds, is what actually compounds. There is more on the mental side in our trading psychology guide.
Where to go from here
If you take one thing away, take the whole method as a short checklist. This is the 20-day breakout long, the setup that worked on every market tested:
- Pick one trending market on the daily chart, with price above the 200-EMA.
- Mark the prior 20-day high. Wait for a daily close above it.
- Buy that close. Stop under the channel, target twice the risk.
- Risk 2% of the account on the trade, no more.
- Do it twenty times and score each one as a reward-to-risk figure, not dollars, so you learn whether the setup fits you before much is on the line.
That fits on a matchbox, which is usually the sign of a real method rather than a complicated one. For a routine you can run each morning, our how to swing trade walkthrough breaks the daily process down, and the swing trading strategies guide covers a few more setups once these two feel natural.
FAQ
What is swing trading, in plain terms?
Does swing trading actually work?
How much money do I need to start swing trading?
Which timeframe is best for swing trading?
What is the best setup for a beginner?
Should I use a volume filter on breakouts?
Can I short with these setups?
Why does a setup with a 54% win rate make money?
How many trades will swing trading give me?
Can I swing trade with a full-time job?
What do the key terms mean?
Real-time trade setups with entry, stop loss and take profit. Daily market analysis. No subscription, no complicated theory.
🌍 Our recommended brokers


Reader Reviews
Finally a guide that opens with real account data instead of recycled theory. The 44-trade breakdown across EUR/USD and XAU/USD gave me a concrete benchmark to compare my own results against. I've read maybe a dozen swing trading articles this year, this is the only one I saved and came back to twice.
The section on stop placement below structural levels rather than a fixed pip count changed how I think about risk. I used to get stopped out constantly on EUR/USD because I was using 20-pip stops regardless of context. After switching to structure-based stops my win rate on 4H setups went from 41% to 58% over the next 30 trades. Genuinely useful, not just motivational.
The $600 live account transparency is what sold me on this site. Most trading content either cherry-picks results or hides behind "past performance" disclaimers. The 55% win rate with 2:1 R:R is realistic and achievable, it matches what my own demo results looked like before I went live. Good benchmark to work toward.
Very solid fundamentals guide. The part about BTC requiring a larger stop buffer than forex pairs is something I had to learn the hard way last year, glad it's called out explicitly here. Would give 5 stars if there were more worked examples with actual entry/exit prices, not just the framework.
Good, no-fluff guide that respects the reader's time. The 30-60 minutes daily time requirement is accurately described. I've been swing trading EUR/USD for 4 months now and that matches reality. One thing I'd add: a section on what to do when you're in a trade and the setup changes intraday.
The hold time comparison, 2 to 10 days for swing trades versus minutes for day trades, finally made me understand why I kept failing at scalping. My lifestyle doesn't support being glued to a screen. Switched to swing trading after reading this and immediately felt more in control of my risk.
Concrete and specific throughout. Most guides stay vague about entry timing but this one gives actual rules: wait for the daily candle close, check 4H for structure, look for RSI confluence. I backtested those exact criteria on 3 months of GBP/USD data and the results held up. Rare to find that level of specificity.
The risk management section is the backbone of the article and it shows, more depth there than in any standalone risk guide I've read. The formula tying position size to stop distance and account percentage is something I now apply mechanically before every trade. Removed most of the guesswork from my sizing decisions.
What stood out was the honest breakdown of why beginners fail: revenge trading, oversizing, and ignoring session timing. I recognized all three in my own trading from last year. The session timing point especially. I was trading EUR/USD during the Asian session and wondering why ranges were so tight. Obvious in hindsight, useful to see stated directly.
Leave a Review

Quant Researcher & Systems Builder
Quantitative researcher who builds the automated systems behind Arxum strategy testing. Works in Python and Pine Script, using AI alongside classic backtesting to validate strategies on years of real data.
