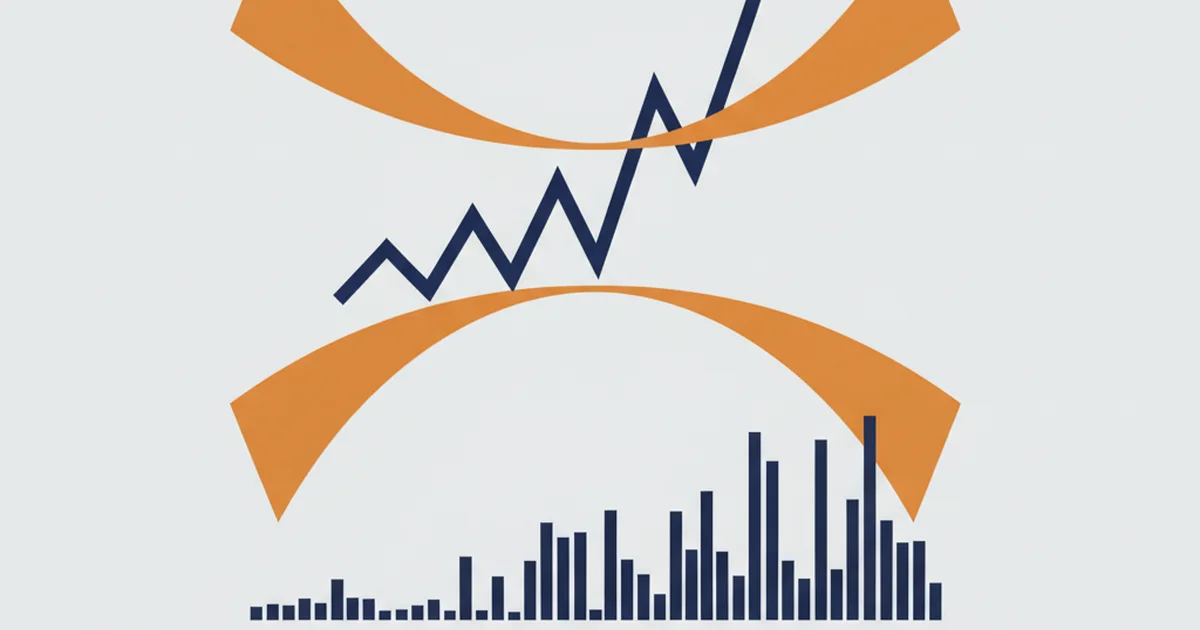

What the bands actually are
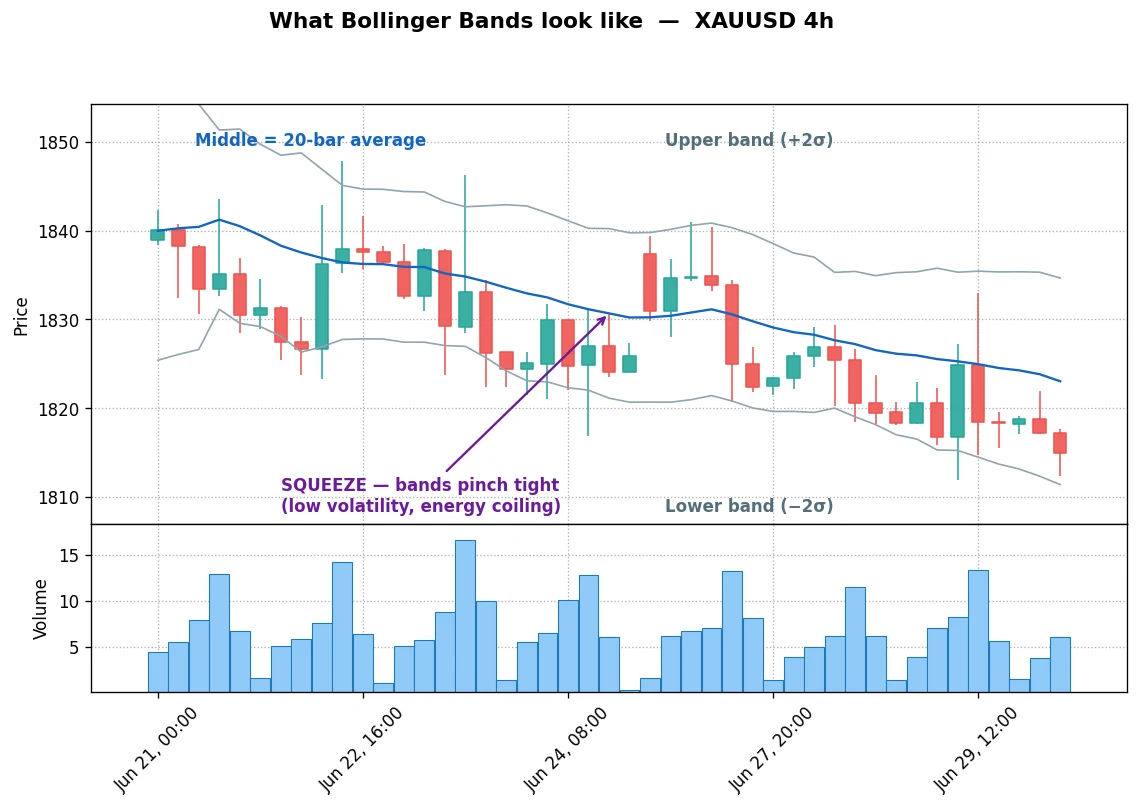
Bollinger Bands are three lines. The middle one is a 20-bar moving average, the average price over the last 20 candles. The outer two ride above and below it at a distance that grows when price gets jumpy and shrinks when it goes quiet.
That is the whole idea. When the bands pinch together, the market is coiling and a move is usually building. When they flare apart, volatility has arrived and a trend is often underway.
Across eight years of gold and EUR/USD, 2018 through 2026, two of these three setups hold up and one mostly doesn’t. What follows is which is which, with the actual trades on the chart, long and short, with trading costs taken out of every one. No theory.
A word before the setups. On the desk we never judged a method on a single good year, and you shouldn’t either. Eight years covers gold’s quiet stretch, its 2020 spike, the 2022 chop, and the run since. A setup that only works in the most recent leg is not a setup, it is a coincidence.
Setup one: ride the bands in a trend
This is the one that pays best, and it is the simplest. In an uptrend, price spends most of its time between the middle band and the upper band, pulling back to the average and pushing off it again.
The rules are short:
- Trend filter: only take longs while price is above its 200-period moving average, a slow trend line every charting platform draws for you. Traders call it the 200-EMA. That single line keeps you on the right side of the market.
- Entry: price pulls back to the middle band and then closes back above it. That close is your trigger.
- Stop: under the pullback low. The gap from your entry down to that stop is what you risk on the trade, and it is the “1” in every risk/reward figure below.
- Exit: the first close back below the middle band. You ride until the trend breaks its own average.
Each chart labels the trade as a risk/reward ratio, written 1:X. The 1 is your risk, the distance from entry to stop. The X is the reward, how many times that risk the trade made back. A 1:5 trade returned five times what it put on the line.
Here is a clean one on gold.
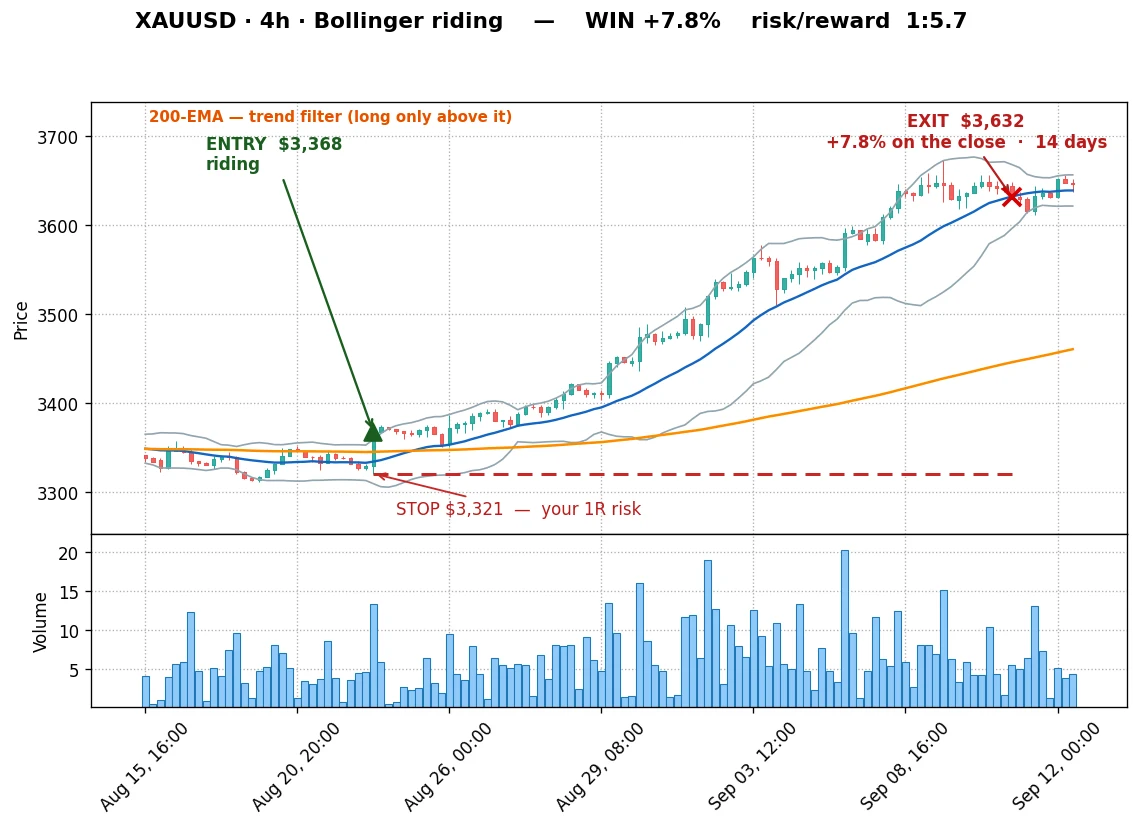
Price tagged the middle band, closed back above it, and then walked up the upper band for two weeks. The stop sat far below the whole time. That is the shape you are hunting: a small, fixed risk and an open-ended ride. The trade gave back nothing important until the close finally dropped under the average.
It is not always that dramatic. Here is a tidier one from a quieter stretch.
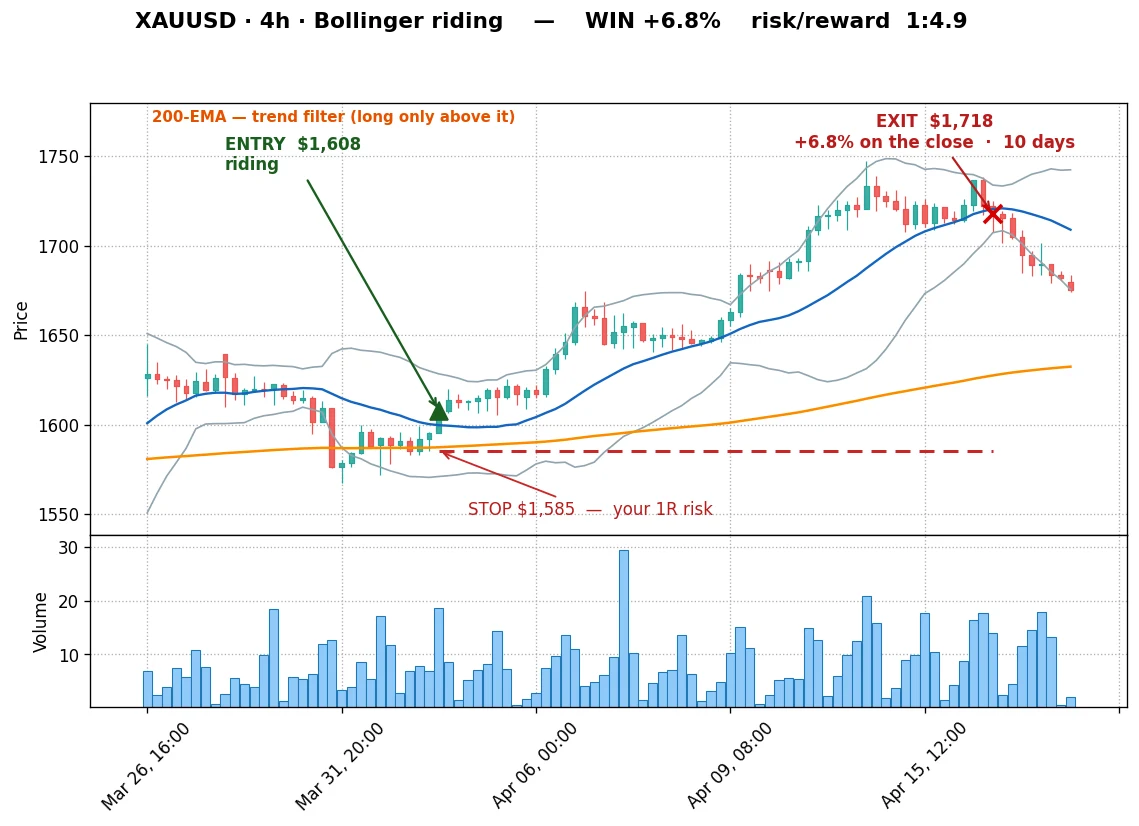
Same mechanics, smaller move. Price reclaimed the middle band in an uptrend, rode the upper band for a couple of weeks, and closed out when it lost the average. You take a lot of these and let the occasional monster like the first one carry the month.
Over the full eight years on gold’s 4-hour chart, riding the bands this way made money in both halves of the data, not just the recent rally, with the deepest dip in the account staying around 6 percent. The win rate is low, near 30 percent, which surprises people. It works because the winners run several times the size of the losers, and the losers are capped by that stop under the pullback.
That low win rate is the part you have to make peace with. Most of these trades are small losses and scratches. A handful of them pay for the year. If a four-trade losing streak is going to make you abandon the plan, this is not your setup.
Setup two: trade the squeeze breakout
When the bands pinch to their tightest in months, the market is storing energy. The squeeze breakout trades the release.
- Setup: the gap between the bands is near its narrowest of the recent range. The bands are visibly tight.
- Entry: price closes above the upper band out of that squeeze.
- Stop: the middle band at entry, again about one unit of risk.
- Exit: the first close back below the middle band.
The squeeze itself is the edge. You are not chasing every band touch, only the ones that fire out of a genuine coil.
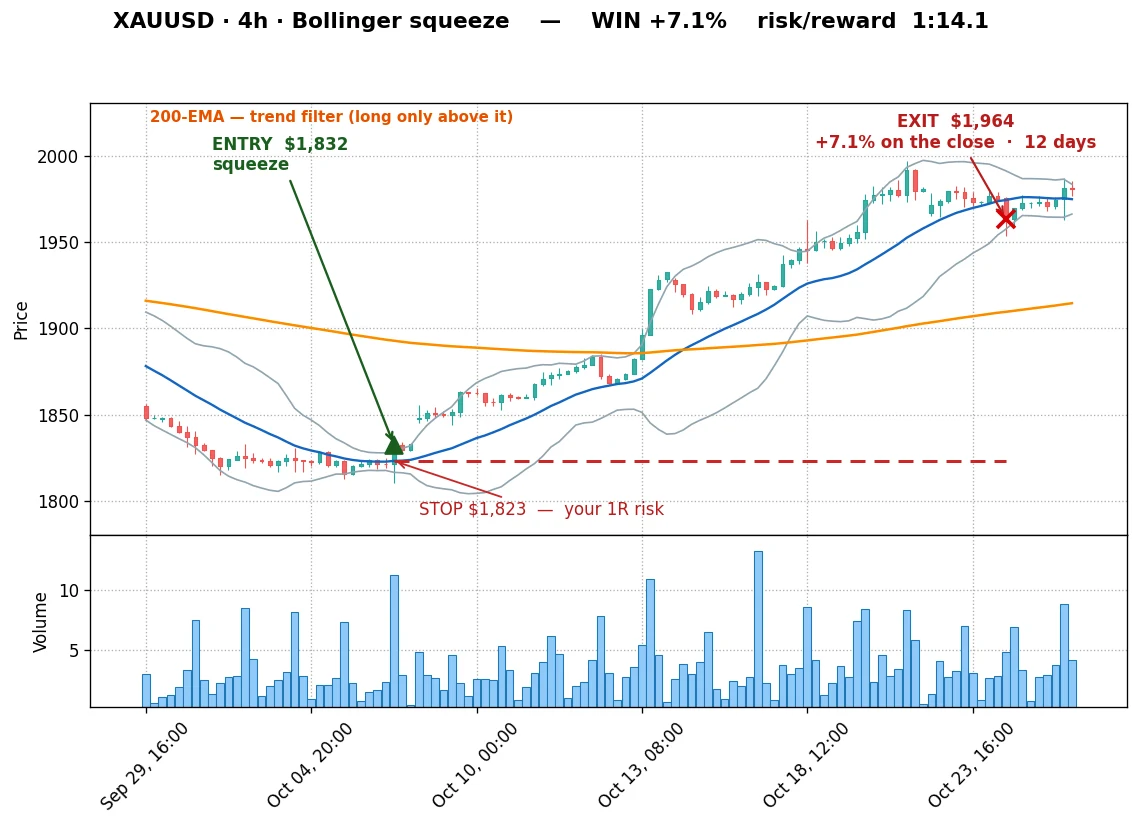
Look at the left of that chart. The bands choke down to almost nothing while price grinds sideways. Then one candle closes above the upper band and the channel blows open. The stop was tiny, pinned just under the squeeze, so a normal-sized move turned into a 1:14 trade before it finally closed back under the average.
The squeeze breakout held an edge across the eight years on gold, and it survived the older half of the data, not just the recent run. It fires less often than the band-ride, maybe a couple of times a month. But the payouts when a squeeze resolves into a real trend are the biggest in this article.
The volume panel matters here. A squeeze that breaks on a genuine surge in volume is the one you want. A break on thin, limp volume is the one that fades back into the range and stops you out. One caveat for Forex: the volume your platform shows on a pair like EUR/USD is tick volume, a count of price updates rather than real money changing hands, but it still does the job of telling a busy break from a limp one.
Setup three: the mean reversion most people get wrong
This is the setup every beginner course leads with: price drops to the lower band, you buy, expecting a snap back to the middle. It sounds clean. On a trending market it quietly bleeds you out.
- Entry: price closes below the lower band.
- Stop: just under the low of that stretch.
- Target: the middle band.
Run it on gold and it barely breaks even. In an uptrend, a tag of the lower band is often the start of a deeper flush, not a bounce. You are catching a falling knife in a market that wants to go up without you.
Where it does work is a flat, range-bound pair. EUR/USD spent these eight years going essentially nowhere, and that is exactly the habitat mean reversion needs.
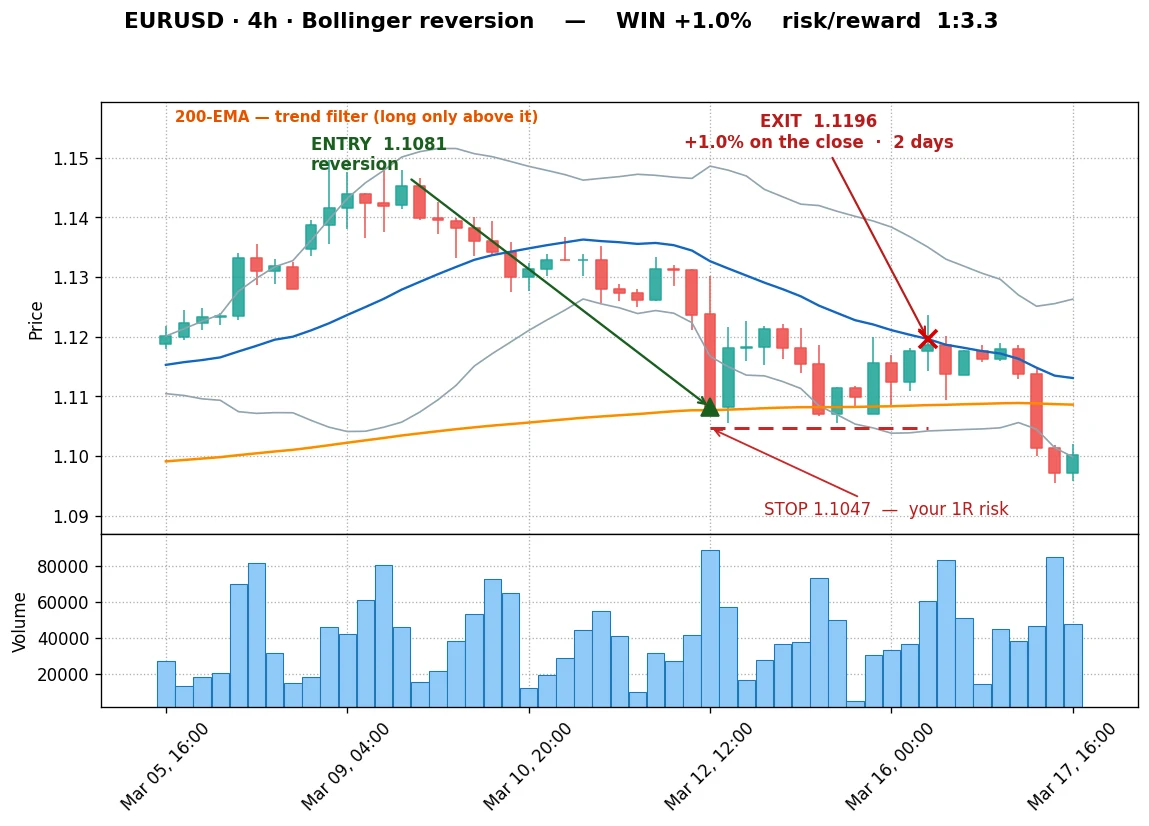
On EUR/USD’s 4-hour chart the reversion setup turned a steady profit once you filtered for the conditions where it belongs. The trades are the opposite shape of the band-ride: a high win rate, but small, quick gains back to the average. You take a lot of modest winners and the occasional clean loss when the range finally breaks.
Here is the honest headline on this one. EUR/USD held flat for eight years, so simply holding it earned you nothing. Every dollar this setup made on that pair is real edge, not a rising market carrying you. That is the cleanest proof in the whole study that the bands can do something on their own, in the right place.
The numbers, side by side
Here is the whole study on one screen. The edge column is the profit factor: a setup’s total winnings divided by its total losses. Above 1 means it made money after costs, and 1.5 means it won about a dollar and a half for every dollar it lost.
That is a whole-strategy score, and it is a different number from the 1:X risk/reward on the charts above, which only describes a single trade. A setup needs both to be worth trading: a decent risk/reward on its winners and a profit factor above 1 across all the trades together. These held in the older half of the data as well as the recent run.
One honest line on the method: these use the standard 20-period, two-deviation settings, not values tuned to fit this data, and they were read across the whole window rather than walk-forward tested. Treat the edge as real, but not laboratory-proven.
| Setup | Best on | Timeframe | Edge (profit factor) | Held out of sample? |
|---|---|---|---|---|
| Band riding | Gold, trending | 4-hour | around 1.5 to 1.6 | yes |
| Squeeze breakout | Gold, trending | 4-hour | around 1.3 | yes |
| Mean reversion | EUR/USD, ranging | 4-hour | around 1.4 | yes |
| Any of them, unfiltered | any market | 1-hour | thin to negative | no, mostly noise |
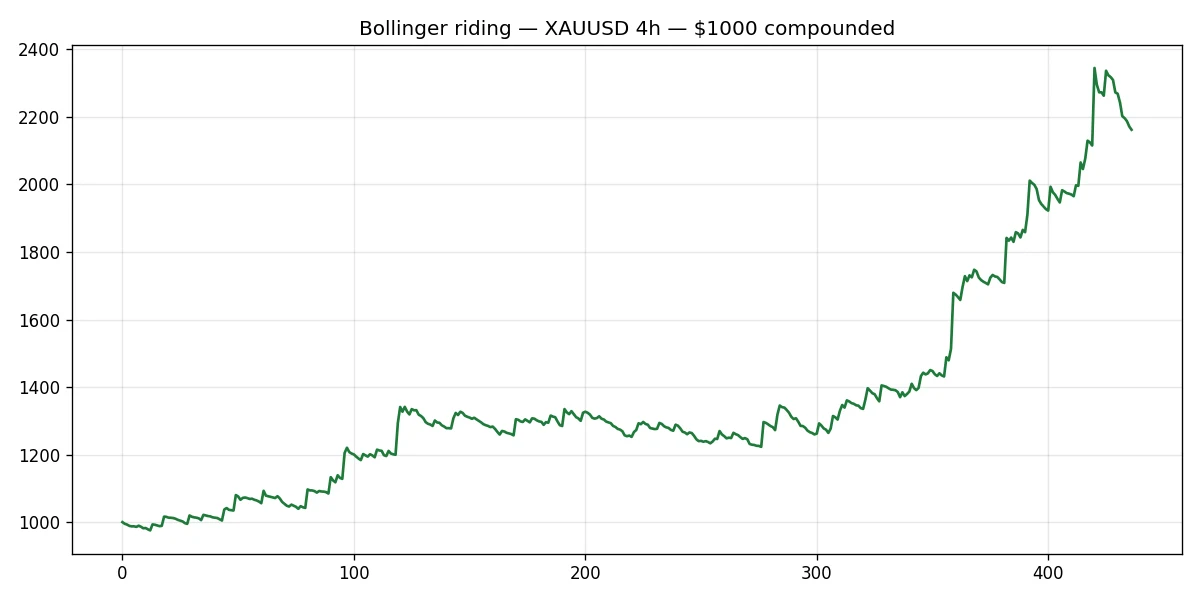
The band-ride is the workhorse. Here is what eight years of it looks like as an account curve.
And the full trade history behind that curve, not just the shape:
| Trades | 436 |
| Win rate | 27% |
| Average win / loss | +1.8% / −0.4% |
| Reward-to-risk | 1:4.5 |
| Profit factor | 1.64 |
| Max drawdown | −9% |
| First half / second half PF | 1.52 / 1.73 |
| $1,000 compounded | → $2,162 |
A 27 percent win rate that still more than doubles the account is the band-ride in one number: you lose small and often, then a few big trend-rides pay for all of it, a 1:4.5 reward-to-risk. And it held in both halves of the data, which is the test most setups quietly fail.
Which side, and what happens when the trend changes
None of this is a “buy forever” robot, and you should not treat it like one. The setups are regime tools: the right one depends on whether the market is trending or stuck in a range, and which way it is trending. The 200-EMA tells you which side to be on.
Above the 200-EMA, you trade the long versions: ride the bands up, buy the squeeze breakouts. Below it, the same logic flips. The short mirror of every setup tells the reverse story. On gold’s long bull run the shorts mostly bled, exactly as you’d expect when you fight a strong trend. But in gold’s downward corrections, when price dropped under the 200-EMA, riding the bands short on rising volume turned a profit in that down regime.
So the answer to “what happens if gold rolls over” is not that the method breaks. It rotates. You stop taking longs when price loses the 200-EMA, and the same band-ride works on the way down. A short on a Forex or metals account is just a sell order. There is no extra borrowing or margin penalty the way there is shorting a stock, so the down side is genuinely available to you.
The one thing you never do is fight the regime. Fading a strong gold rally by selling every tag of the upper band was the worst-performing idea of the lot. Do not short a market that is trending hard, and do not buy the dips in one that is falling.
The timeframe that decides everything
Here is the part that gets left out of most Bollinger articles. The timeframe is not a detail, it is the difference between an edge and a coin flip.
Drop all of this to the 1-hour chart and most of it falls apart. The bands whip around too fast, you get chopped on false band tags, and the costs eat what little edge survives. A strict volume filter can rescue some of it, the squeeze breakout in particular, but you work harder for a choppier result. The same setups on the 4-hour chart come alive: cleaner trends, fewer false signals, and the numbers above hold up.
If you take one practical rule from this piece, make it this one. Trade these setups on the 4-hour or higher. The 1-hour chart looks busier and feels more active, and that activity is mostly a tax.
What doesn’t work
The honest losers are as useful as the winners, so here they are.
The band-ride takes plenty of losing trades. Most are scratches. But a late entry, one that fires just as a trend is tiring, can reverse on you straight away.
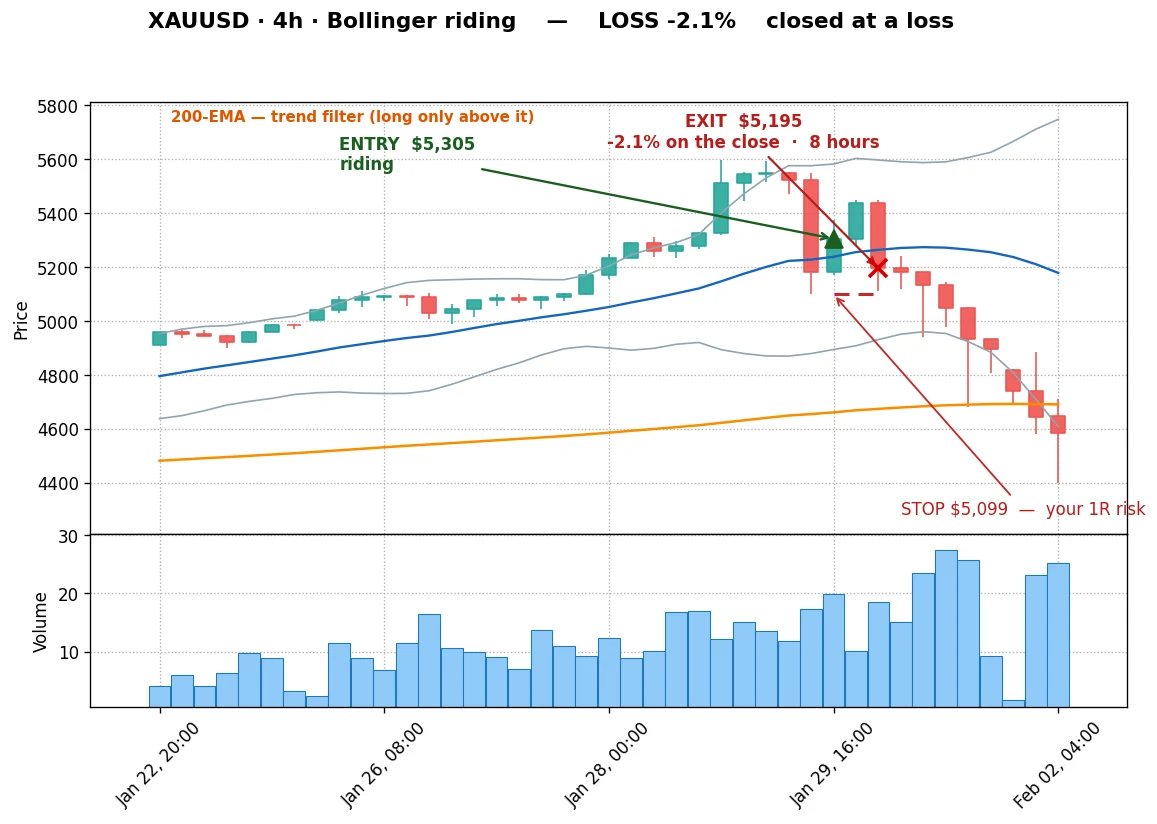
That one caught the turn. Price closed back above the middle band, the trigger fired, and then gold simply rolled over. Eight hours later it lost the average and the trade was out. No tease, no slow bleed, just a tired trend that flipped. It is the price you pay for a setup that enters on strength.
Mean reversion in a trend is the bigger trap. Buying the lower band because price “looks oversold” is how beginners hand their accounts to the trend. The band is not a floor.
Counter-trend trades in general are where this method dies. Every short taken into gold’s uptrend, and every dip bought on the way down, lost. The bands do not override the direction of the market, they help you trade inside it.
One honest line on just holding
You came here to trade, so I will keep this short. Over these eight years gold itself nearly tripled. If you had simply bought and held it, your total return would have beaten any of these setups, because that is what a roaring bull market does to a long-only number.
What the strategy buys you is different. It rode that move with roughly a quarter of the drawdown, it kept working on EUR/USD where holding earned nothing at all, and it can switch to the short side when the trend turns. That is the trade-off: less raw upside in a once-in-a-decade bull, far less pain, and a method that still functions when the easy money stops. Holding a hyped asset at the top is not a strategy. Knowing how to trade it in any regime is.
How to actually trade it
Pick one setup and one market to start. Gold on the 4-hour chart with the band-ride is the most forgiving.
Size the trade off the stop, not the account. If your stop sits about one percent of price away, and you decide to risk half a percent of a $2,000 account, that is roughly $10 on the line. The position is then whatever size makes the stop cost that $10. The low win rate only works if every loss is that controlled. One oversized trade undoes a month of discipline.
You need a charting platform that draws Bollinger Bands and the 200-EMA, which is every serious one, and a broker that gives you clean execution on gold and major Forex. I keep the metal and the indicators on one MT5 screen so the bands, the average, and the volume read are all in front of me. Whatever you use, that is the requirement.
Then wait. The hardest part of all three setups is sitting out the 1-hour noise and the counter-trend temptations, and only taking the trades that fit the regime.
Your decision: which setup, and when
You do not trade all three at once. Read the market first, then pick the one that fits. The whole decision is four lines.
- Trending market, price above the 200-EMA? Ride the bands. Buy the pullback to the middle band, hold while price walks the upper band, exit on a close back below the middle. This is your bread and butter, and gold has been the cleanest market for it. If gold is new to you, start with how to trade gold.
- Bands choking into a tight squeeze in that uptrend? Take the squeeze breakout instead, on the close above the upper band. Rarer, but the payouts are the biggest.
- Market going nowhere, stuck in a range like EUR/USD? Switch to mean reversion. Buy the stretch below the lower band and target the middle. Never do this in a trend.
- Price below the 200-EMA? Flip to the short side, or stand aside until the trend is clear. Do not fight the direction.
If you are brand new and want one thing to do, this is it: gold on the 4-hour chart, the band-ride, long only above the 200-EMA, risking half a percent of your account per trade. Get that one setup right before you touch the others.
Where to go from here
The band-ride and the squeeze are trend tools, and they sit alongside other tested setups worth knowing. The Darvas Box strategy uses the identical volume filter that separates the real moves from the noise here. If you like trading channels, the Donchian channel does a similar job with a cleaner level to break, and for a momentum read to pair with the bands, start with the RSI indicator.
Whatever you trade, the rules that carried this whole study are the same: the 4-hour chart or higher, the 200-EMA to pick your side, and a small fixed risk on every trade. That is the method.
FAQ
What are Bollinger Bands, in plain terms?
Do Bollinger Bands actually work?
What is a Bollinger Band squeeze?
What is the best timeframe for Bollinger Bands?
What settings should I use?
Should I buy when price hits the lower band?
What does the 200-EMA have to do with Bollinger Bands?
Can I use this on crypto or stocks, not just gold and Forex?
How much money do I need to start?
What do the key terms mean?
Real-time trade setups with entry, stop loss and take profit. Daily market analysis. No subscription, no complicated theory.
🌍 Our recommended brokers


Reader Reviews
Be the first to review this — tell other traders what actually helped, or where it fell short.
Leave a Review

Forex Analyst & Senior Trader
Former FX desk trader with 8 years in institutional forex. Works in multi-timeframe analysis and order flow, turning desk experience into systematic, testable rules across forex and metals.
