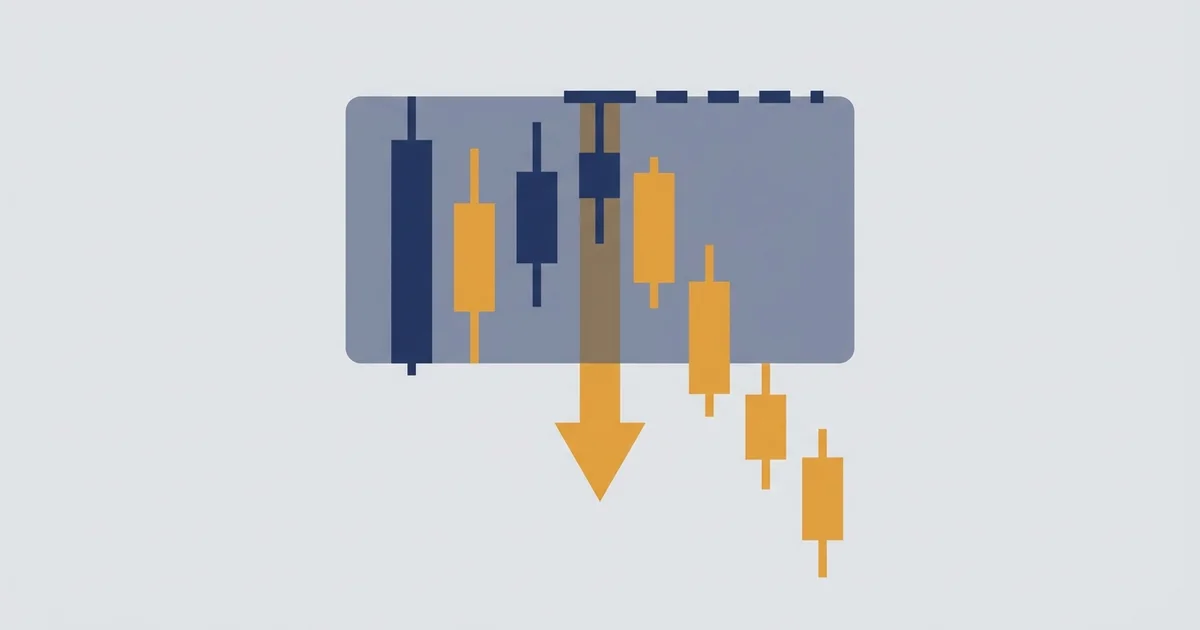

What an opening range breakout looks like
Picture the first hour of a trading session. Price is finding its feet, printing a high and a low.
Freeze those two levels and you have the opening range, a box that marks where the session started fighting.
The opening range breakout waits for one event. Price closes outside that box, above the top or below the bottom, and that close is your entry in the direction of the break.
Here is the whole idea on one chart.
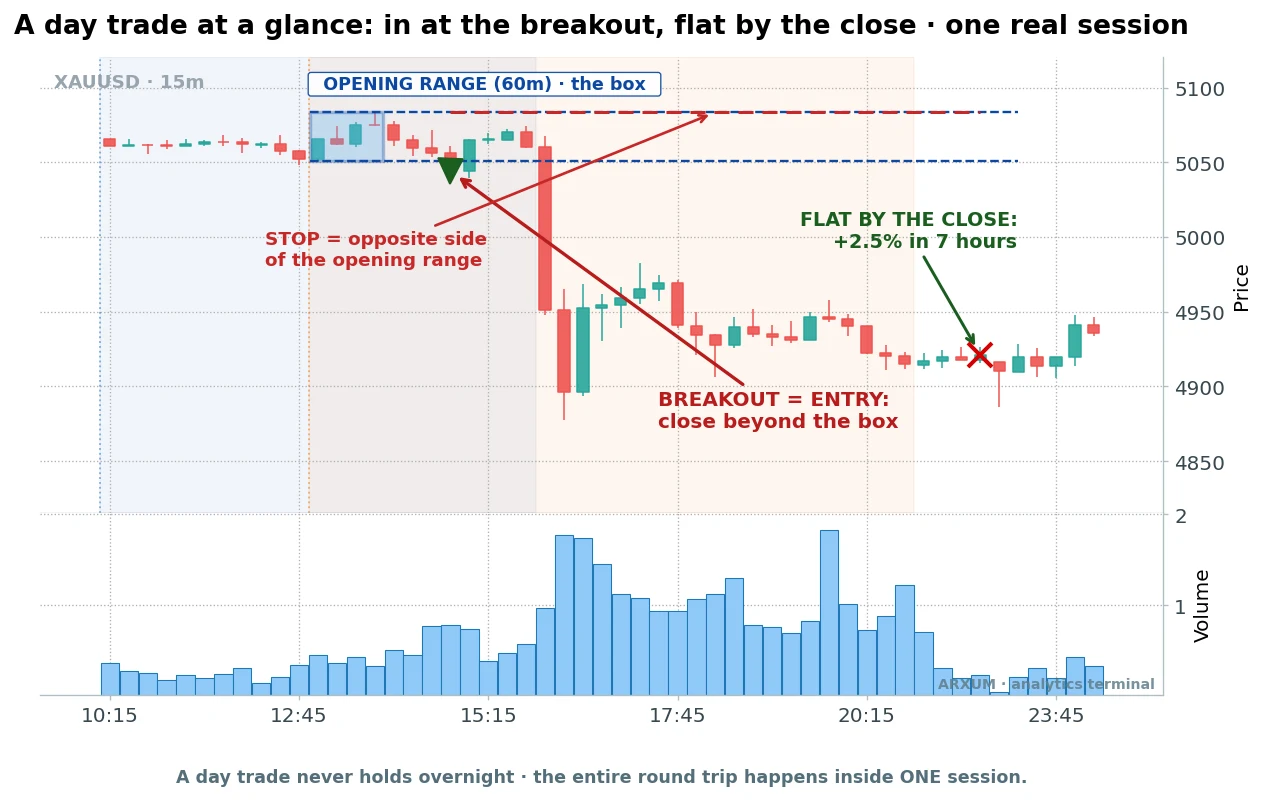
The shaded box is the opening range, the high and low of the session’s first 60 minutes. Price closed under the floor, so the trade is a sell.
The stop goes on the far side of the box, and the position is closed out at the session’s end, win or lose.
That is the entire skeleton. It is clean, mechanical, and one of the oldest day-trading setups going.
The interesting question is whether it still pays, so I put it through a proper backtest.
Where the setup comes from
Opening range breakouts go back to the pit era. Toby Crabel wrote the setup up in the late 1980s, and floor traders had been trading the first-hour range long before that.
The logic is timeless. The open is when the previous night’s news, orders and gaps all collide, so the first session range often frames the day’s battle line.
Break above it and buyers have taken control. Break below and sellers have.
Seventy years of markets later, the same box still draws itself on a 15-minute chart. What is new is that I can measure whether the break actually pays, instead of trusting pit-era folklore.
What the opening range breakout actually is
An opening range is just a session’s first high and low, frozen into a box.
- The range: the highest high and lowest low of the session’s opening window (we use the first 60 minutes on gold and EUR/USD).
- The breakout: the first candle that closes fully outside that box, up or down.
- The direction: you trade the way the break points, long above the box, short below it.
That box is really short-term support and resistance, drawn at the one time of day when fresh money hits the market. While price sits inside it, neither side has won, and the first clean close outside is the tell.
To mark one yourself, note the session open, wait for the first hour to finish, then draw a line across the highest high and another across the lowest low of that hour. That rectangle is your range, and now you wait for a close outside it.
The rules, step by step
I coded it strictly, because a setup you can argue with after the fact is a horoscope, not a strategy.
- Opening window: the session’s first 60 minutes on gold and EUR/USD, the first 15 minutes on Bitcoin (it moves fast enough to frame a range quicker).
- The box: the high and low of that window.
- Entry: the first candle that closes outside the box, in the break direction.
- Stop: the opposite side of the box. The distance from your entry to that side is your risk, the “1” in every risk/reward figure here. Written as a ratio, 1:X, the 1 is what you put at stake and the X is what a winner makes back.
- Exit: either the far target (twice your risk), a tighter volatility stop, or the forced session close. You never hold overnight.
- Session anchor: the London open (around 07:00 UTC) or the New York open (around 13:00 UTC) for gold and EUR/USD. Bitcoin trades 24/7 with no real session, so I use the UTC calendar day as its “trading day” and say so plainly.
That is the classic setup. Now the part the hype videos skip.
The raw result: an honest letdown
Here is what those rules produced with no filter, taking every opening range breakout across two years on gold’s 15-minute chart, anchored to the New York open.
| Trades | 277 |
| Win rate | 41.2% |
| Reward-to-risk | 1:1.4 |
| Profit factor | 0.98 |
| Net return on $1,000 | -$13 |
Two definitions, since they carry the rest of this piece. Profit factor is total winnings divided by total losses, so anything above 1.0 makes money and below 1.0 loses it.
Reward-to-risk, written 1:X, is per trade: the 1 is your entry-to-stop risk, the X is how many times that the winner made back.
A profit factor of 0.98 means the raw setup is a slow bleed. Gold is the strongest of the three markets and it still could not clear breakeven on the plain box.
The other two were no better. Across the whole sweep the best raw profit factor was 0.98 on gold, 0.96 on EUR/USD, and 0.90 on Bitcoin.
Every plain opening range breakout, on every market I tested, sat at or below breakeven.
Why so weak? With no filter you take every break, including the dozens of limp ones that nudge past the line on no participation and roll straight back inside.
I needed a way to tell a breakout that means it from one that is just stretching its legs.
The fix: volume, but against the trend
I swept eleven different confirmations across the same trades, one at a time, to see which one actually separated the winners from the noise. Not the usual volume-plus-moving-average-plus-oscillator trio, but a wide menu: volume, trend alignment, ADX trend strength, ATR expansion and contraction, RSI and stochastic direction, momentum, a higher-timeframe filter.
One combination stood out, and it was not the obvious one.
The rule: take the breakout only when volume is at least 1.5 times its 20-bar average, AND the break runs counter to the immediate 200-EMA trend.
The 200-EMA is a long moving average, the average closing price over the last 200 bars, and it reads as a rough line for “which way the market has been leaning.” A break that fires against that lean, on heavy volume, is usually the market snapping back from an exhausted move, not chasing one that is already stretched.
Here is what that one filter did to the gold setup.
| Filter | Trades | Profit factor | Return |
| Solo (no filter) | 277 | 0.98 | -1.3% |
| Volume 1.5x | 144 | 1.18 | +5.7% |
| Volume, trend-with | 51 | 0.70 | -3.8% |
| Volume, counter-trend | 93 | 1.51 | +9.6% |
| ADX 22+ (real trend) | 157 | 1.07 | +2.5% |
| Calm market (ADX under 18) | 58 | 0.88 | -1.6% |
Read down the profit-factor column and the story is clear. Plain volume helps a little, and volume in the direction of the trend actively hurts, dropping the profit factor to 0.70.
Volume against the trend nearly doubles the raw edge, to a 1.51 profit factor.
That last row is the finding. It is not “any volume filter helps,” and it is definitely not the default indicator soup, but a specific thing: a loud break that fights the prevailing lean.
The key finding deserves its own picture, because the whole article turns on it.
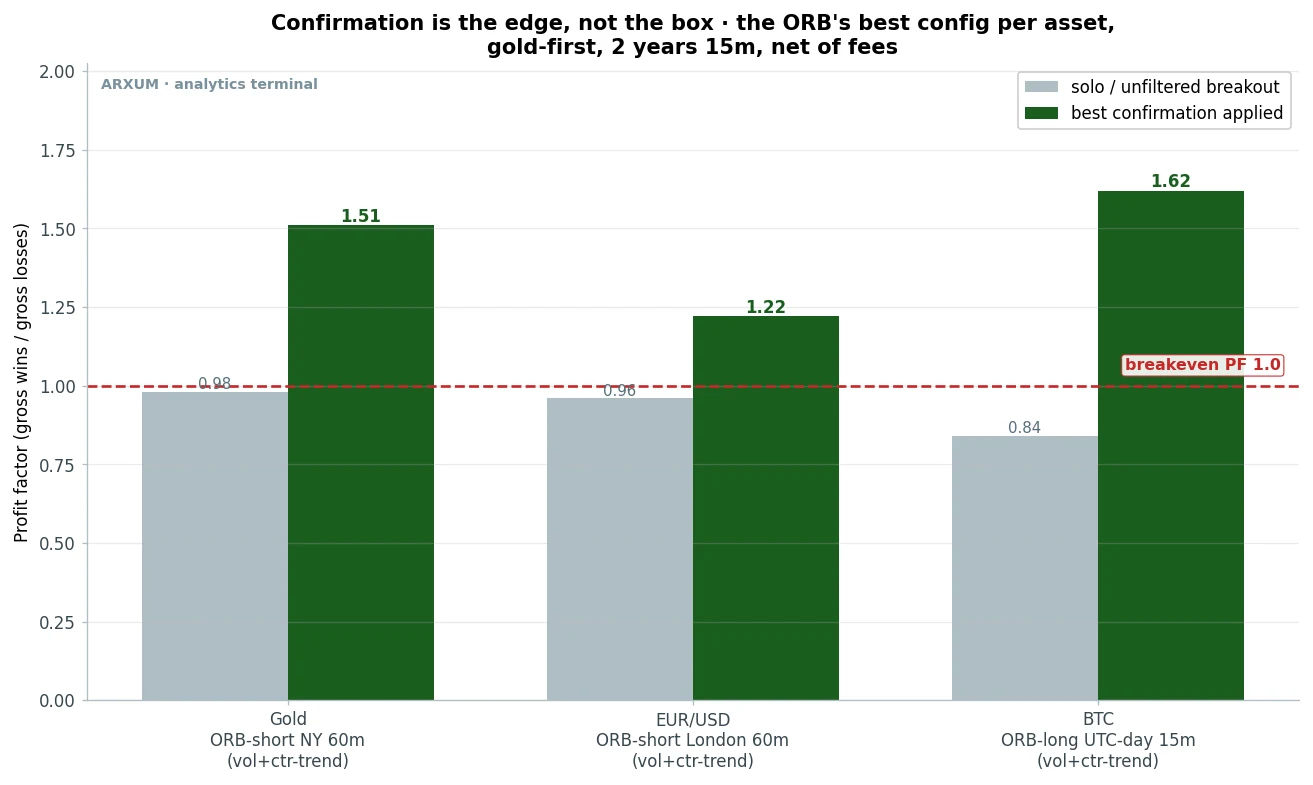
Same box, same entries, same stops on every market. The only change is skipping the breaks that do not come on loud, counter-trend volume.
On all three the plain setup is a loser and the confirmed one clears breakeven.
How to read the filter on a live chart
A rule is only useful if you can see it in real time, so here is what each half looks like on a chart.
- Volume 1.5x: add a volume moving average set to 20 (most tools have it built in). The breakout bar’s volume needs to poke clearly above that average line, half again as tall or more.
- Counter-trend: add the 200-EMA. If price has been sitting above it (an up-lean) and the box breaks down, that is a counter-trend short. If price has been below it and the box breaks up, that is a counter-trend long.
That is the whole check. A loud bar, breaking the box against the direction the 200-EMA has been pointing.
A gold trade, start to finish
Gold (XAU/USD) is the lead market here, the steadiest of the three, so let me walk one all the way through.
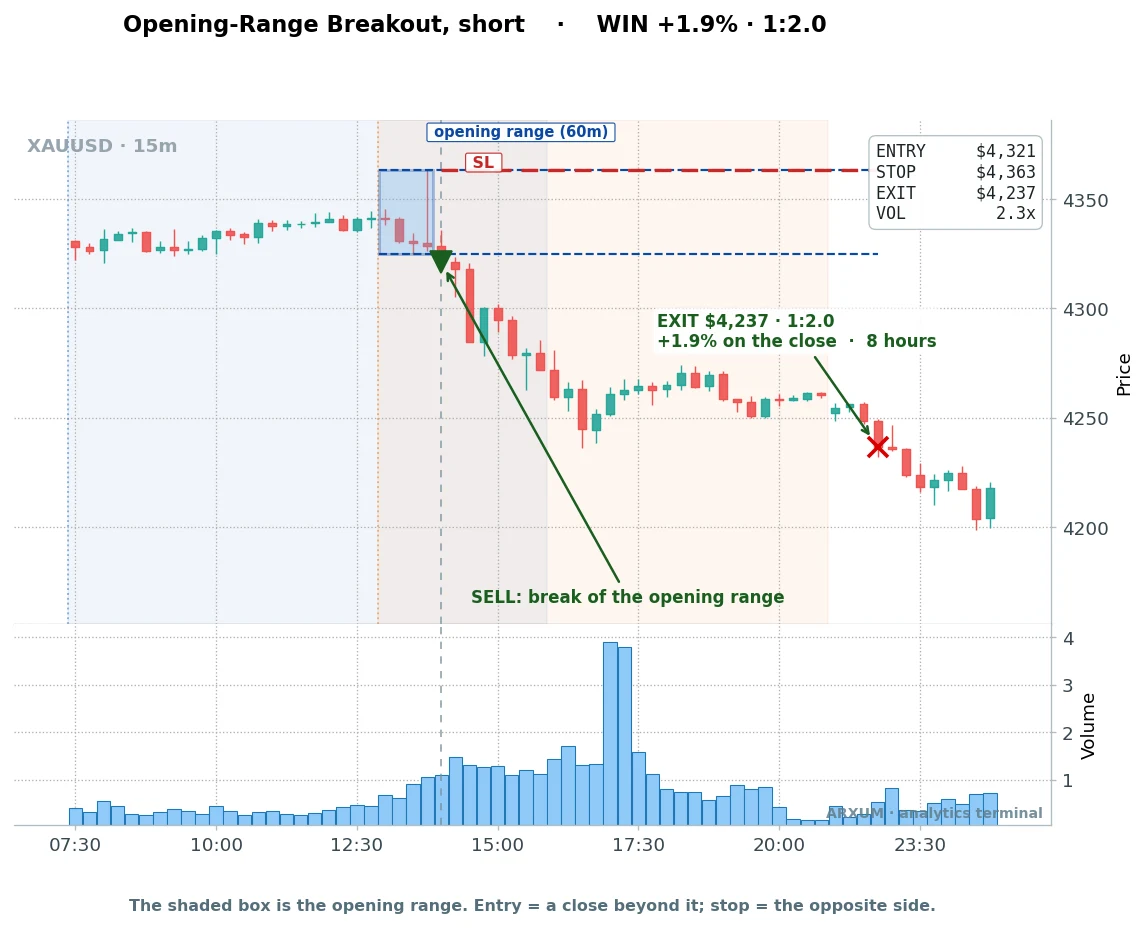
The New York session opened and gold printed its first-hour box. Price had been leaning up, above its 200-EMA, so a break down would be the counter-trend short I want.
- Entry: $4,321.06, on the close below the box floor.
- The tell: volume 2.3 times its average, a loud bar, not a drift.
- Stop: the top of the box, your 1, the risk.
From there the short ran through the session. It reached the twice-your-risk target at $4,236.74, a 1:2 winner of +1.95%, closed out well before the session end.
A clean example of the box catching a snap-back the moment the loud volume confirmed it.
When it fails, and why I am showing you
I am not here to show only the pretty ones. Here is a gold break that passed the filter and still lost.
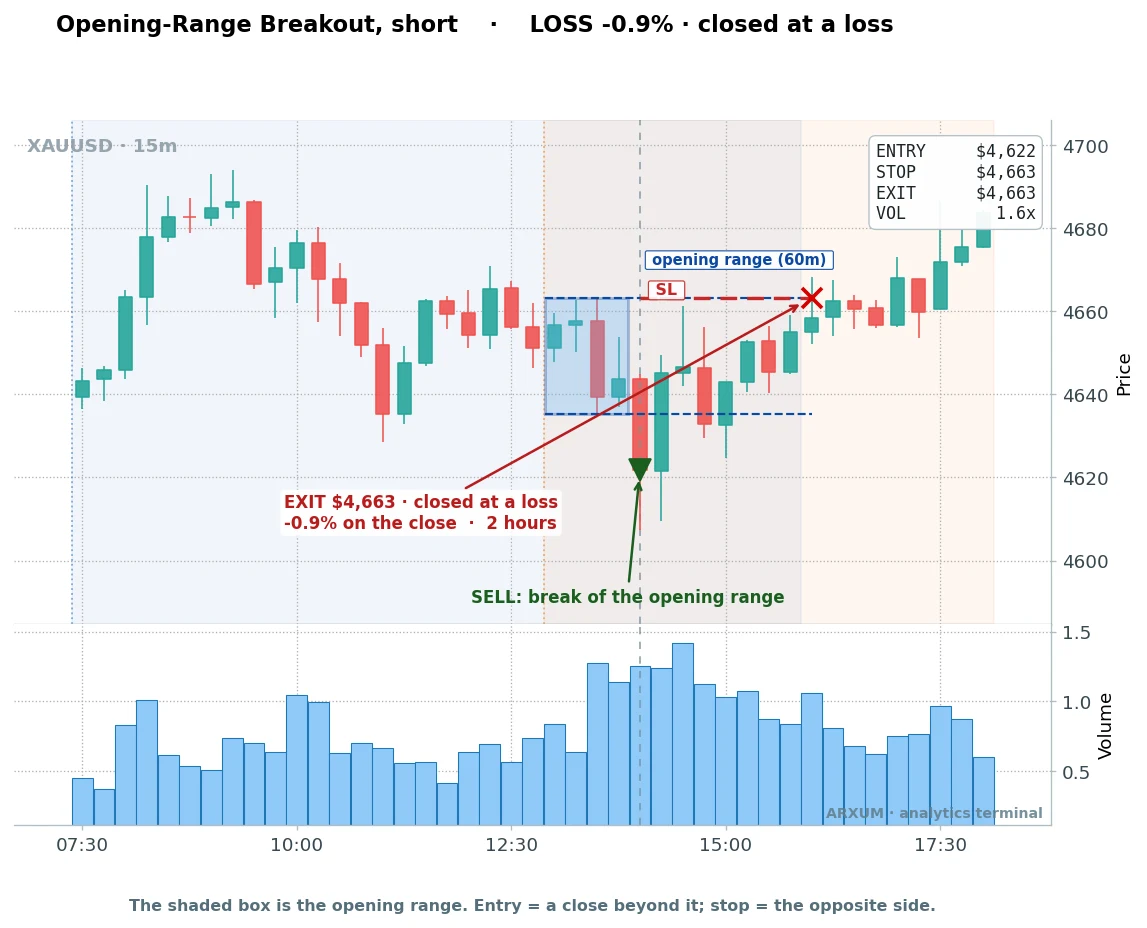
This break even had 1.6 times volume, so it cleared the filter cleanly. Price closed below the box, the short went on, then it turned, climbed back through the range, and clipped the stop about two hours later for a full loss of -0.93%.
Here is the honest part. A filter improves your odds, it does not hand you certainty.
The gold setup wins 48% of the time, so you lose slightly more than half your trades. The math works because the shape of the outcomes is lopsided.
- Losers stay capped near the 1 you risked, held there by the box stop.
- Winners run to the twice-your-risk target, or ride the session to a bigger gain.
You are not trying to be right every time. You are trying to be small when you are wrong and let the good ones pay for the bad, and that asymmetry is the whole point.
Does gold actually hold up over time
Two example trades are anecdotes. The proof is the full trade history, so here is the gold setup compounded on a $1,000 account across every one of its trades.
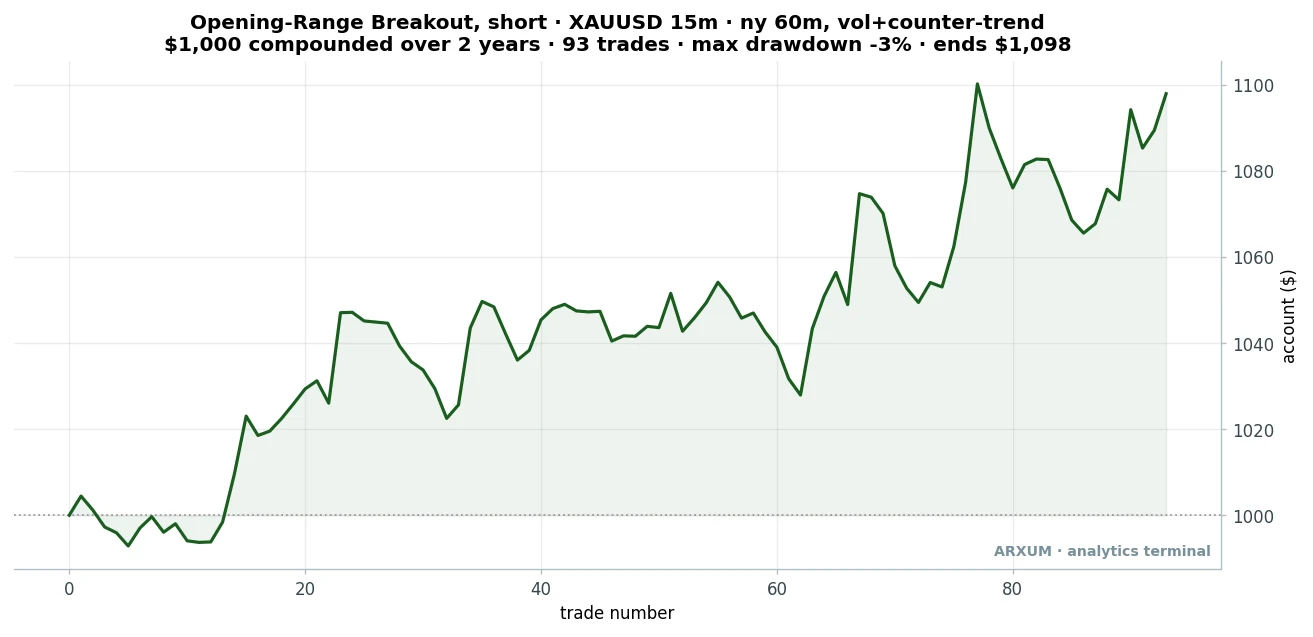
This is what the gold setup did over the full two-year window. Note the shape: not a smooth ramp, but a jagged climb, small losers all the way up with the occasional bigger winner nudging it higher.
The worst peak-to-trough dip, the drawdown, was only about 3%. That is a tame ride, which matters as much as the return: a shallow drawdown is what lets you actually sit through the losing runs without bailing.
| Trades | 93 |
| Win rate | 48.4% |
| Reward-to-risk | 1:1.6 |
| Profit factor | 1.51 |
| Net return on $1,000 | +$98 |
Does it survive out-of-sample
An edge that only exists in the data it was tuned on is worthless. So I split gold’s two years in half: built the read on the first year, then checked it on the second year it had never seen.
| Window | Trades | Profit factor |
| First year (tuned on) | 41 | 1.72 |
| Second year (never seen) | 52 | 1.39 |
The edge held. It softened a bit, from 1.72 to 1.39, but it stayed clearly profitable on data it was never fit to.
That is the difference between a real pattern and a lucky curve-fit, and it is why gold is the setup I trust most of the three.
Does the edge travel beyond gold
One market proves nothing. So I ran the exact same idea, an opening range box plus the loud counter-trend filter, on EUR/USD and on Bitcoin.
The euro’s story is honest, and it comes with a warning I will not bury.
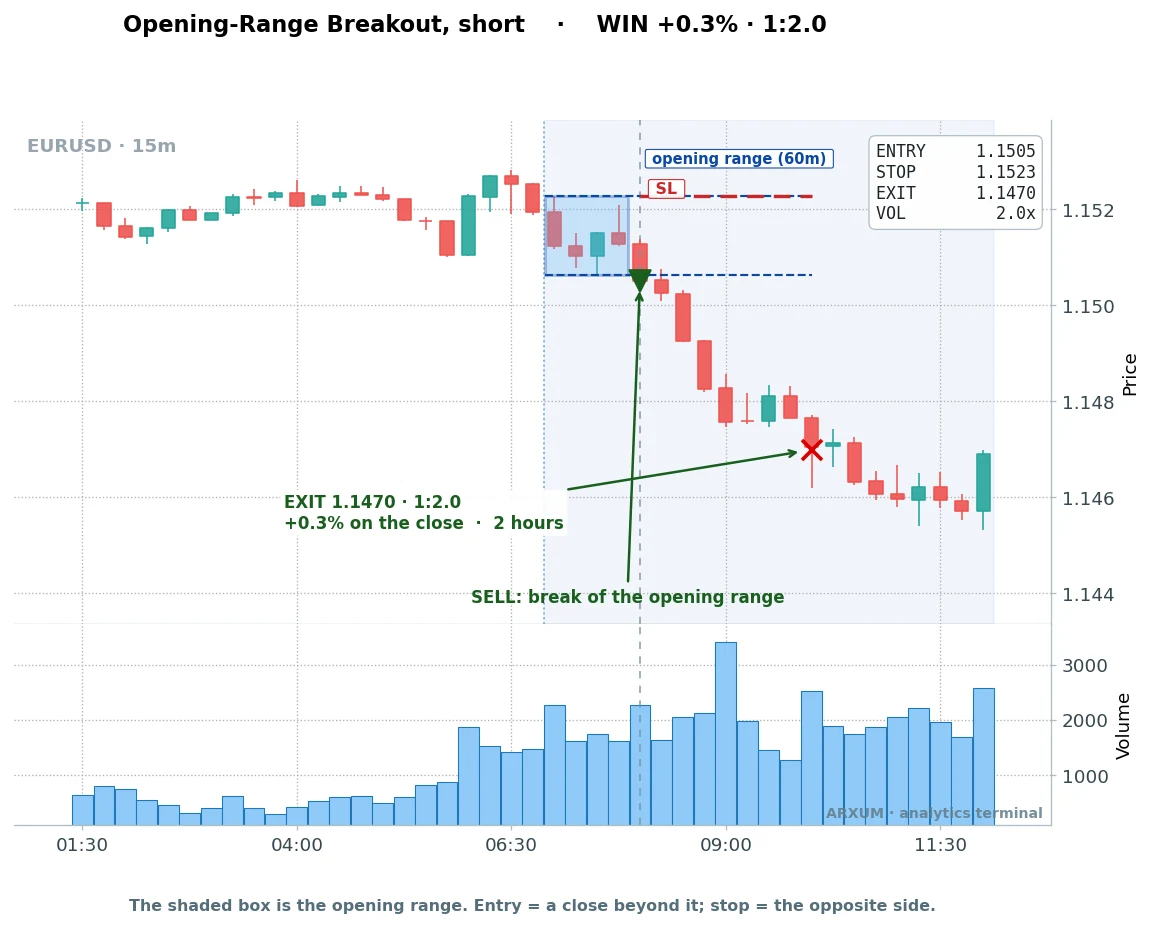
Take EUR/USD on a recent London session. Price broke below its opening box on volume twice the average, and ran to the twice-your-risk target at 1.1470, a 1:2 winner.
That is a move of about 35 pips, the unit currency traders count in, the same shape gold produces at a calmer scale.
And here is one that failed, because the euro throws plenty of those.
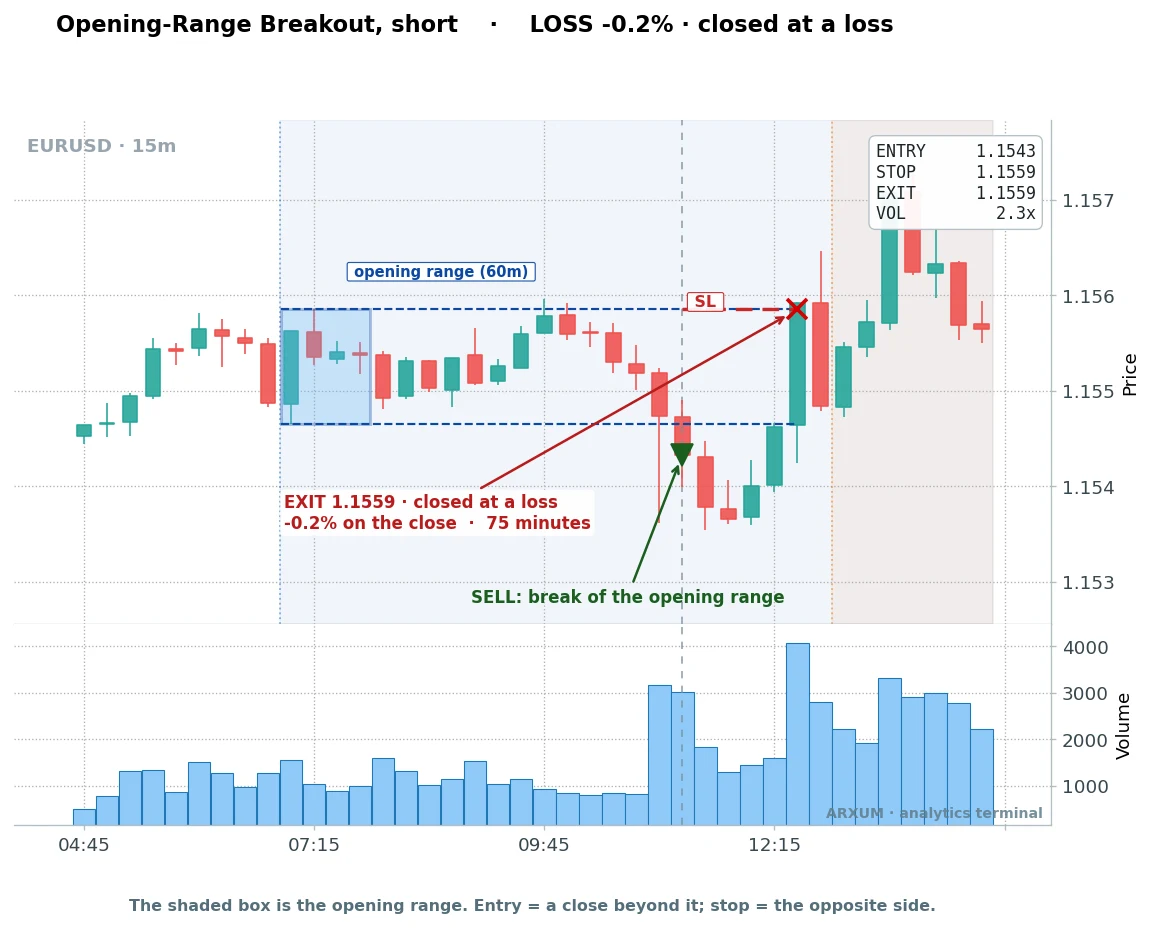
Same setup, a qualifying loud break that simply refused to follow through, stopped for a small loss inside 75 minutes. Now the record and the warning.
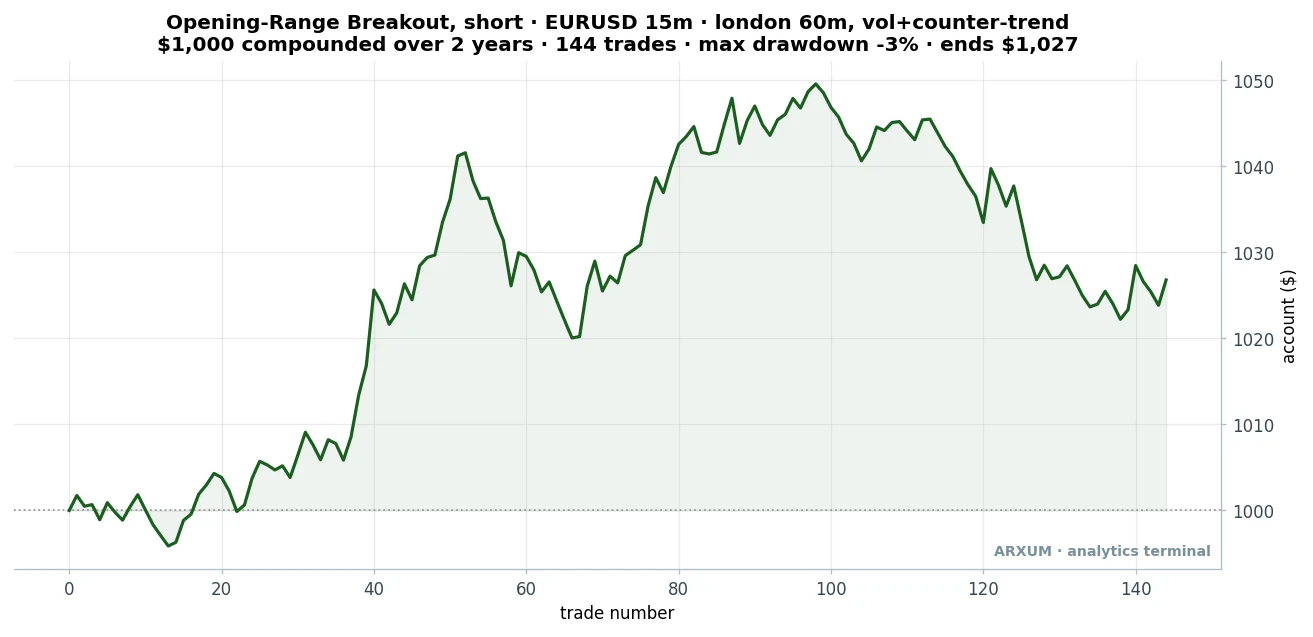
| Trades | 144 |
| Win rate | 50.7% |
| Reward-to-risk | 1:1.0 |
| Profit factor | 1.22 |
| Net return on $1,000 | +$27 |
Here is the caveat, stated plainly. The euro setup made a real edge in the first year of the window, a 1.59 profit factor, then faded in the second year to 0.87, below breakeven.
Of the three markets, EUR/USD is the one that did not survive out-of-sample.
I am not going to dress that up. The euro showed a genuine historical edge on this setup, but the evidence that it persists is weak.
Treat it as “worked historically, currently unproven,” not a market to lean on the way you can lean on gold.
Bitcoin: the surprise of the sweep
Now for the odd one. Bitcoin trades 24/7 with no real session, and its two-year window here was brutal, a market that fell over the period.
On paper it should be the worst fit for a session-based setup.
It was the strongest by profit factor.
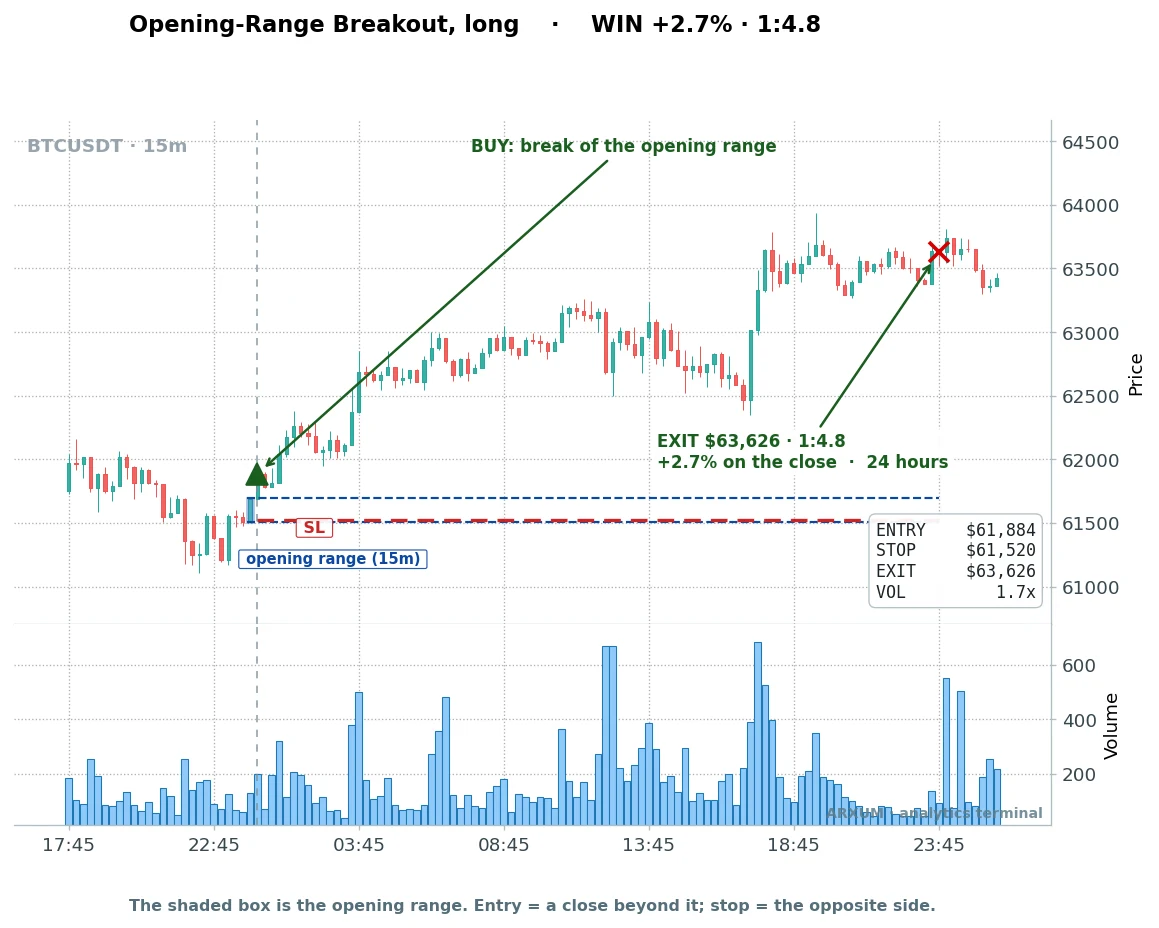
Bitcoin uses a shorter 15-minute opening window (it frames a range fast) and a tighter volatility stop instead of the box stop, because a wide, low-liquidity crypto range would blow through a box stop and hand you an oversized loss.
- Entry: $61,884, on the close above the box, volume 1.7x average, counter-trend.
- Stop: 1.5 times the recent ATR, a volatility-scaled distance that keeps losers small.
- Exit: the forced day close, here after about a day, for +2.71% at 1:4.8.
That reward-to-risk, 1:4.8, is the key to Bitcoin. And here is the loss that makes it honest.
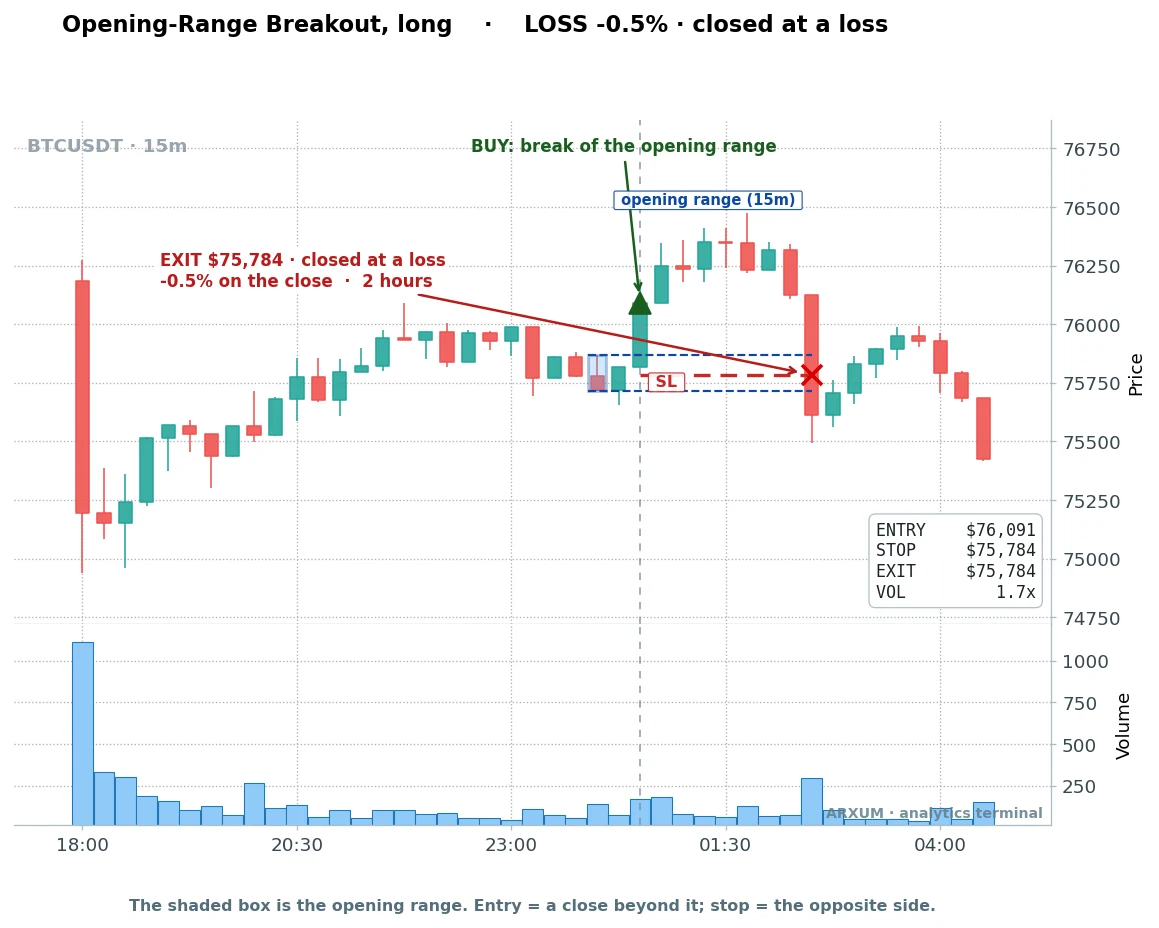
The tight stop did its job, capping the loss at half a percent. That is the whole trick on Bitcoin: it wins only about a quarter of the time, but the tight stop keeps losers tiny while the winners run four or five times the risk.
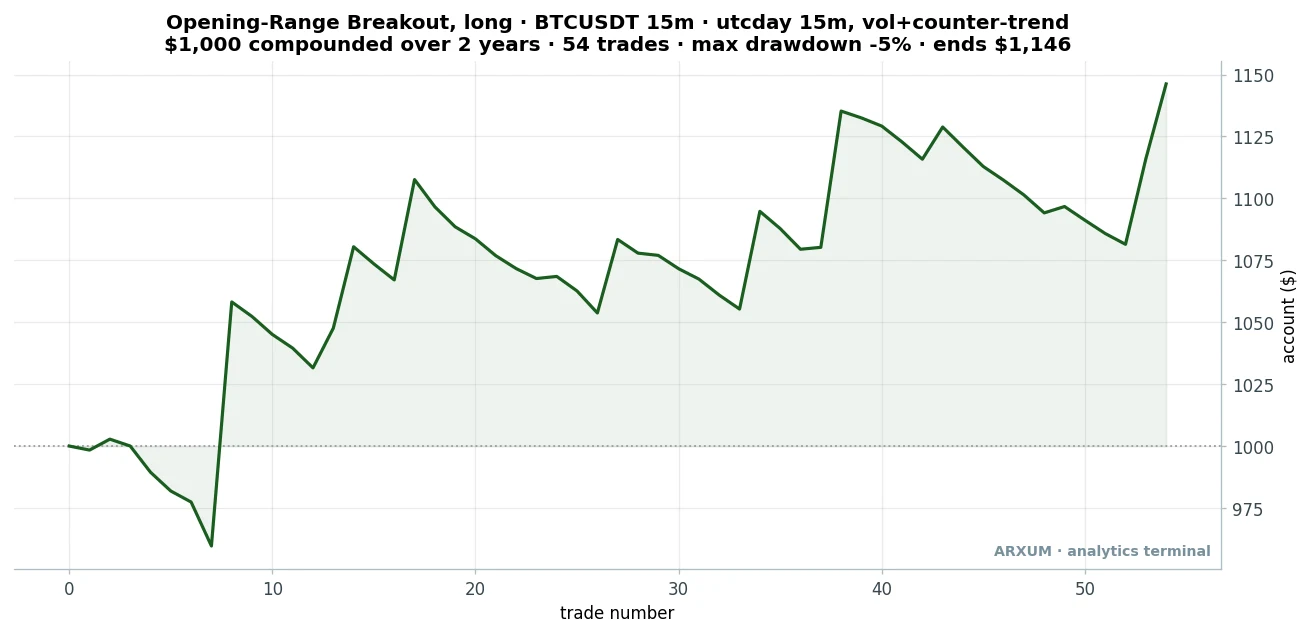
| Trades | 54 |
| Win rate | 25.9% |
| Reward-to-risk | 1:4.6 |
| Profit factor | 1.62 |
| Net return on $1,000 | +$146 |
Do not judge this one by its win rate. A 26% win rate looks awful until you see the reward: an average winner around five times the average loser.
And unlike the euro, Bitcoin’s edge got stronger out-of-sample, a 1.54 profit factor in the first year rising to 1.72 in the second.
That is the honest surprise of this whole sweep. A no-session, 24/7, falling-market asset gave the best-surviving opening range breakout of the three, purely because the tight volatility stop suits its wild ranges.
How the three markets compare
Here is the whole test on one line each.
| Market | Trades | Profit factor | Out-of-sample |
| Gold (lead) | 93 | 1.51 | Holds (1.39) |
| EUR/USD | 144 | 1.22 | Faded (0.87) |
| Bitcoin | 54 | 1.62 | Stronger (1.72) |
Read the last column, not the headline profit factor. Gold and Bitcoin both survive fresh data, so they are the two I would actually trade, while the euro is a historical edge with weak evidence it lasts.
What this looks like in practice
Percentages stay abstract, so picture the shape of a real run with the gold setup.
- Roughly 52 trades in 100 lose, each costing about the 1 you risked.
- The other 48 win, most reaching the twice-your-risk target.
- The wins are just enough bigger than the losses that $1,000 grows to about $1,098 over the two years.
This is not a strategy that prints steady gains. It grinds, small losses interrupted by wins that are a bit larger, and it only pulls ahead over a long run of trades.
If a losing streak of four or five will rattle you, this is not your setup.
Common mistakes
- Trading every breakout. Without the volume-plus-counter-trend filter you are back at a 0.98 profit factor, a slow bleed. The filter is the edge, not the box.
- Using trend-following volume. A loud break with the trend actually lost money on gold, dropping to a 0.70 profit factor. The direction of the volume matters as much as the volume itself.
- Holding overnight. This is a day trade. The whole edge assumes you flatten by the session close, so a held position is a different, untested bet.
- A box stop on Bitcoin. Crypto’s wide ranges will blow through a box stop. Use the tighter volatility stop there, which is what kept its losers small.
- Judging Bitcoin by win rate. A 26% win rate is fine when your winners are five times your losers. Look at the profit factor, not the hit rate.
Honest scope: read this before you trade it
Every number here comes from one two-year window. Here is exactly what it covers.
- Markets: gold and EUR/USD (Dukascopy, on tick volume) and Bitcoin (Binance, real volume), all on the 15-minute chart. Tick volume on gold and the euro is a proxy, a count of price updates rather than true dollars traded, though it still separated loud breaks from quiet ones.
- Period: a two-year window, one market cycle. A single window can flatter anything, which is exactly why I split each market in half and reported the out-of-sample result.
- Direction: gold and EUR/USD short, Bitcoin long, because that is the side the counter-trend filter picked in each market over this window.
- Not tested: silver, oil, GBP/USD, and a longer multi-year window are still open ground. The euro’s fade in particular could be a genuinely dead edge or one unusually good year, and a longer test would tell them apart.
- This is research, not advice. Past results are not future ones.
How to trade it, step by step
Say you have a $500 account and want to trade the gold setup. Here is the whole thing, including the sizing math and the exact order.
-
Mark the opening range. On a 15-minute gold chart, wait for the first 60 minutes of the New York session (around 13:00 UTC) to finish, then draw a line across that hour’s high and its low. Free charting like TradingView shows the session clock; on MT4 or MT5 you drop a horizontal line at each level.
-
Check the two conditions. Add a 20-period volume moving average and a 200-EMA. On TradingView, type the ticker, hit the Indicators button, and add both. On MT4 or MT5 it is Insert, then Indicators, then Volumes and Moving Average. You want a break whose bar volume clears 1.5 times the average AND runs against the 200-EMA lean.
-
Place the order. Use a sell-stop (for a short) a touch below the box floor, or a buy-stop above the ceiling for a long. Set the stop-loss field to the opposite side of the box. Set the take-profit field to twice that distance from your entry.
-
Size it from the account down. Risk 2% of $500, so $10 on the trade. Say the box is $8 tall on gold, that is your entry-to-stop distance. Gold’s smallest tradeable size, a micro-lot, is one ounce, where each $1 move is $1. So $10 risk divided by $8 per ounce is about 1.2 ounces, which rounds to one micro-lot. On a $500 account gold sizes right at the micro-lot floor, so you are placing the smallest position your broker allows and no smaller.
- Manage it and walk away. The trade either hits its target, hits its stop, or gets closed at the session end. You do not touch it in between, and you never carry it overnight.
If gold sizes too tight for your account, EUR/USD is the more forgiving fill: a 35-pip stop on a micro-lot risks about $3.50, so a 2% budget on $500 leaves plenty of room. Just remember the euro is the weaker edge of the three.
A few ready-to-use configurations from the test, if you want alternatives:
- Gold, NY session, 60-min box, short, box stop, twice-risk target, loud counter-trend volume. The steadiest of the three.
- Bitcoin, UTC day, 15-min box, long, 1.5x-ATR stop, ride to the day close, loud counter-trend volume. Best profit factor, tight-stop discipline required.
- EUR/USD, London session, 60-min box, short, box stop, twice-risk target. The historical edge, weakest evidence it lasts.
One light word on discipline, tied to these numbers. Gold loses slightly more than half its trades and Bitcoin loses three in four, so runs of four, five, even six losses in a row are normal variance, not the strategy breaking.
If you hit that streak, the 2% risk rule is what keeps it survivable. If a much deeper drawdown than the tests showed (gold’s was about 3%, Bitcoin’s 5%) turns up live, step back and check whether conditions have shifted rather than doubling down.
Trade only capital you can afford to lose, and let the plan, not the last result, drive the next trade.
Where to go from here
The opening range breakout is a session strategy, so it pairs naturally with the broader day-trading toolkit if you want the full intraday picture. And since the whole edge rides on a good stop, the position-sizing math above is worth getting comfortable with before a cent is on the line.
Want to test it yourself? Open a free demo, mark a week of opening ranges on gold or Bitcoin, and take only the loud, counter-trend breaks. Session strategies are the ones most exposed to spread: the break happens in the first minutes after the open, exactly when many brokers widen. Track your results as reward-to-risk, the 1:X on each trade, for 20 trades. That is how you learn whether a setup fits you before real money is involved.
FAQ
What is an opening range breakout, in plain terms?
Does the opening range breakout actually work?
What is the best confirmation for an ORB strategy?
What timeframe should I use for an opening range breakout strategy?
How long is the opening range?
Which markets does the ORB trading strategy work on?
How much money do I need to start?
What is the win rate?
Why do I have to close the trade by the session end?
Can I trade it without volume data?
How many losses in a row should I expect?
What do the key terms mean?
🌍 Our recommended brokers



Quant Researcher & Systems Builder
Quantitative researcher who builds the automated systems behind Arxum strategy testing. Works in Python and Pine Script, using AI alongside classic backtesting to validate strategies on years of real data.