

What the Turtle Trading strategy looks like
Strip away the legend and the turtle system is two lines on a chart and one rule. Price pushes above a recent high, you buy, and you hold until the trend rolls over.
Here is the whole thing on a gold chart, both breakout lines drawn on real price.
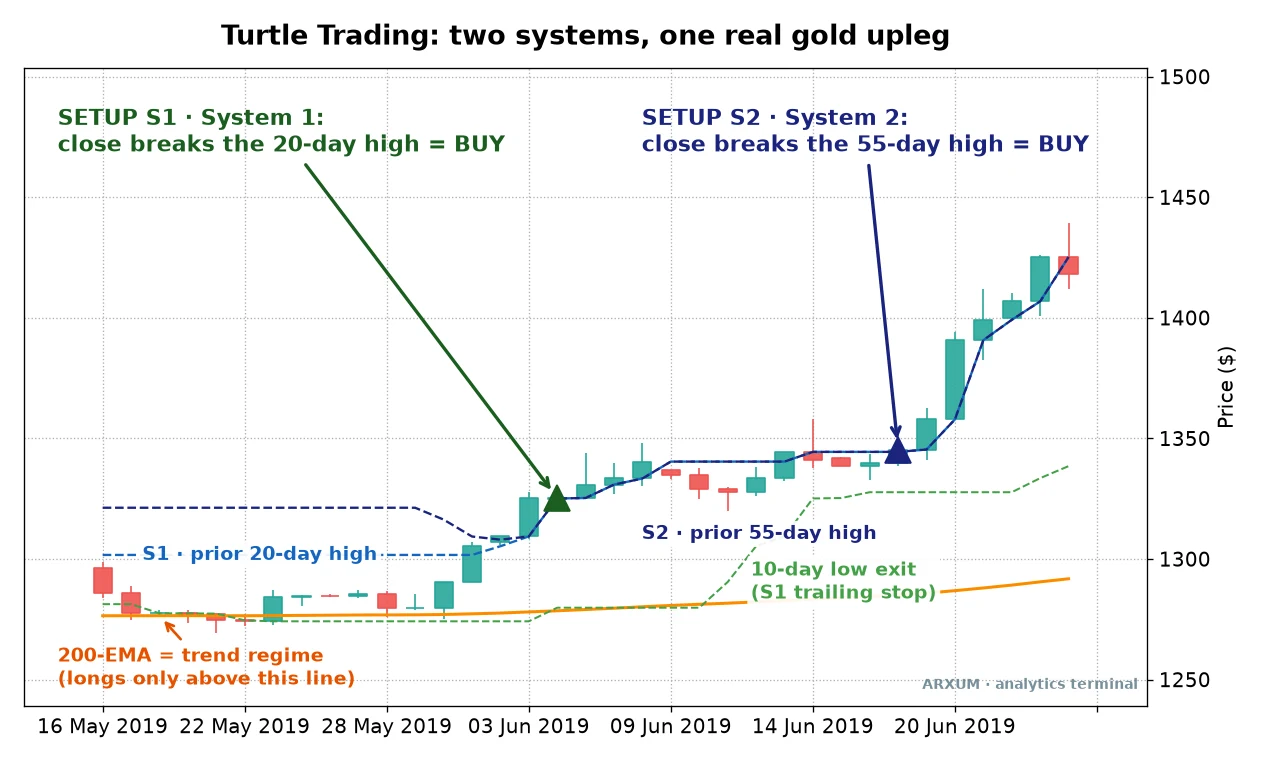
Two channels ride along the top of price. The lower one tracks the highest close of the last 20 days.
The upper one tracks the highest close of the last 55 days.
When a candle closes above one of those lines, the range just broke, and buyers took control. That close is your entry.
The smooth line underneath is the 200-day moving average, the filter that tells you which way to lean.
That is the setup a reader searches for, and it is genuinely that simple to spot. The harder question is whether it still makes money, so I put the rules through eight years of candles and let the numbers answer.
The bet that made novices into traders
In 1983, Richard Dennis believed trading was a skill you could teach. His partner William Eckhardt thought it was innate.
So Dennis ran an experiment.
He recruited a group of ordinary people, a cook, a security guard, a game designer, handed them a mechanical rulebook, and staked them with real money. He called them his Turtles, after the turtle farms he had seen in Singapore.
The rulebook was pure trend-following. Buy breakouts, cut losses fast with a fixed stop, and let the rare big winners run for months.
Over the next few years several of those novices reportedly made millions, and the argument was settled.
Dennis was right. The edge was never a secret indicator.
It was the discipline to follow a plan through a lot of small losses to reach the few trades that matter. Forty years on, the same shape still prints on a gold chart, and now I can measure whether it pays instead of taking the story on faith.
What the system actually is
The Turtles ran two breakout systems side by side. Both buy strength and sell weakness, they just use different lookback windows.
System 1 (the faster one):
- Entry: buy when price closes above the highest close of the prior 20 days. Sell short when it closes below the lowest close of the prior 20 days.
- Exit: trail out when price closes back through the opposite 10-day channel.
- A skip rule: if the last trade in the same direction was a winner, skip the next signal. It sounds odd, and I come back to why it exists.
System 2 (the slower one):
- Entry: the same idea on a 55-day window instead of 20.
- Exit: trail out on the opposite 20-day channel.
- No skip rule. System 2 takes every signal.
Both systems share the two pieces that keep the whole thing alive: the regime filter and the stop.
The regime filter is a 200-day exponential moving average, a line that smooths price to show the longer trend. The rule is one line: only buy when price is above it, only sell short when price is below it.
You trade with the tide, never against it.
The stop is set using the Average True Range, a gauge of how far a market typically moves in a day. Your stop sits two ATR units from your entry.
In a calm market that is a tight stop, in a wild one it is a wide stop, so the risk in dollars stays roughly even whatever the mood.
That distance from your entry to your stop is your risk, the “1” in every risk/reward figure in this article. Written as a ratio, 1:X, the 1 is what you put at stake and the X is the reward.
A trade that runs three times your stop distance is a 1:3 winner.
The exit is worth a second look, because it is not a fixed target. You trail out when price closes back through the counter-channel, which lets winners run for as long as the trend holds.
That single design choice is why the system can catch a move that lasts three months.
The raw rules, both directions
Here is the honest first cut, the classic rules run on gold with no extra filtering, taking every long and every short the system produced.
Two definitions carry the rest of the article, so let me set them down plainly. Profit factor is total winnings divided by total losses across the whole strategy, so anything above 1.0 made money and 2.0 means you won two dollars for every one you lost.
Reward-to-risk, written 1:X, is a per-trade figure. They answer different questions, and a beginner blurs the two because both come out as small numbers.
| Gold setup | Trades | Win rate | Profit factor |
|---|---|---|---|
| 55-day breakout, long | 25 | 48% | 3.08 |
| 20-day breakout, long | 56 | 43% | 2.01 |
| 20-day breakout, short | 21 | 29% | 0.47 |
| 55-day breakout, short | 13 | 23% | 0.38 |
The split is stark. Both long systems make good money, and both short systems lose it.
That is the first honest letdown of the classic rulebook. The Turtles traded both ways because they ran commodities in the 1980s, when markets fell as cleanly as they rose.
In these three markets, over these eight years, the short side simply did not work.
I did not want to trust that on gold alone, so I ran the same rules across two more markets and put every setup on one chart.
Which side actually pays
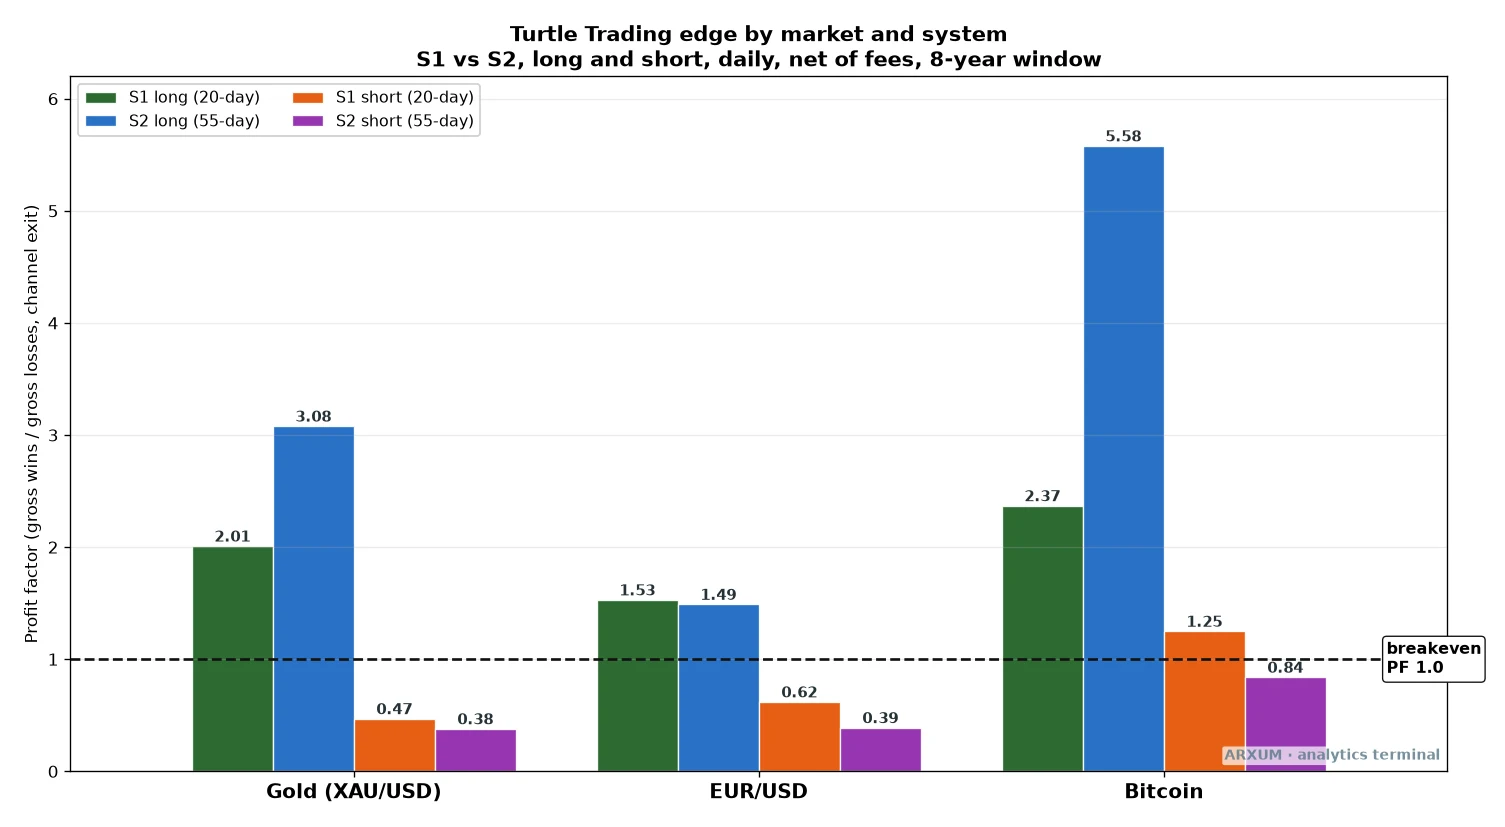
This is the single most useful picture in the article. Each bar is one version of the system on one market.
Bars above the line made money, bars below it lost money.
| Market | S1 long | S2 long | S1 short | S2 short |
|---|---|---|---|---|
| Gold | 2.01 | 3.08 | 0.47 | 0.38 |
| EUR/USD | 1.53 | 1.49 | 0.62 | 0.39 |
| Bitcoin | 2.37 | 5.58 | 1.25 | 0.84 |
Look at the shape, not the exact heights. All the long bars stand above the break-even line.
The short bars sit under it, with one exception. The Bitcoin 20-day short pokes just above, and a later section shows why that one is a mirage that falls apart on fresh data.
The pattern holds on gold, on the euro, and on Bitcoin.
One heads-up before you scan the table for that poke-above bar. The table lists Bitcoin’s 55-day short at 0.84, which is also a loser, sitting below the line.
The bar that pokes just over the line is the faster 20-day Bitcoin short, and the out-of-sample section further down is where it comes apart.
Here are the same numbers as a table you can read row by row.
| Setup | Trades | Win rate | Profit factor |
|---|---|---|---|
| Bitcoin, 55-day long | 27 | 52% | 5.58 |
| Gold, 55-day long | 25 | 48% | 3.08 |
| Bitcoin, 20-day long | 60 | 43% | 2.37 |
| Gold, 20-day long | 56 | 43% | 2.01 |
| EUR/USD, 20-day long | 40 | 48% | 1.53 |
| EUR/USD, 55-day long | 22 | 32% | 1.49 |
| Gold, 20-day short | 21 | 29% | 0.47 |
| Bitcoin, 55-day short | 26 | 27% | 0.84 |
The takeaway: in a market held up by a long-term uptrend, breakouts to the upside pay and breakouts to the downside are noise. That is not the shape deciding, it is the market.
Gold and Bitcoin spent most of these eight years grinding higher, so their up-breakouts had somewhere to go and their down-breakouts kept snapping back.
This is the part of trend-following people skip. Direction is not a preference, it is a reading of the regime.
Above the 200-day average you buy strength, below it you sell weakness, and right now, across these markets, the buy side is the only side.
Gold: the quiet-breakout edge
Spot gold (XAU/USD) is the market to lead with, because it is trending hard and because it hides the article’s most useful surprise.
Most traders assume a breakout wants drama, a big volatile candle punching through the high on heavy trading. The gold data says the opposite.
The best breakouts came out of quiet markets.
Here is what happens to the 55-day gold system when you only take breakouts that fire while the market is calm.
| Gold, 55-day long | Trades | Profit factor |
|---|---|---|
| Every breakout | 25 | 3.08 |
| Only when trend strength is low | 13 | 6.59 |
| Only when calm and quiet | 12 | 10.3 |
| Only volatile breakouts | 13 | 0.91 |
“Trend strength” here is the ADX, a standard gauge that runs from about 10 in a sleepy market to 40 in a strong trend. You will find it free on any charting platform.
The counter-intuitive rule is to buy when ADX is low, under 22, because a low reading means the market has gone quiet and coiled, not that it is dead.
Read the last two rows together. Breakouts from calm markets returned a profit factor above ten.
Breakouts from already-wild markets barely broke even. The volatile ones are where you are late, buying after the move has already spent itself.
One important caveat, so this does not trip you up later. This quiet-market, low-ADX filter is an extra edge that showed up only on gold.
The EUR/USD and Bitcoin configurations in this article do not use it. They take every breakout that fires above the 200-day line, no matter how calm or busy the market looks.
So when you reach the euro trade further down that wins on high trend strength, that is not the method breaking its own rule. It is the euro simply not running the gold-only quiet filter.
How to see “quiet” on your own chart: the candles shrink and the daily range tightens for a stretch, then one candle closes above the 55-day line. That is accumulation ending.
On the indicator, ADX sitting below 22 as the breakout fires is your green light.
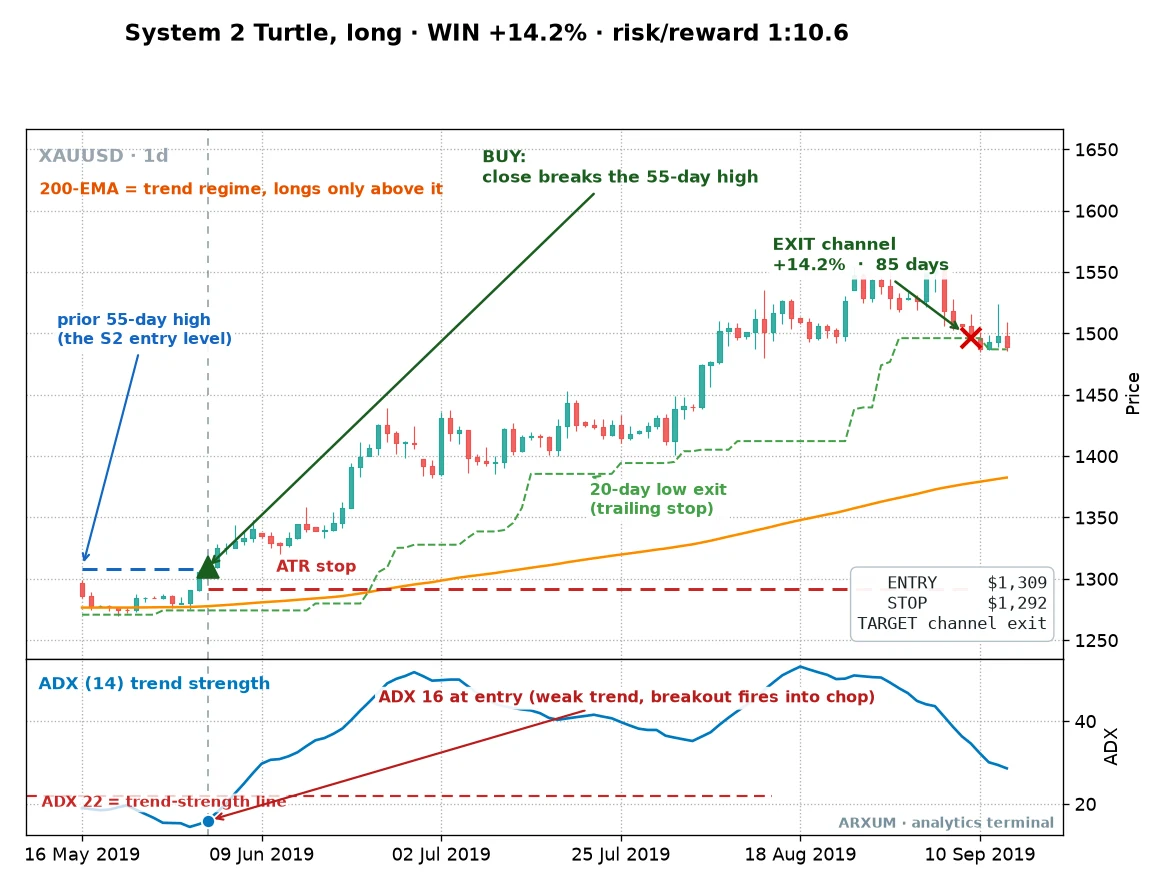
Here is that setup as a working trade. A recent gold breakout cleared the 55-day high after a long quiet stretch, with ADX down at 16.
Price broke out above the 55-day high after that quiet stretch, and the 55-day system held it for roughly three months as gold trended up, trailing out on the 20-day counter-channel for a gain of about 14%. Measured against the stop, that trade paid better than ten times its risk, a 1:10 winner.
One trade like that covers a long line of small losers.
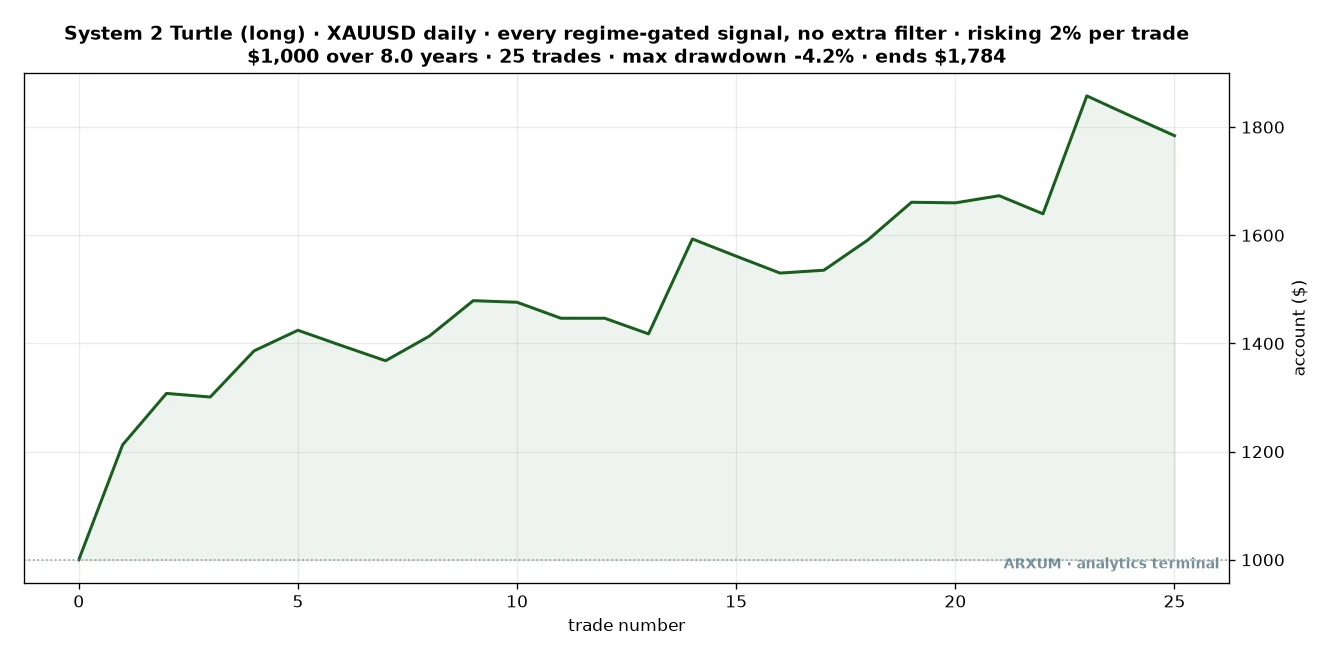
Here is the full statement for the quiet 55-day system on gold.
| Trades | 25 |
| Win rate | 48% |
| Reward-to-risk | 1:3.3 |
| Profit factor | 3.08 |
| Max drawdown | -4.2% |
| Net return on $1,000 | +78% |
A $1,000 account risking a steady slice per trade grew to about $1,784 over the eight years, and the worst peak-to-valley dip along the way was a mild 4.2%. That is a smooth ride for a strategy that wins under half its trades.
If you want more signals, the faster 20-day system on gold trades more than twice as often for a slightly lower edge.
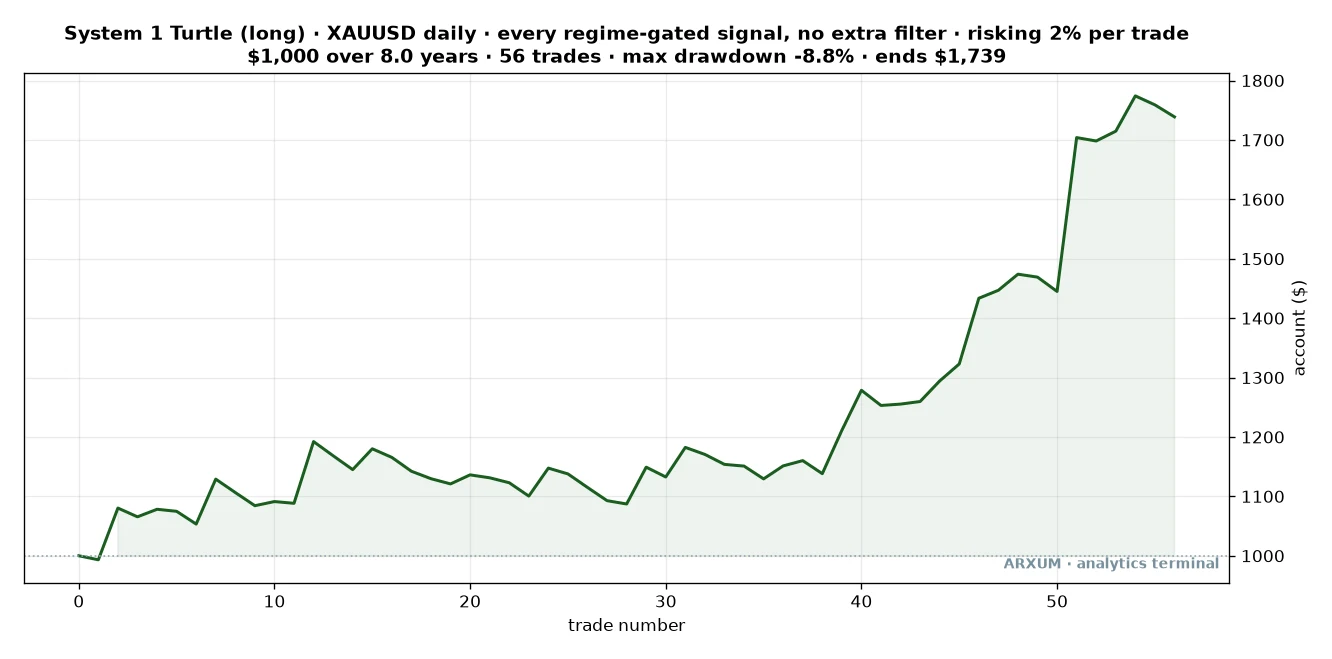
| Trades | 56 |
| Win rate | 43% |
| Reward-to-risk | 1:2.7 |
| Profit factor | 2.01 |
| Max drawdown | -8.8% |
| Net return on $1,000 | +74% |
Same market, same direction, twice the activity, a bit more drawdown. The 20-day is for a trader who wants to be in the market more often.
The 55-day is for one who would rather wait for the cleaner signal and sit through fewer trades.
When the breakout fails
A 43% win rate means most gold trades in the fast system did not work. Honesty means showing what a loss looks like, because that is what you sit through to reach the winners.
One gold breakout fired on the 20-day high right before a violent selloff. Price never followed through.
The 2-ATR stop closed it within six days for a loss of 3.35%.
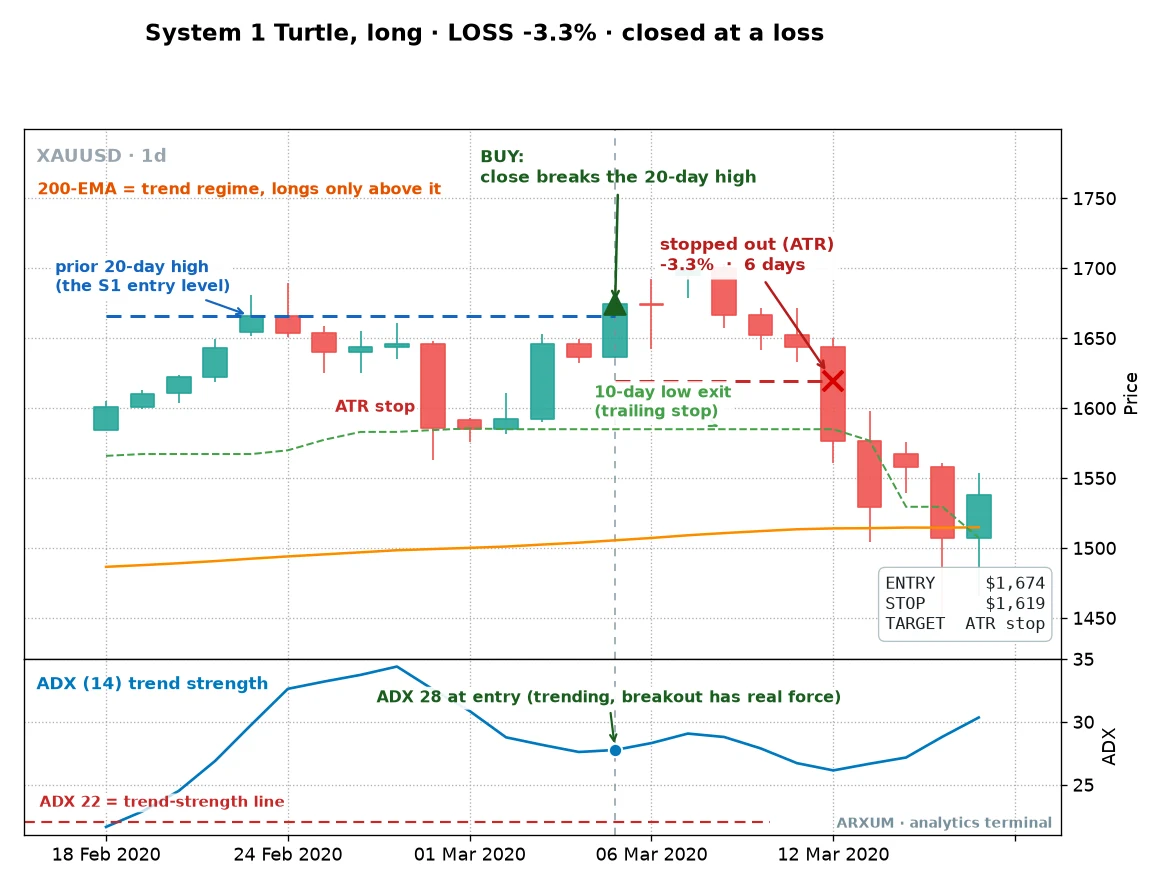
That is the whole point of the fixed stop. The move that followed was brutal, and a trader without a hard stop could have given back a month of gains on one position.
The rule capped it at a small, survivable loss and moved on.
The rule of thumb: the stop is not there to be right, it is there to keep any single loss small enough that the next winner more than covers it. In this system the average winner is worth two to three times the average loser, so a run of these small losses is normal and expected, not a sign the method is broken.
Bitcoin: where the 55-day system goes big
Bitcoin (BTC) is where the trailing exit earns its keep, because crypto trends are longer and larger than anything in Forex.
The 55-day system on Bitcoin returned the highest profit factor in the whole test, and it did it with the strategy’s cleanest single trade.
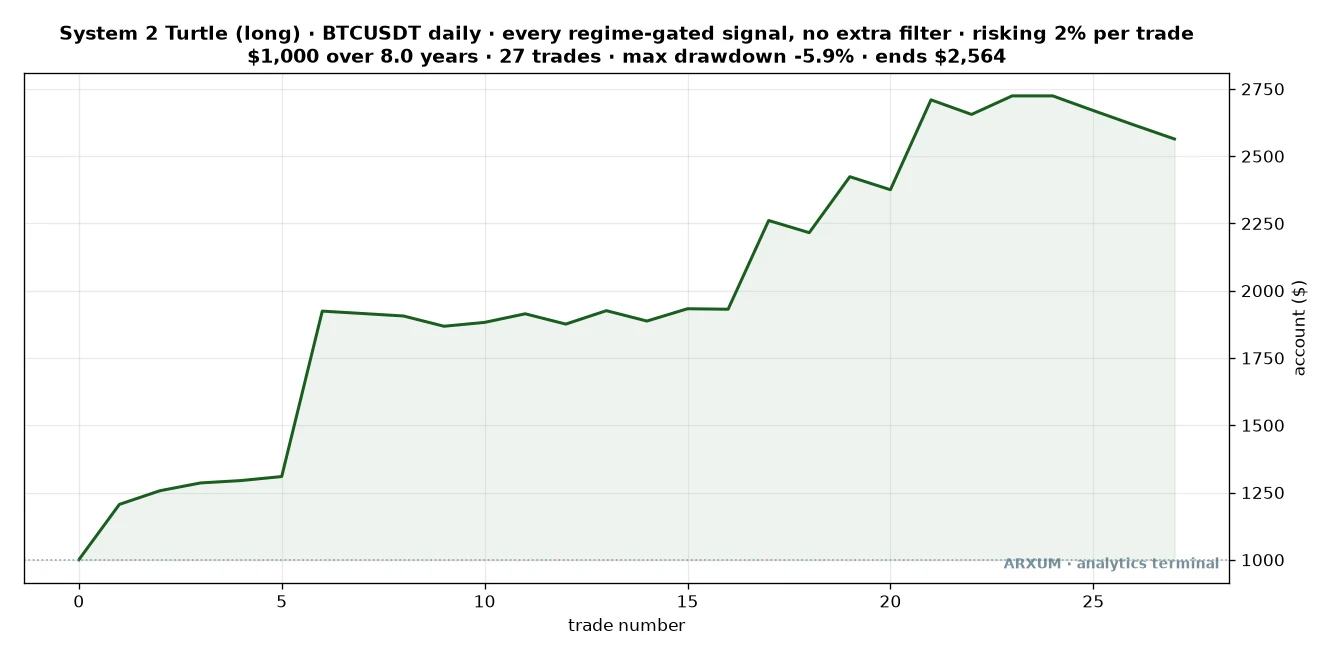
| Trades | 27 |
| Win rate | 52% |
| Reward-to-risk | 1:5.2 |
| Profit factor | 5.58 |
| Max drawdown | -5.9% |
| Net return on $1,000 | +156% |
A $1,000 account compounding a steady risk per trade grew to about $2,564. The reward-to-risk here is huge, 1:5.2 on average, because the trailing exit lets a single breakout ride a multi-month bull leg.
One recent Bitcoin breakout shows how. The system bought a close above the 55-day high around $28,000, with the trend already turning up.
It trailed the position for about eleven weeks and exited near $40,700 on the 20-day counter-channel, a gain above 45% and a trade worth more than eight times its risk.
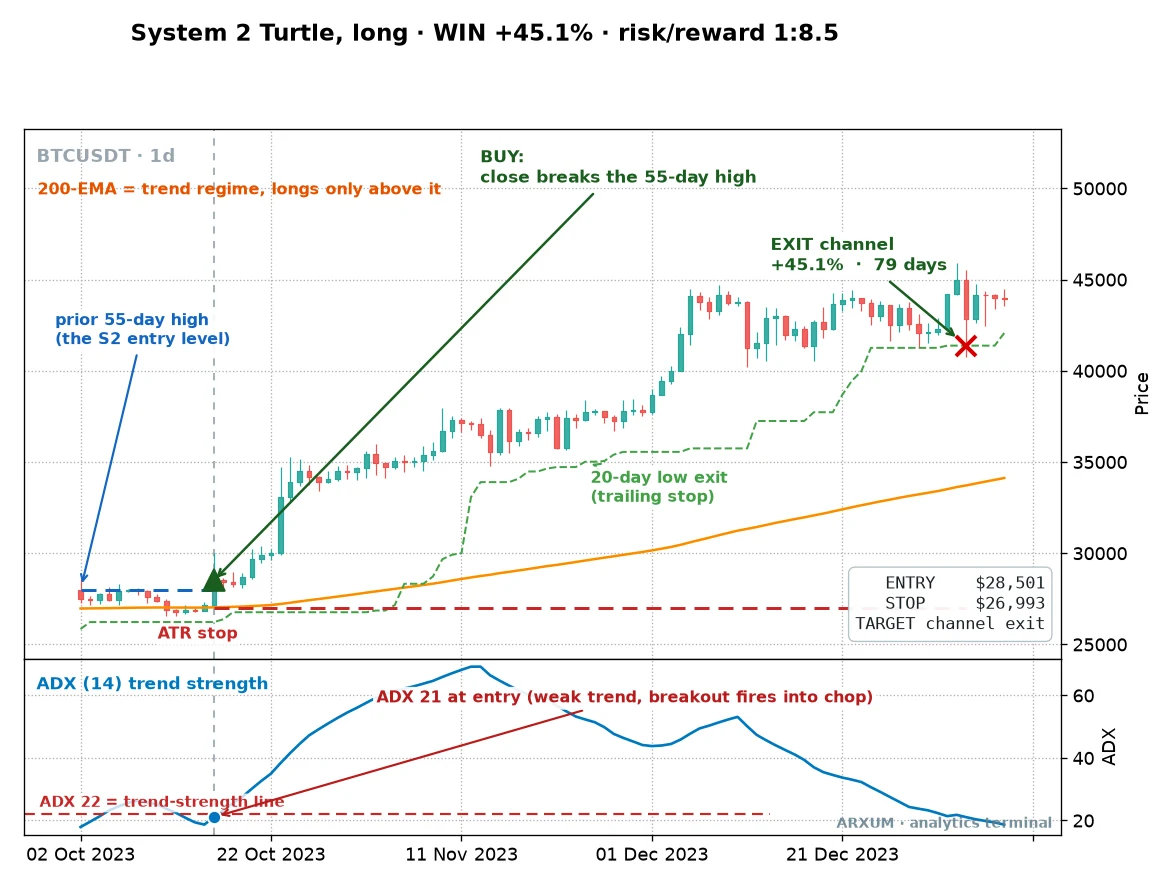
The all-time best trade in the set was larger still, a breakout that ran for three months and returned well over one hundred percent, more than twenty times the risk on that position.
Now the honest counterweight. Simply holding Bitcoin across these eight years returned far more on paper.
The catch is the ride: buy-and-hold suffered a peak-to-valley fall of about 76% along the way. The turtle system captured a large share of the gains at a drawdown of 5.9%.
You give up some upside to sleep at night, and for most traders that is the trade worth making.
EUR/USD: a thinner but real edge
Most readers here trade Forex, so the euro deserves a straight answer. The turtle system works on the euro (EUR/USD), but the edge is modest.
The 20-day long system returned a profit factor of 1.53 over 40 trades, and the 55-day long returned 1.49 over 22. Both clear the break-even line, neither is spectacular.
What makes those numbers matter is the backdrop. Simply holding the euro across the same eight years lost money, down about 1.6%.
The system turned a flat, chopping market into a small positive edge by catching the clean dollar-weakness legs and sitting out the rest.
One euro trade tells the story. The system bought a breakout during a strong dollar-weakness run, when trend strength was high, and trailed out 24 days later for a gain near 3.6%, a 1:3 winner.
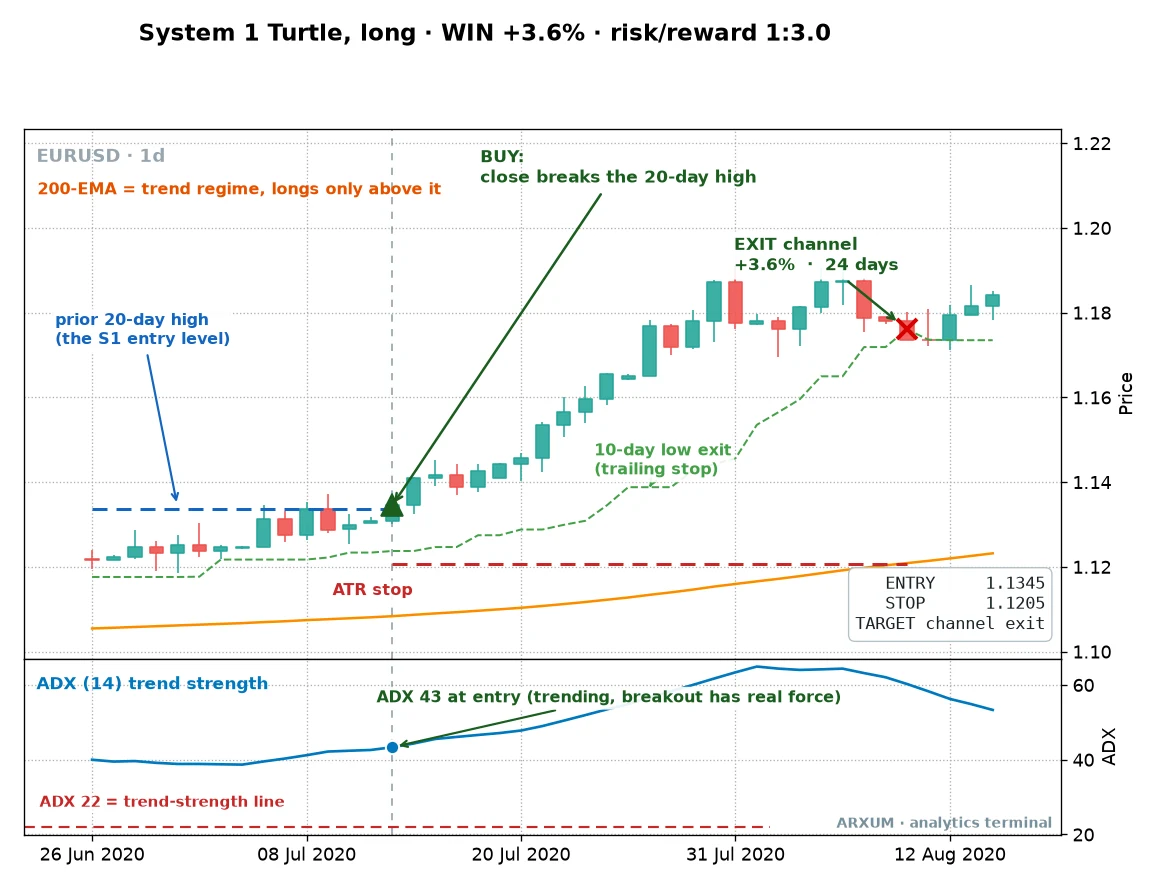
The honest read on Forex: the euro pays you for patience, not excitement. If you want the bigger edges, gold and Bitcoin trend harder.
If you want to trade the world’s most liquid market, the turtle rules still beat doing nothing, as long as you only take the long side while price holds above the 200-day line.
Does the short side ever work?
Short and clear: not in this implementation, on these markets.
Every short setup on gold and the euro lost money. The only short that came close was the 20-day Bitcoin short, and it earns an asterisk, not a recommendation.
That Bitcoin short showed a profit factor of 1.25 in the full sample. But when I split the data and checked it on the years the system had never seen, it dropped to 0.86, below break-even.
An edge that only exists in the data you built it on is not an edge, it is a coincidence.
The lesson is the regime, not the rulebook. The Turtles shorted freely because 1980s commodity markets fell in clean, tradeable trends.
Gold and Bitcoin over these eight years mostly went up, so their down-breakouts were traps. If these markets rolled into a real downtrend, price would spend months below the 200-day line, and the short rules would come alive again.
On a currency pair a short is just a sell, no borrowing and no special risk, so the tool is there when the regime turns. Right now it has not turned.
How much of this survives new data
A strategy that only shines on the years it was tuned to is worthless. So I split the eight years in half.
The system was shaped on the first four years, then checked on the last four, which it never saw while I was building it.
| Setup | Profit factor, first half | Profit factor, unseen half |
|---|---|---|
| Gold, 20-day long | 1.20 | 3.13 |
| Gold, 55-day long | 6.72 | 2.15 |
| Bitcoin, 55-day long | 3.56 | 3.26 |
| EUR/USD, 20-day long | 1.60 | 1.83 |
Read that column on the right. On data the system had never touched, every winning setup stayed profitable.
Gold’s fast system actually did better on the unseen years, the euro held, and Bitcoin barely moved. Gold’s slow system cooled from a very high number to a still-strong 2.15.
What that proves: the edge is not a curve-fit to one lucky stretch. A rule that keeps working on data it was never shaped to is one you can trust with real money.
There is no walk-forward re-optimisation here and no promise the future matches the past, but out-of-sample survival is the strongest honest check available, and these setups passed it.
One more honesty note. Trend-followers live and die by their biggest winners.
Pull the single best Bitcoin trade out of the set and the profit factor falls, because that is how this game works: a low win rate, a lot of small losses, and a few outsized runners that carry the account. If that pattern makes you uncomfortable, this is not your strategy.
How to trade it, step by step
Here is the whole method as a checklist you can run on a free chart. The setup is the same two channels from the chart at the top of this article.
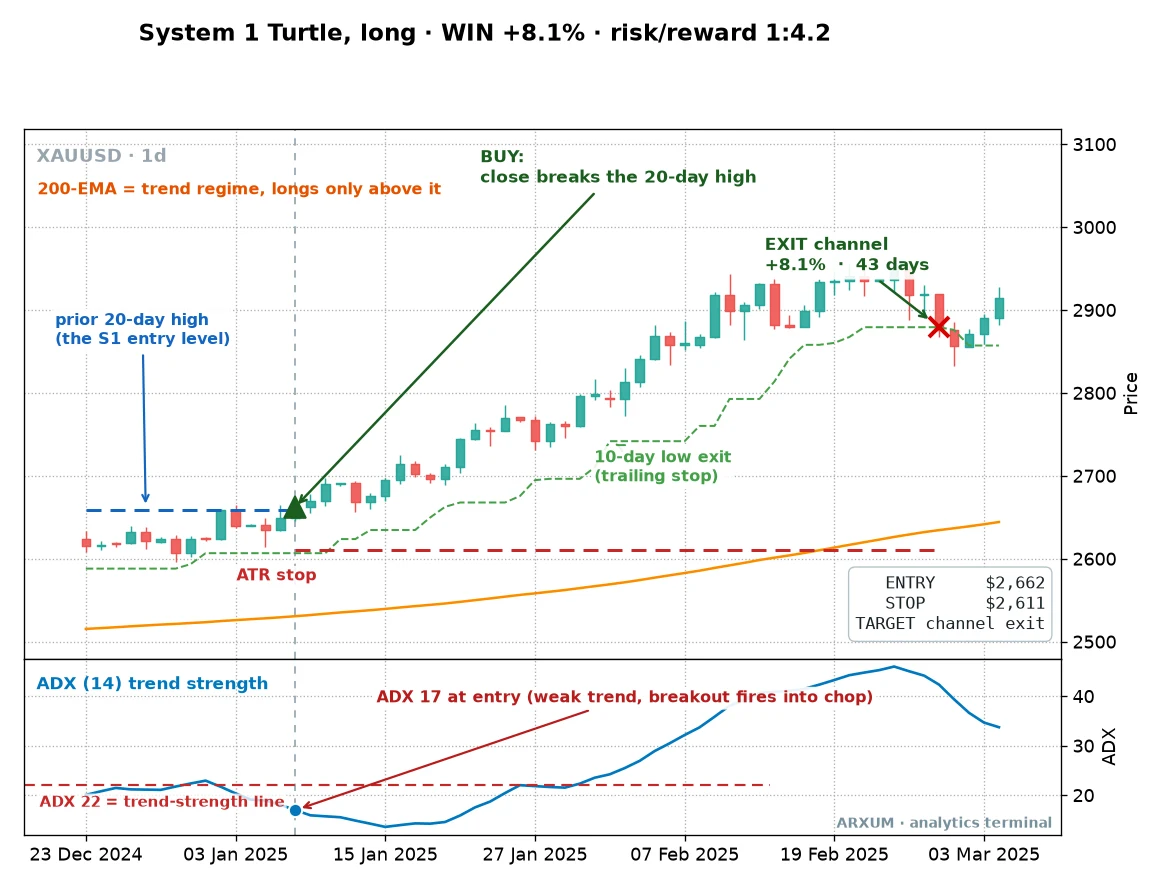
- Pick your window. The 55-day breakout for fewer, cleaner trades. The 20-day for more activity. Set a Donchian channel to that length, which draws the recent highs and lows automatically.
- Check the regime. Add a 200-day EMA. Only look for buys while price is above it. Below it, you stand aside on these markets.
- Wait for the close. Enter only when a candle closes above the channel high. An intrabar poke that closes back inside does not count.
- Set the stop. Add an ATR indicator at length 14. Your stop sits two ATR below your entry. Read the ATR value off the chart and double it.
- Trail the exit. Hold until price closes back through the counter-channel, the 20-day for the 55-day system, the 10-day for the 20-day system. No fixed target. You let it run.
On TradingView, type the ticker, click Indicators, and add “Donchian Channels,” “Moving Average Exponential,” and “Average True Range.” On MT4 or MT5, use Insert then Indicators, with the channel and moving average under Trend and the ATR under Oscillators.
Sizing it on a real account
This is where most guides wave their hands. Let me show the arithmetic on a small account.
The rule is to risk a fixed 2% of your account per trade. On a $1,000 account that is $20 at stake on any single position.
Here is the position sizing in three steps, worked on the euro because it fills cleanly on a small balance.
- Step 1, your risk budget: 2% of $1,000 = $20.
- Step 2, your risk per unit: first, two quick terms. A pip is the smallest standard price step on a currency pair, the fourth decimal on EUR/USD. A micro lot is the smallest common trade size, 1,000 units of the base currency. Now the math: say the breakout is at 1.0850 and two ATR puts your stop 100 pips below at 1.0750. On EUR/USD a micro lot is worth about $0.10 per pip, so 100 pips of risk costs $0.10 × 100 = $10 per micro lot.
- Step 3, your size: $20 ÷ $10 = 2 micro lots (0.02 of a standard lot).
What that sizing means for leverage. Two micro lots is about 2,000 euros of position. At 1.0850 that is roughly $2,170 of currency you are controlling on a $1,000 account, a little over two times your balance in effective leverage.
That is the leverage number that matters. The much larger leverage a broker advertises is only margin headroom, the room it gives you to hold the position, not extra risk.
Your risk stays the $20 your stop defines, whatever the broker allows.
To place it, you set a buy-stop order at 1.0850 so it triggers the moment price breaks out, put 1.0750 in the stop-loss field, and leave the take-profit blank because you are trailing the exit by hand on the counter-channel.
A word of honesty on gold. At recent prices, two ATR on gold is a wide stop in dollars, and a $1,000 account risking $20 sizes below the smallest gold lot most brokers offer.
If you want to trade the gold setup on a small balance, you need a broker that offers cent or micro sizing on metals. Otherwise, run the euro configuration until the account is larger, then move up to gold.
Three ready configurations from the test, to copy straight onto a chart:
- Steady gold: XAU/USD daily, buy the 55-day close breakout, only while ADX is under 22, stop 2 ATR, trail the 20-day channel.
- Active gold: XAU/USD daily, buy the 20-day close breakout above the 200-EMA, stop 2 ATR, trail the 10-day channel.
- Big-trend Bitcoin: BTC daily, buy the 55-day close breakout above the 200-EMA, stop 2 ATR, trail the 20-day channel, and expect long holds.
The risk the Turtles actually managed
The Turtles were not famous for finding breakouts. Everyone can see a breakout.
They were famous for surviving the losing streaks between the winners, and that is the part you have to plan for.
Start with the numbers this system really produces. The win rate sits between 43% and 52%.
That means losing runs are not a malfunction, they are the normal texture of the strategy. You will have stretches where five small losses land in a row while you wait for the next trend.
The circuit breaker: if you take three to six losses in a row, stop and look up. One bad week is variance and you trade through it.
A sustained run of stops on trades that should have worked can mean the market has stopped trending, and a range-bound market is where breakout systems bleed. Step back and check the regime before you keep firing.
Psychology does the rest of the damage. Do not chase a breakout you missed, do not double your size to win back a loss, and do not get giddy after a big winner and abandon the plan on the next trade.
The edge lives in taking every valid signal the same way, boring trade after boring trade.
The skip rule the Turtles used speaks to this directly. After a big winner, the next signal in that direction often fails, so System 1 skips it.
It is a built-in guard against the euphoria that makes traders oversize right after a win.
Finally, keep a calm eye on live results versus the test. If your real trading runs a little worse than the numbers here over a handful of trades, that is ordinary slippage and variance, not a reason to quit.
If it runs materially worse across a real sample of twenty or thirty trades, the market conditions may have shifted, and the honest move is to step back and check, not to keep forcing the trade or to declare the method dead. Only risk money you can afford to lose while you learn how the strategy feels in real time.
One cost the backtest does not charge you: trend systems hold positions for weeks, and the overnight swap quietly compounds against a long hold. Before running this live, check what holding actually costs at your broker rather than what the spread table advertises.
Where to go from here
The turtle system is one clean way to trade with the trend, and the engine behind it is the same one used by every breakout method. If you want to build your own variant, the Donchian channel guide covers the entry lines in depth, and the breakout trading primer covers the wider family of setups.
The single idea worth keeping is smaller than the whole rulebook. Buy strength above the 200-day line, cap every loss with an ATR stop, and let the winners run on a trailing exit.
That is the machine that turned a cook and a security guard into traders, and the data says it still runs.
FAQ
What is the Turtle Trading strategy, in plain terms?
Does the turtle trading system still work today?
What is the best timeframe for it?
What settings do the Turtles use?
Which markets does it trade best?
How much money do I need to start?
What is a profit factor, and what is a good one?
Why is the win rate under 50%?
Can I trade it short?
Why buy breakouts from quiet markets?
How is this different from the Darvas Box?
A quick glossary of the terms in this article
🌍 Our recommended brokers



Forex Analyst & Senior Trader
Former FX desk trader with 8 years in institutional forex. Works in multi-timeframe analysis and order flow, turning desk experience into systematic, testable rules across forex and metals.