
The Kelly criterion formula, by the textbook
Here is the thing you came for. The Kelly criterion answers one question: given an edge, how much of your account should you stake on the next bet?
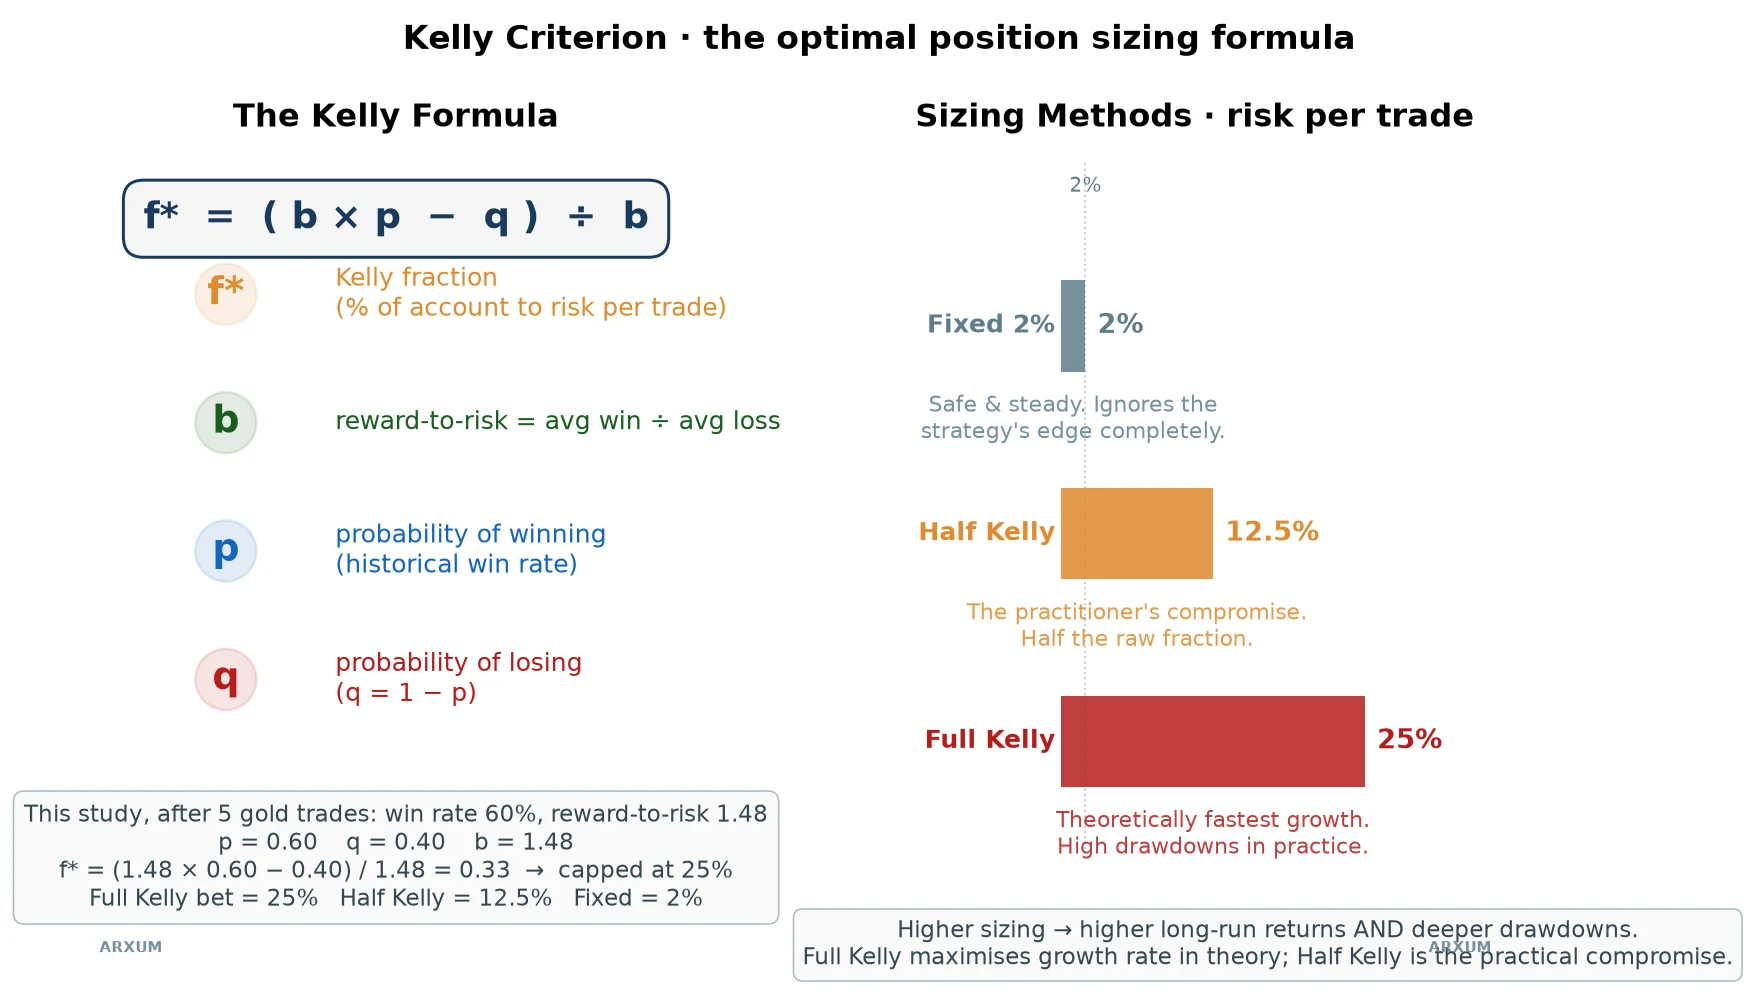
The formula looks worse than it is. It reads f* = (b × p − q) / b, and every letter is something you already track.
- p is your win rate, the share of trades that win.
- q is just 1 minus p, the share that lose.
- b is your reward-to-risk, how many times its risk the average winner makes back.
- f* is the answer: the fraction of your account to put on the trade.
Feed it a real edge and it spits out a percentage. That percentage is “full Kelly,” the size that grows the account fastest in theory.
Run it on this study’s early numbers and the trap shows itself. After the first five gold trades the win rate was 60% (so p = 0.60 and q = 0.40) and the reward-to-risk b came in at 1.48.
Plug those in and Kelly says stake a third of the account, about 33%, on a single trade.
We cap that at 25%, which is full Kelly here. Half Kelly is 12.5%, and the flat rule ignores the edge and risks a fixed 2%.
Most people who use it never bet the full amount. They bet half of it, or a quarter, and we will get to why that instinct is the smart one.
From blackjack tables to trading charts
The formula is not folklore. John Kelly, a physicist at Bell Labs, published it in the 1950s to size bets on noisy information.
The gamblers found it first. Card counters used the Kelly criterion for betting at blackjack, staking more when the deck favoured them and less when it did not.
Traders borrowed the same idea. A trade is a bet with a known-ish win rate and payoff, so in principle Kelly should tell you the position size that compounds fastest.
That is the theory that sells courses. We wanted the version that survives contact with real trades, so we needed a real strategy to size.
The strategy we sized three ways
You cannot judge a sizing rule on a losing strategy, because bad sizing just loses faster. So we built one with a genuine edge first, then changed nothing but the bet size.
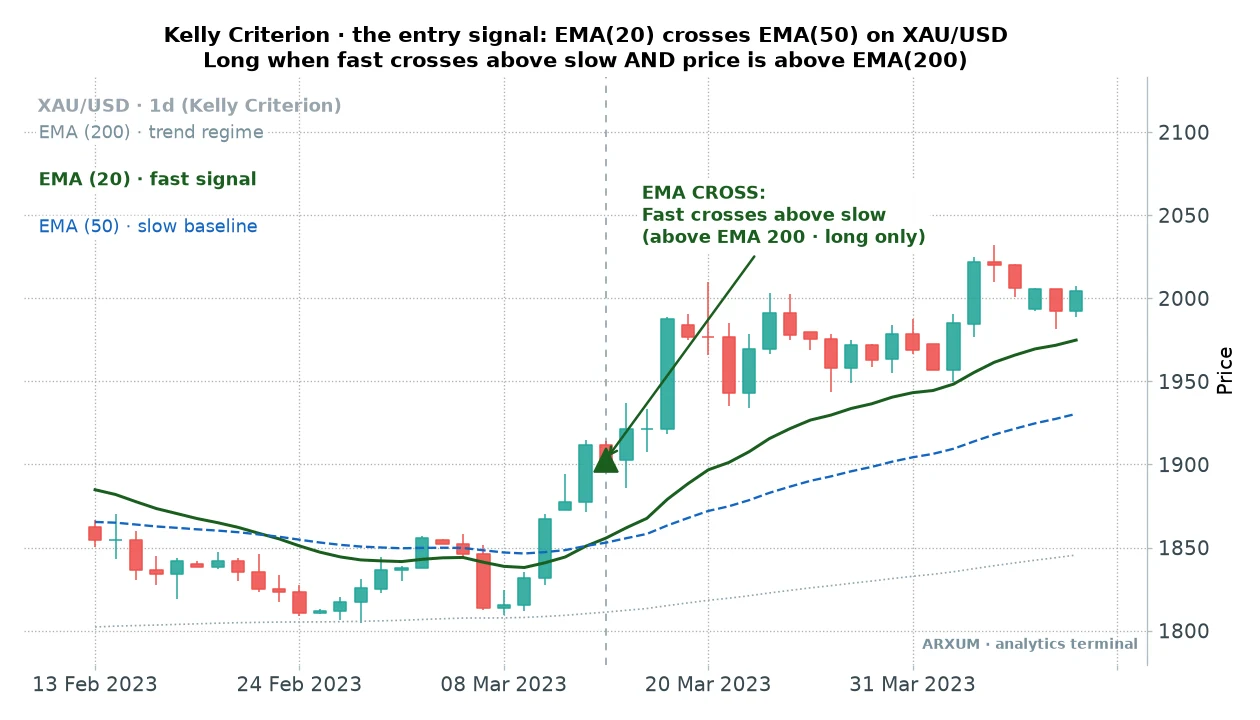
The setup is a classic moving-average cross on spot gold (XAU/USD), on the daily chart. Nothing exotic, which is the point.
- The trend backdrop first. Only go long, that is, only buy, when price is above its 200-day exponential moving average, the line that traces the long-term trend. Above it means uptrend, and that is the only place these buy trades are allowed.
- The trigger. Buy when the fast 20-day average crosses up through the slow 50-day one. Momentum has just turned up inside a confirmed uptrend.
- The stop. Under the recent swing low, the lowest low of the last ten days. The gap from entry down to that stop is your risk, the 1 in every risk/reward figure here.
- The target. A fixed 2R, twice that risk. Risk a dollar, aim for two, a risk/reward of 1:2.
- The backstop. If neither stop nor target is hit, close after 30 days.
The one-line version: trade with the 200-day trend, buy the 20/50 cross, stop under the swing low, aim for twice your risk.
Set it up yourself. On TradingView (or MT4/MT5), load daily gold (XAU/USD) and add five built-in indicators:
- Three Moving Average Exponential lines, set to 20, 50, and 200 periods, applied to the close.
- ADX with a length of 14, for the trend-strength read we cover further down.
- Average True Range (ATR) with a length of 14, for the volatility read.
That is the whole chart. The 20 and 50 lines give you the cross, the 200 line is the trend filter, and ADX and ATR are the two quality checks.
Over an eight-year daily window that setup made money. Not a fortune, but a small, genuine edge, and that is all Kelly needs to work with.
Does the strategy actually pay?
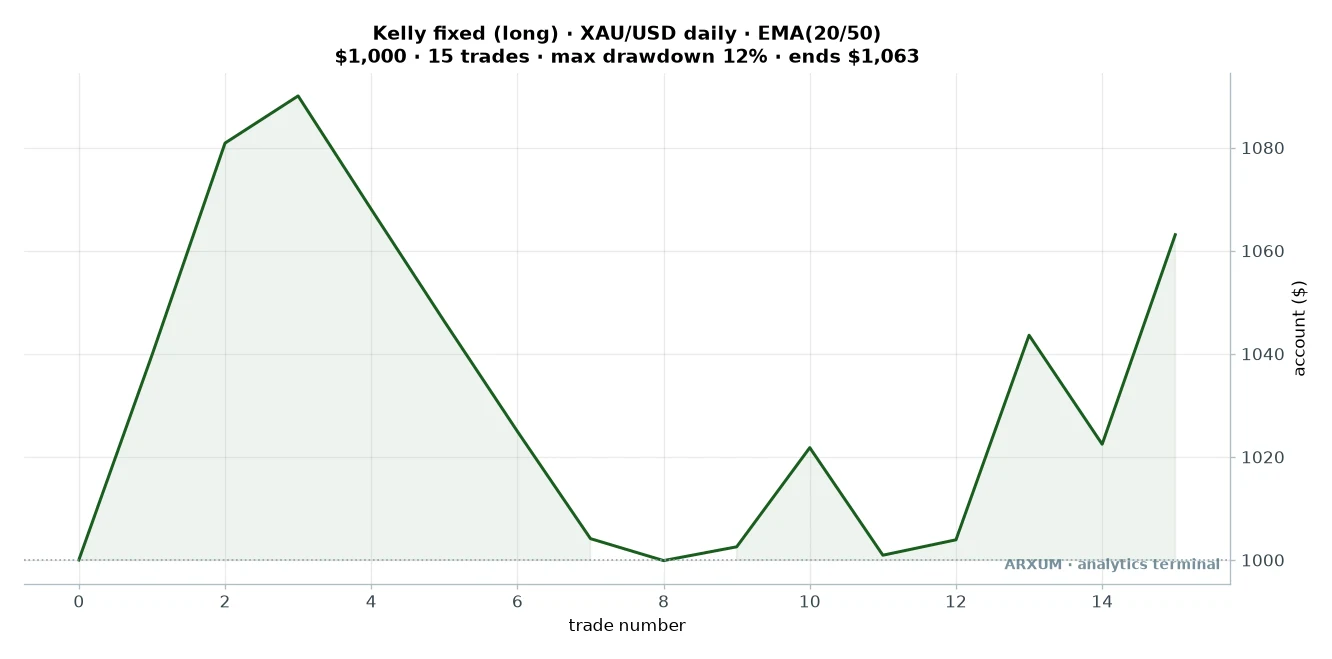
Before touching Kelly, here is the base strategy sized the boring way: a flat 2% of the account risked on every trade.
Here is what that 2% looks like in real money. On a $1,000 account, 2% is $20 of risk on the trade.
If the swing-low stop sits about $50 below your gold entry, you size the position so a $50 move against you loses that $20, which works out to roughly 0.004 lots.
A lot is the standard trade-size unit brokers use, so 0.004 lots is tiny: about 0.4 ounces of gold, near the smallest size many brokers allow.
That position is only about 0.75 times your account in notional gold, comfortably under 1x. Notional just means the full face value of the gold you control, not the small margin you put up to hold it.
So the stop distance sets the size, not the leverage your broker offers.
Leverage here is only margin headroom, the collateral to hold the position open, not extra risk on the trade. The rest of the broker’s leverage simply sits unused.
| Trades | 15 |
| Win rate | 53% |
| Reward-to-risk | 1:2 target |
| Profit factor | 1.76 |
| Max drawdown | −12% |
| Avg hold | up to 30 days |
| Net return on $1,000 | +6% |
Two numbers in that table deserve a plain word. Profit factor is the total dollars won divided by the total dollars lost, so 1.76 means the system made $1.76 for every $1 it gave back.
Max drawdown is the worst peak-to-trough dip in the account along the way, here about 12%.
Read the return honestly. A +6% gain over eight years is modest, and I would call it barely worth trading on its own.
But it is genuinely positive, with a healthy profit factor and a shallow drawdown. It is a clean edge to test a sizing rule against, which is exactly what we needed.
One honest caveat before we go on. Split the eight years in half and the edge is lopsided.
The first four years, 2019 to 2022, barely broke even, a 37.5% win rate and a profit factor of just 1.13. Almost all the gain came from the 2023 to 2025 gold bull run, where the profit factor jumped to 3.31.
So treat this as a trend-only strategy: it pays when gold runs hard in one direction and roughly treads water when it does not.
The engine only fired fifteen times in eight years, because a daily cross above the 200-day line is a rare, patient signal.
Hold that number in mind. It turns out to be the whole story.
A clean cross, start to finish
Here is one of those trades, from the entry to the exit.
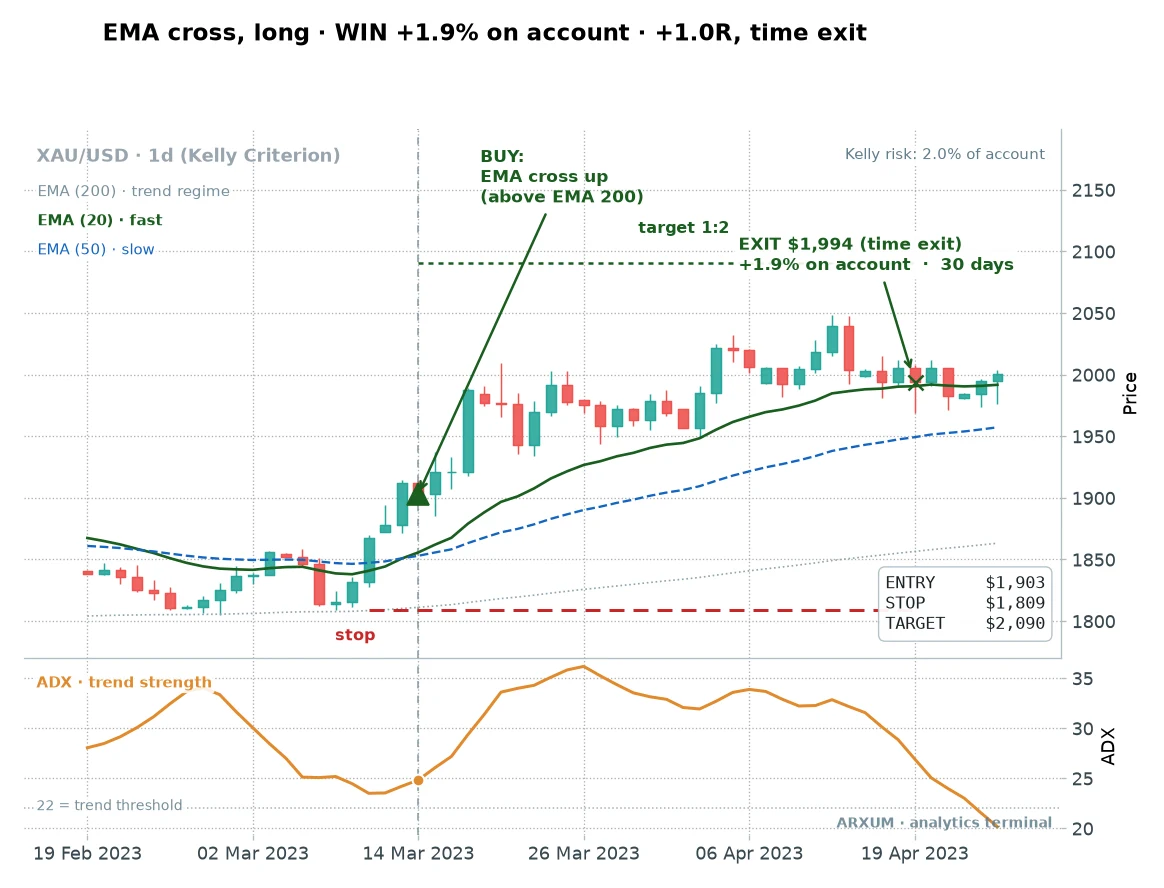
Two quick labels first. The lower panel is ADX, a trend-strength gauge we cover further down, and the small “+1.0R” on the chart just means the trade made about one times the amount it risked.
Gold was grinding higher above its 200-day line. The fast average had been flat, then crossed up through the slow one, the green triangle.
That is the entry, near $1,903. The stop went under the swing low, and the target sat twice that distance above.
Price climbed for a few weeks, so on an account risking 2% this trade added about +1R, roughly half of what the full 1:2 target would pay.
Notice it did not reach the full target. It ran partway, then the 30-day rule closed it at about +1R, roughly half the 2R the target promises.
That is normal, and it is exactly why the average trade here lands below 2R.
The winner that only crawled
One clean runner flatters any strategy. Here is a more honest one, the highest-quality entry in the whole study, and it barely paid.
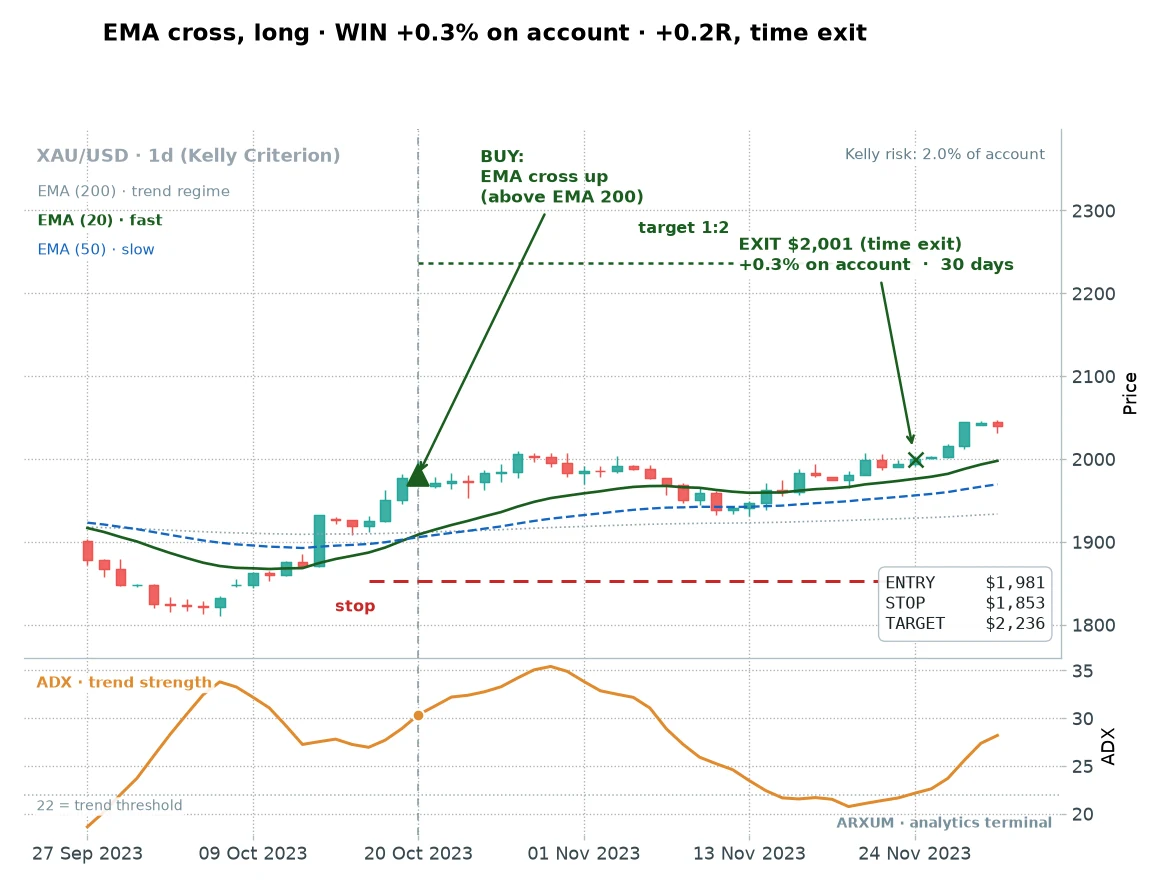
By the numbers this was the cleanest signal in the eight years. Calm market, strong trend, the entry the filters love.
And it went almost nowhere. Price wandered, never reached the stop below or the target above, and the 30-day backstop closed it a whisker in the green.
This is the outcome the highlight reels skip. A perfect-looking entry is not a promise, it is a probability, and plenty of them just fizzle.
The strategy still works because its handful of full 2R winners more than pay for trades like this one. That shape matters more than any single chart.
When the cross fails
On the desk, nobody trusted a setup until they had watched it lose. Here is one that did.
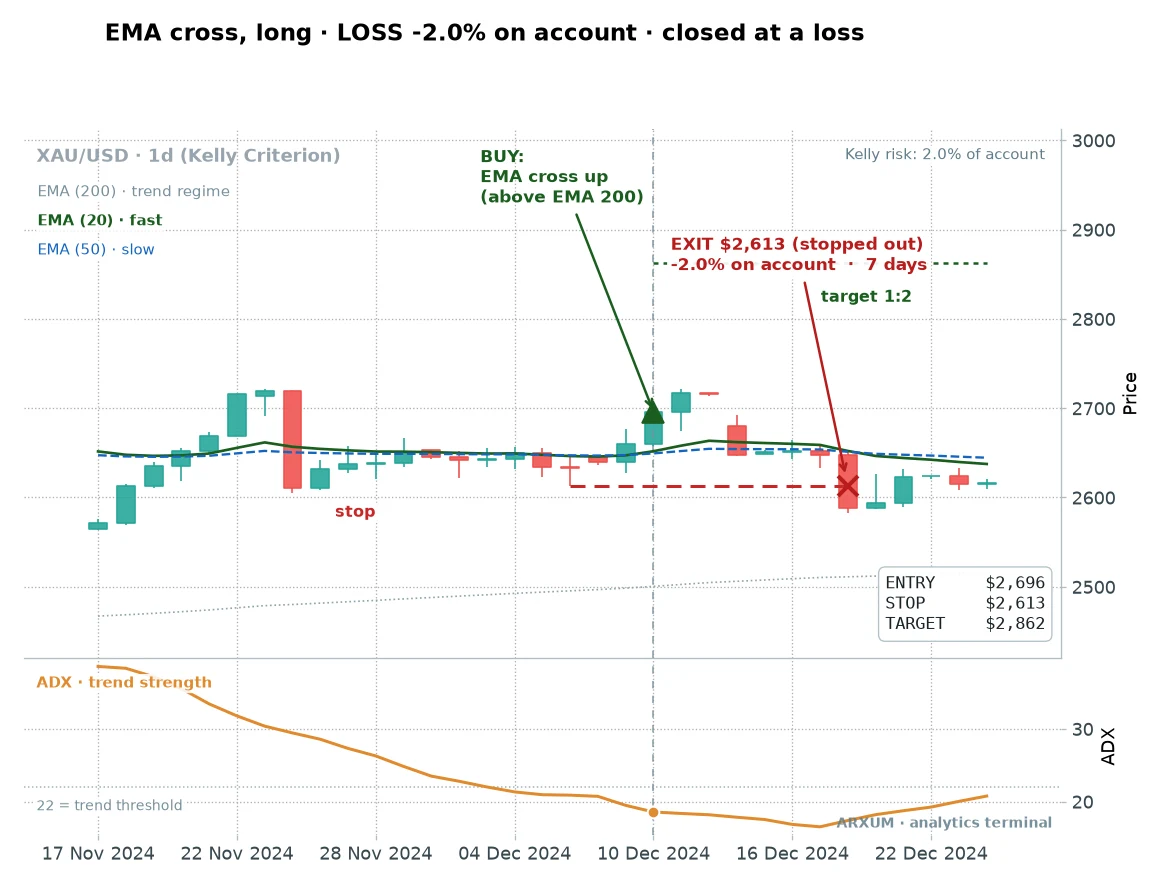
The cross fired above the 200-day line and looked just like the winners. Then gold turned down.
The stop did its job and capped the damage at the 1 we risked, a flat 2% of the account. No drama, no widening the stop to “give it room,” just a small, controlled loss.
A win rate of 53% means you lose almost half the time. Your only job on those trades is to keep each loss near that 1.
The swing-low stop does exactly that.
The key finding: Kelly sized it into the ground
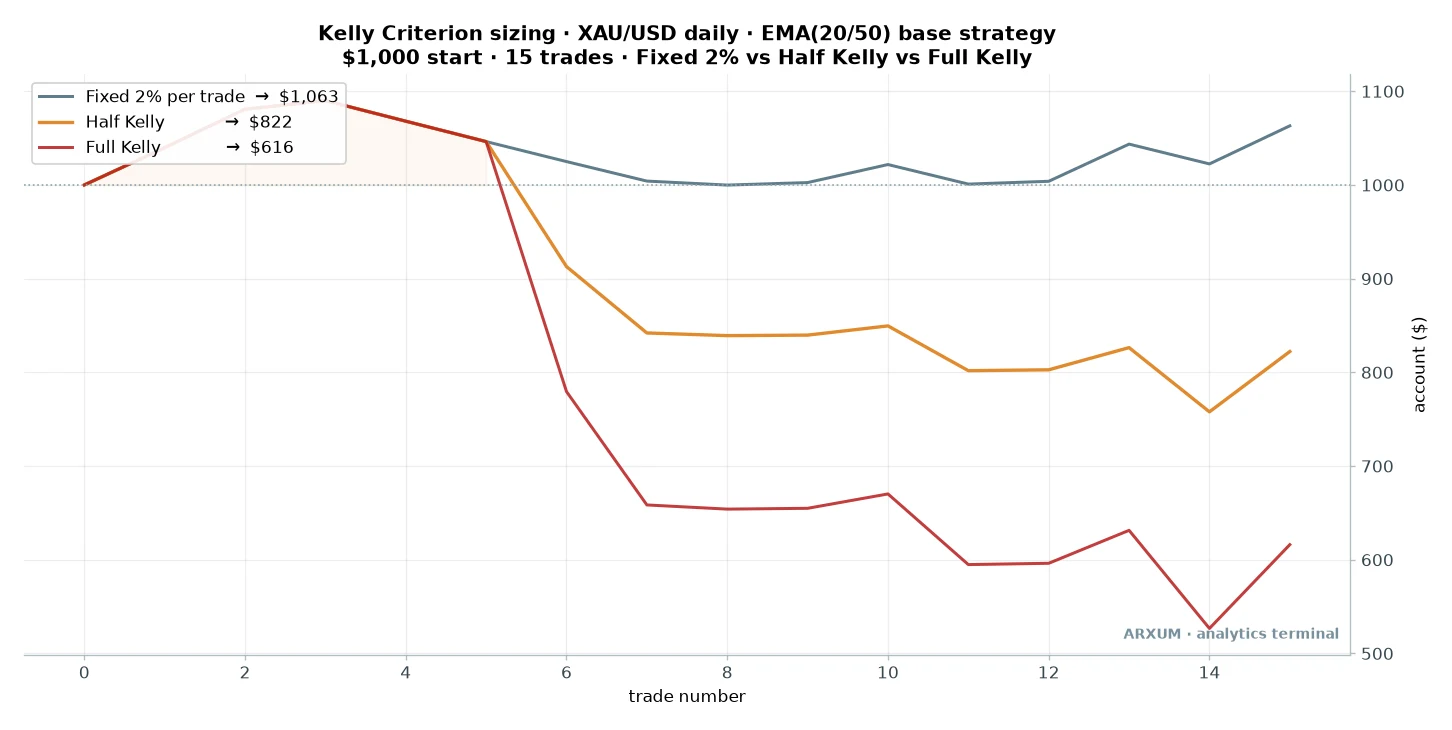
Now the experiment. Same fifteen trades, same entries and exits, three different sizing rules laid over the top.
Only the bet size changes.
| Sizing method | Final on $1,000 | Return | Max drawdown |
|---|---|---|---|
| Fixed 2% | $1,063 | +6% | −12% |
| Half Kelly | $822 | −18% | ~30% |
| Full Kelly (25% cap) | $616 | −38% | ~48% |
Look at that and sit with it. The strategy was profitable, and Kelly sizing turned it into a losing account.
Full Kelly did not just underperform. It lost 38% of the money and put the account through a near-50% drawdown to do it.
Half Kelly, the “safer” version, still lost 18%. The dull, flat 2% rule was the only one that finished ahead.
This is the opposite of what the formula promises. Optimal sizing is supposed to be the fast lane, not the ditch.
So we pulled the trades apart to see where it went wrong.
Why full Kelly blew up
Kelly re-estimates the bet size from your recent trades. Early on it has almost no data, so it starts with a flat 2% for the first few trades and then switches on.
The switch is where it broke. After five trades, three winners and two losers, Kelly did its sum.
- The win rate looked like 60% (three of five).
- The average winner looked about 1.5 times the average loser, so b came out near 1.48. That is below the 1:2 target the strategy aims for, because the 30-day rule often closes trades before they reach the full 2R, so the average winner is smaller than the target.
- Plug in: (1.48 × 0.60 − 0.40) ÷ 1.48 = 0.488 ÷ 1.48 = 0.329.
Kelly said stake 32.9% of the account on the next trade, and only our 25% safety cap held it back. A quarter of the account, on one gold trade.
That trade took a full stop. In a single loss, full Kelly gave back 25% of the account.
| Trade | Outcome | Fixed 2% bet | Full Kelly bet |
|---|---|---|---|
| 6th | full stop | 2% | 25% |
| 7th | full stop | 2% | 15% |
| 13th | 1:2 win | 2% | 3% |
| 15th | 1:2 win | 2% | 8% |
Read the bottom two rows, because they are the other half of the disaster. By the time the big 1:2 winners arrived, Kelly had shrunk the bet to 3% and 8%.
So it bet huge into a loser and tiny into the winners. It got the sizing exactly backwards, every time, and the reason is not bad luck.
Five trades is not a sample, it is a rumour. A 60% win rate measured over five trades can easily be a true 45% strategy on a hot streak, and Kelly cannot tell the difference.
It takes the noisy estimate literally and bets the account on it.
How many trades Kelly actually needs
This is the useful lesson, and it is a number. The Kelly fraction only converges toward the right size after a long run of trades, on the order of 50 to 100 or more.
Our gold strategy produced fifteen in eight years. At roughly two trades a year, you would need something like 25 years of daily gold before the estimate steadied.
By then the market has changed regime several times over, so the “true” win rate you are measuring no longer exists. The formula never gets the sample it needs.
The rule of thumb: the fewer trades you take, the more dangerous full Kelly is, because it is sizing off noise.
Kelly is not useless, though. It has a natural home, and it is the opposite of this strategy.
A fast, high-frequency system on the 1-hour or 15-minute chart can take 200 to 500 trades a year. There, the win rate and payoff estimates actually stabilise, and a fractional Kelly can genuinely help.
On a slow daily swing strategy, it is the wrong tool.
Half Kelly, and the sane way to use the formula
Serious Kelly users almost never bet full Kelly. They bet half, or a quarter, and the reason maps straight onto our numbers.
Full Kelly is the mathematically fastest growth only if your inputs are exactly right. Get the win rate a little too high, which small samples always do, and you are wildly oversized.
Half Kelly gives up a sliver of theoretical growth for a large cut in risk and drawdown. It is the version worth knowing.
But notice what our data showed. Even half Kelly lost 18% here, because halving a bet that is built on a five-trade rumour still leaves it far too big.
The honest takeaway: fractional Kelly is a real tool for high-frequency systems with hundreds of trades behind the estimate.
For everything slower, a flat percentage like 2% is not a compromise. It is the better rule.
The filters worth watching
While we had the strategy open, we checked what separated the good crosses from the coin-flips. Two things stood out, though both are watchlist hints here, not hard rules.
The first is trend strength, read with ADX, a gauge that runs from zero to about 60. Crosses that fired with ADX above 22, a genuine trend, all won in our sample.
The second is calm. Using average true range, a plain volatility gauge, the crosses that fired on quiet, low-range days beat the wild-day ones by roughly five to one.
Here is the catch, and it is why these are hints not rules. Each filter left only four or five trades in eight years, far too few to trust as a hard cutoff.
Use them as quality checks. When a cross lines up with a strong, calm trend, it deserves more of your attention. Just do not let a filter this thin talk you into betting bigger, because that is the exact mistake Kelly made.
What this costs you, and the discipline it needs
This strategy asks for patience more than nerve. Two trades a year means long stretches of nothing, and the edge is thin enough that one impatient oversized bet can undo a year of it.
That is really the whole article in one line. The sizing rule matters as much as the signal, and the temptation to press after a couple of wins is exactly what sinks the account.
A few concrete habits, tied to these numbers.
- Risk the same 2% every time. Do not size up after a loss to win it back, and do not size up after two wins out of euphoria. That instinct is home-made Kelly, and it fails the same way.
- Use a circuit-breaker. If you take three to six losses in a row, gold may have stopped trending. Pause and check that price is still making clean higher highs above the 200-day line before the next trade.
- Run a calm live-versus-data check. One bad month is just variance across only two trades a year, so do not panic-quit. A long, wide gap between your results and these numbers means the trend has faded, and this is not a range or bear-market strategy.
Gold is expensive, so on a small account the daily stops can size below one micro lot at an honest 2% risk. A micro lot is the smallest standard trade size at most brokers, 0.01 lots.
If that is you, practise on a demo or use a broker that offers fractional or cent-lot sizing, accounts that let you trade in even smaller increments, rather than stretching your risk to force the trade.
One more honest number. Simply buying and holding gold across these eight years returned far more on paper, well over 200%, against our 6%.
That is bull-market math, not a failing of the strategy. A timed long will always trail raw buy-and-hold in a historic one-way run.
What the strategy gave instead was a 12% worst drawdown against buy-and-hold’s roughly 27%, plus a rule for stepping aside if gold stops trending. You gave up raw return for a much calmer ride, and Kelly sizing threw that calm away.
Common mistakes with the Kelly criterion
- Betting full Kelly. It is only optimal if your inputs are perfect, and they never are. Full Kelly on noisy data is how the account in this study lost 38%.
- Estimating from a handful of trades. Five or ten trades cannot tell you your real win rate. Kelly believes the small sample and oversizes on it.
- Using it on a low-frequency strategy. A daily swing setup gives too few trades for the fraction to ever settle. Save Kelly for fast systems with hundreds of trades a year.
- Sizing up after a hot streak. This is Kelly by feel, and it fails for the same reason: a streak is not a new edge.
- Ignoring the drawdown. Full Kelly’s near-50% dip is unbearable in practice. Most people quit at the bottom, locking in the loss.
Where to go from here
The lesson here is not that the Kelly criterion is broken. It is that a sizing formula is only as good as the win rate and payoff you feed it, and most strategies never give it enough trades to trust.
If you take one thing away, size a slow strategy with a flat percentage, and save fractional Kelly for a fast one with a real trade count behind the estimate. Our position sizing guide walks through the flat-percentage method in full, and the risk/reward ratio guide covers the payoff number Kelly leans on.
Three configurations to lift straight off the page:
- Gold, daily, EMA 20/50 cross, fixed 2%. Long above the 200-day line, buy the cross, stop under the ten-day swing low, target twice the risk. Modest but real, and calm.
- The same strategy, quality-checked. Take the cross more seriously when ADX reads above 22 and the market is quiet, but keep the bet size flat.
- Kelly, but only for fast systems. If you run a 1-hour or 15-minute strategy with hundreds of trades a year, a half or quarter Kelly is worth testing. On anything slower, do not.
The bottom line: the optimal bet size is only optimal when the numbers behind it are solid. Feed Kelly a thin, slow strategy and it will happily size you into the ground.
FAQ
What is the Kelly criterion, in plain terms?
Does the Kelly criterion work for trading?
What is the Kelly criterion formula?
What is the difference between full Kelly and half Kelly?
Why did Kelly lose money in this test?
How many trades do you need for the Kelly criterion to be reliable?
Is there a Kelly criterion calculator?
Where does the Kelly criterion come from?
What should I size my trades by instead?
Does the Kelly criterion work in betting and blackjack?
What are the key terms in this guide?
Real-time trade setups with entry, stop loss and take profit. Daily market analysis. No subscription, no complicated theory.
🌍 Our recommended brokers


Reader Reviews
Be the first to review this — tell other traders what actually helped, or where it fell short.
Leave a Review

Quant Researcher & Systems Builder
Quantitative researcher who builds the automated systems behind Arxum strategy testing. Works in Python and Pine Script, using AI alongside classic backtesting to validate strategies on years of real data.
