What a Darvas Box looks like
A Darvas Box looks almost too simple to take seriously. Price goes quiet, drifts sideways inside a tight range, then pops out the top. You buy the pop. That is the entire idea, and my reaction to it was the same one I have to most “simple” strategies: nice story, prove it.
Here’s what it looks like on a Bitcoin chart:
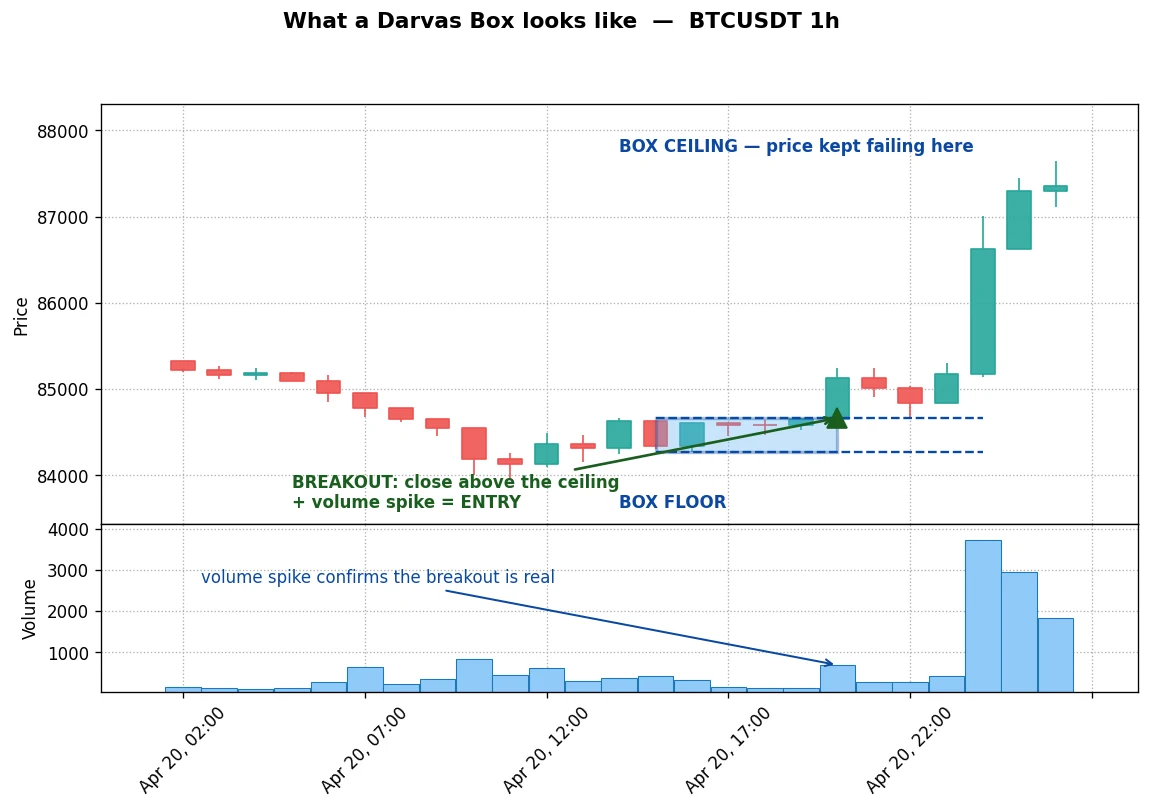
Look at the boxed area. Price kept bumping into the same ceiling and couldn’t get through. Then one candle closed cleanly above it, and the volume bars underneath jumped. That candle is the entry. The stop sits under the box, and from there you ride the move.
Easy to draw. The interesting question is whether it survives two years of candles, because most patterns this clean fall apart the second you put a number on them. So I ran the classic rules through a proper backtest on Bitcoin and let the numbers settle the argument.
The dancer who beat Wall Street
Nicolas Darvas wasn’t a trader by training. He was a professional ballroom dancer who, in the 1950s, turned a few thousand dollars into a reported two million, trading by telegram while touring the world, with no live charts and no news feed.
His edge wasn’t speed or information. It was a rule for ignoring noise. He noticed a stock would sit inside a range, his “box”, for a while, then break into a new range higher up. So he bought breakouts, put a stop under the box, and rode the trend box by box until it stalled.
Seventy years later the same shape still draws itself on a Bitcoin chart. The only thing that’s changed is that I can measure whether it pays instead of taking a dancer’s word for it.
What a Darvas Box actually is
A Darvas Box is just a consolidation with a clear ceiling and floor:
- Ceiling: a high that price fails to beat for several bars in a row.
- Floor: the lowest low sitting underneath that ceiling.
- The box: the rectangle between them, where buyers and sellers are roughly balanced.
Those two edges are really just short-term support and resistance, drawn tight. While price is stuck in the box, nobody’s in control. The moment it closes firmly above the ceiling, buyers have won that round, and that’s often the start of a fresh leg up.
To spot one on your own chart, look for a tight sideways patch of five or more candles where the highs stop making progress. Draw a line across the top and another across the bottom. That rectangle is your box. Now you wait for one event: a close above the top.
The rules, step by step
I coded it strictly and mechanically, because a strategy you can argue with after the fact isn’t a strategy, it’s a horoscope:
- Box ceiling: the highest high not beaten for 5 bars.
- Box floor: the lowest low underneath that ceiling.
- Entry: buy when price closes above the ceiling.
- Initial stop: the box floor. The gap from your entry down to that floor is your risk, the “1” in every risk/reward figure in this article. Written as a ratio, 1:X, the 1 is what you put at stake and the X is the reward. A full stop-out loses that 1; a trade that runs twenty times that distance is a 1:20 winner.
- Trailing: as each new, higher box forms, move the stop up to its floor, a trailing stop that only ratchets upward, never down.
- Exit: when the trailing stop gets hit. No fixed target, because winners need room to run.
- Direction: long only. Every trade here is a buy that profits when price rises; I never short, the bet that price falls, and I explain why near the end.
- Costs: 0.1% in fees on every trade, charged on the way in and the way out.
That’s the whole system. Now the part the hype videos skip.
The raw result: an honest letdown
Here’s what those rules produced in a backtest on Bitcoin’s 1-hour chart over two years, with no filter, taking every breakout:
| Metric | Raw Darvas (long) |
|---|---|
| Trades | 507 |
| Win rate | 36.9% |
| Avg win vs avg loss | 2.28 to 1 |
| Expectancy per trade | +0.155% |
| Profit factor | 1.33 |
Two definitions, since they carry the rest of this article: expectancy is the average profit per trade once the wins and losses cancel out, and profit factor is total winnings divided by total losses, so anything above 1.0 is profitable (a whole-strategy score, not the per-trade 1:X risk/reward on the charts; the two answer different questions). The “avg win vs avg loss” row is just a ratio: at 2.28 to 1, the average winner is a bit over twice the size of the average loser.
It’s barely positive, and “barely positive” is a polite way of saying “a coin flip in a nicer suit.” A 37% win rate is hard to sit through, and +0.155% per trade is thin enough that slippage could eat most of it.
Why so weak? Because with no filter the strategy buys every breakout, including the dozens of limp ones that nudge over the line on no participation and roll straight back. I needed a way to tell a breakout that means it from one that’s just stretching its legs.
The fix: one volume rule
Here’s a pattern I keep running into: bolt a volume filter onto almost any momentum strategy and the win rate climbs by something like 8 to 15 percent. The Darvas Box didn’t argue.
The idea is old and a little boring, which is usually a good sign. A breakout that matters is crowded, with plenty of buyers hitting the button at once. A fake one drifts across the line on thin air. So I added one condition:
The one rule: only take the breakout if the breakout bar’s volume is at least 1.5 times its 20-bar average.
Same boxes, same entries, same stops. I just skip the quiet breakouts. The change is hard to ignore:
| Metric | Raw Darvas | With volume filter |
|---|---|---|
| Trades | 507 | 132 |
| Win rate | 36.9% | 45.5% |
| Avg win vs avg loss | 2.28 to 1 | 2.51 to 1 |
| Expectancy per trade | +0.155% | +0.435% |
| Profit factor | 1.33 | 2.09 |
One rule nearly tripled the per-trade edge and pushed the profit factor above 2.0. You trade a third as often, and each trade is worth far more. I’ll take that trade-off every time.
Proof it’s the volume, not luck
If the filter is doing something real, the breakouts it threw away should be clearly worse. They are:
| Group | Trades | Expectancy |
|---|---|---|
| Volume 1.5x or higher (taken) | 132 | +0.435% |
| Volume under 1.5x (skipped) | 375 | +0.057% |
The breakouts I skipped were basically break-even. So this isn’t curve-fitting, it’s the filter doing its one job: separating conviction from noise.
A winning trade, start to finish
Here’s one of those trades on Bitcoin, from the box to the exit.
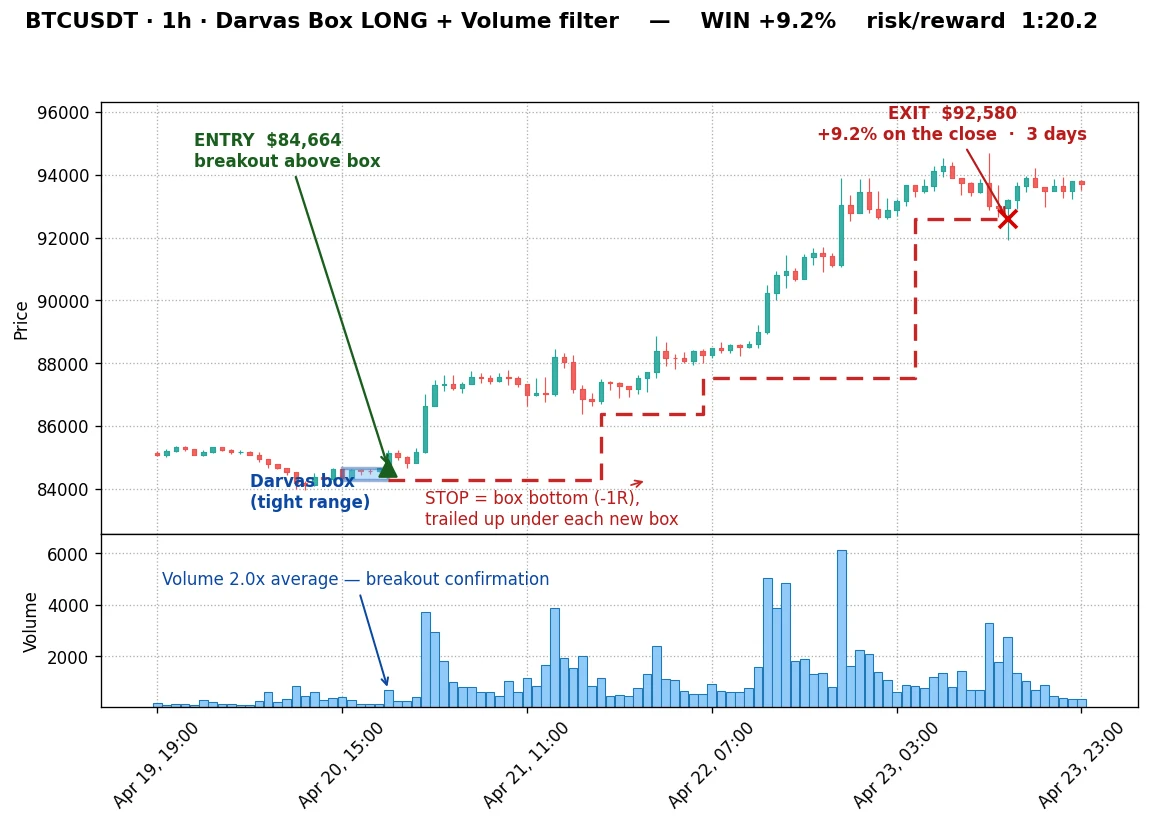
On 20 April 2025, Bitcoin had gone quiet in a tight 6-bar box near $84,600, then punched through the ceiling on volume twice its average. Exactly the kind of breakout the filter is built for.
- Entry: $84,664, on the close above the box.
- Initial stop: the box floor, your 1, the risk.
- The tell: the volume spike, buyers stepping in rather than a drift over the line.
What followed was textbook Darvas. Price built one higher box after another, and the stop ratcheted up under each new floor (those red dotted steps). No guessing the top, no taking profit early, just holding until the trailing stop finally clipped the position at $92,580, a 1:20.2 winner over about three days.
One trade like that quietly pays for a long line of small losers, which is the entire reason a sub-50% win rate still ends up ahead.
Two more winners: the pattern repeats
One big trade is an anecdote. Here are two more, months apart, behaving identically.
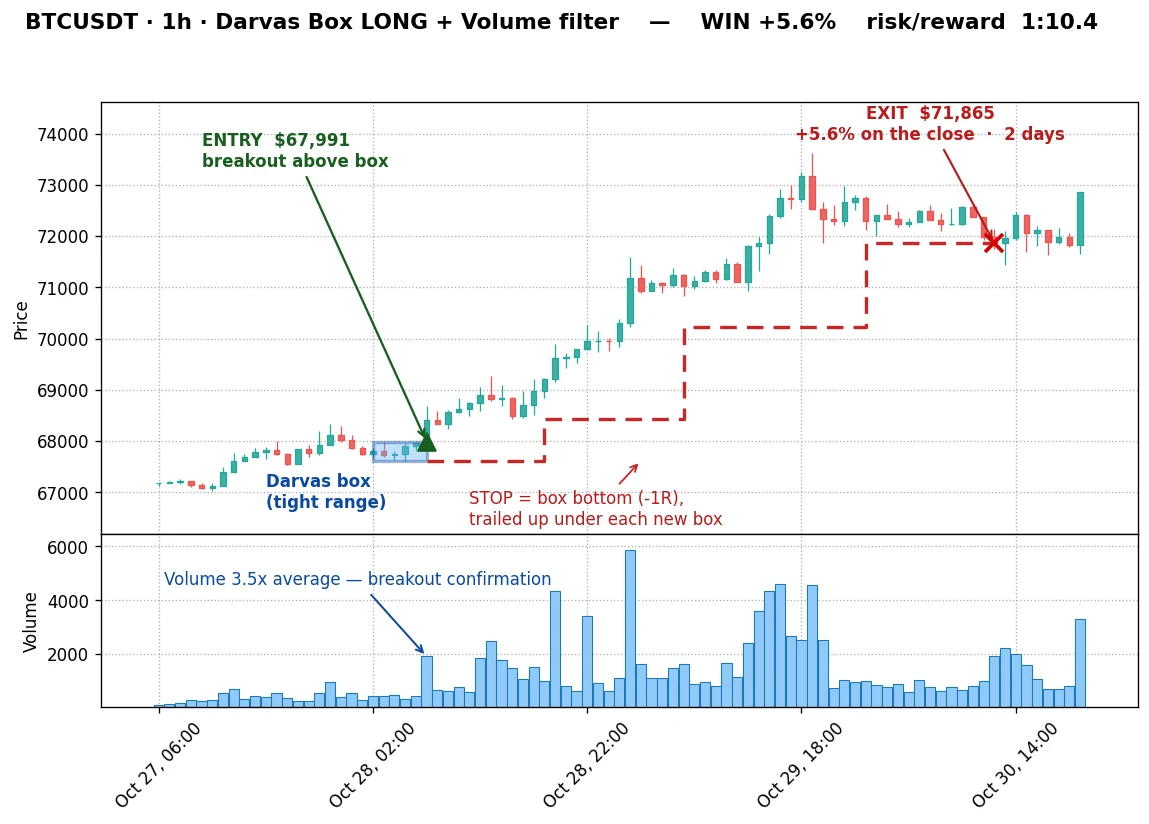
28 October 2024, 1:10.4. A box near $68,000 broke out on an even louder surge, 3.5 times average volume. The trend ran for a bit over two days before the trailing stop stepped in at $71,865. Notice the recurring theme: the fattest winners showed up on the fattest volume spikes.
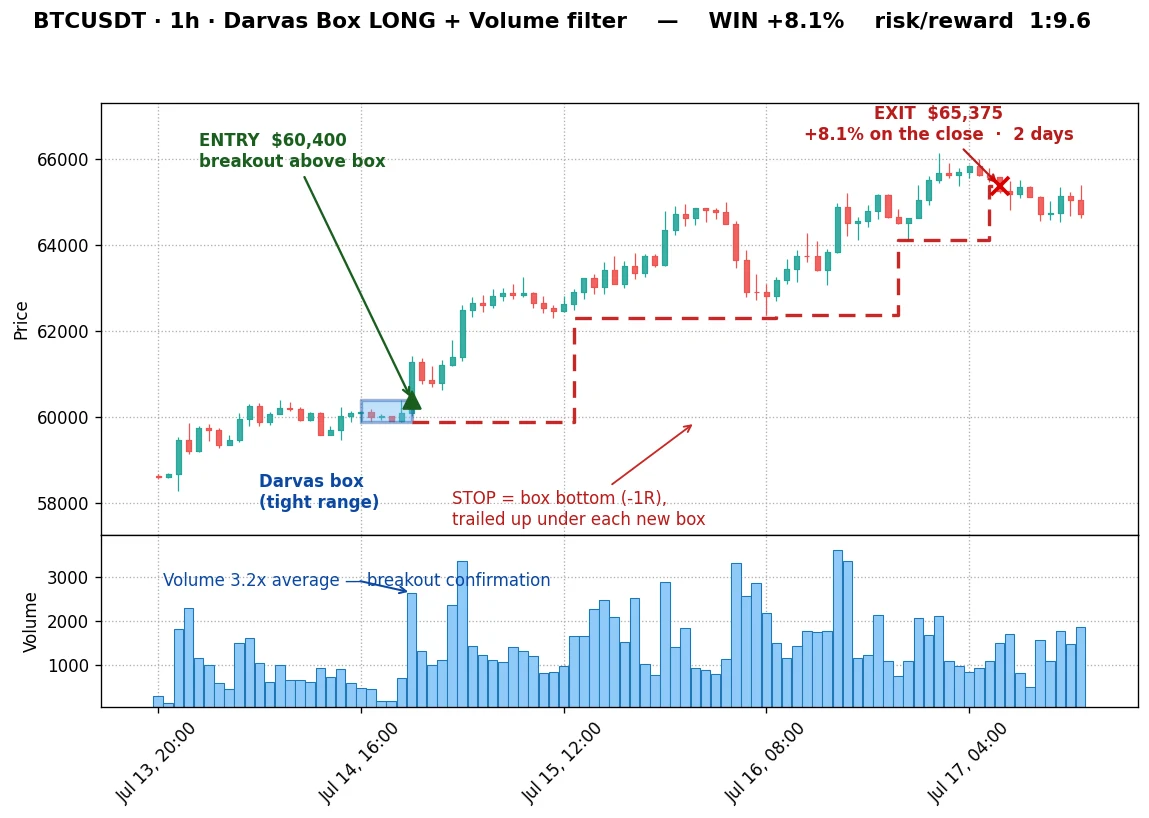
14 July 2024, 1:9.6. Entry at $60,400 on 3.2 times volume, out at $65,375 after about two days. Same machine, same behaviour.
Three trades at 1:20.2, 1:10.4 and 1:9.6, and you’re already looking at most of the two-year profit. A handful of big winners do most of the heavy lifting.
Lose them and the headline return shrinks a lot. But as I test further down, the edge itself doesn’t vanish.
When it fails, and why I’m showing you
I’m not in the business of showing only the pretty ones. Here are two that didn’t work.
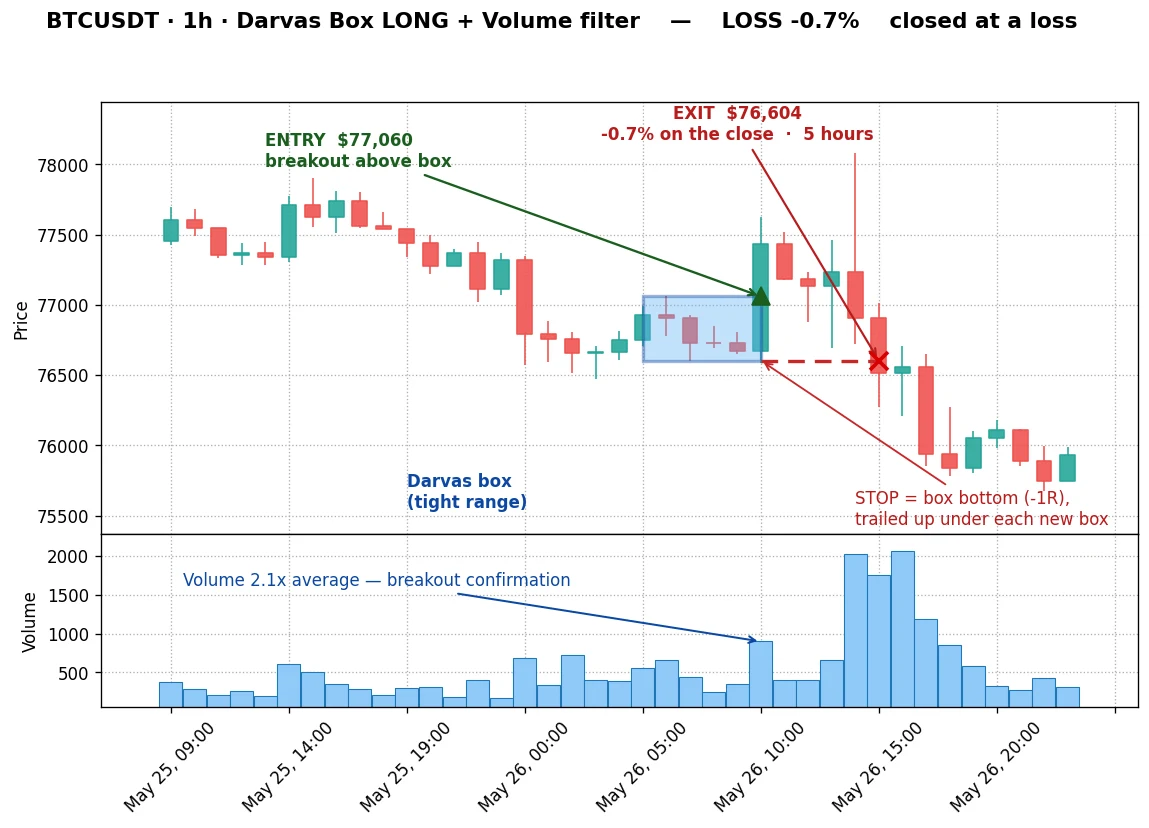
26 May 2026, a full stop. This breakout from the $77,000 box even had 2.1 times volume, so it cleared the filter cleanly. The position went in, price stalled, rolled over, and hit the stop about five hours later.
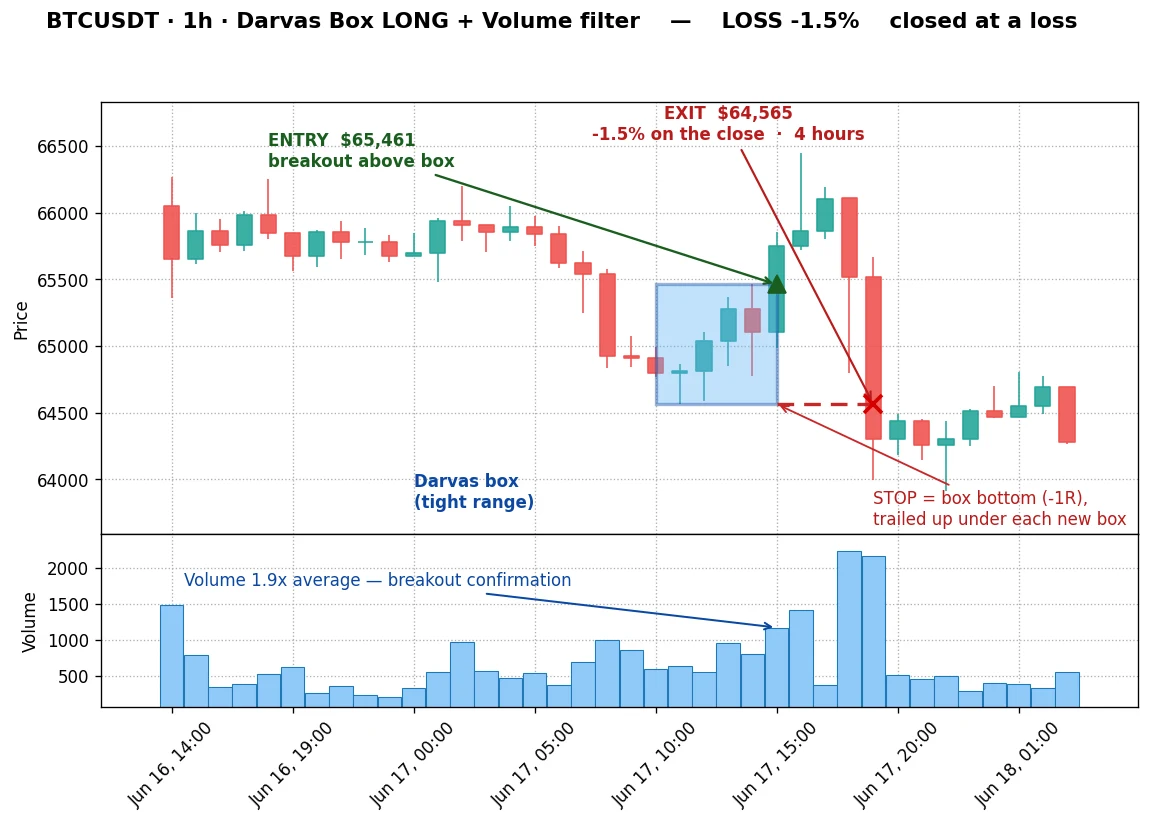
17 June 2026. Same story, a qualifying breakout that simply refused to follow through, stopped out within four hours.
Here’s the honest part: a filter improves your odds, it doesn’t hand you certainty. A 45% win rate means you lose more often than you win. The math only works because of the shape of the outcomes:
- Losers stay capped near the 1 you risked, held there by the box-floor stop (both above lost exactly that).
- Winners are open-ended, and the trailing stop lets them run to 1:9, 1:10, even 1:20.
You’re not trying to be right. You’re trying to be small when you’re wrong and big when you’re right. The Darvas structure does that for you, which is the part I genuinely respect about it.
The upgrade that didn’t work
This is the bit where I expected to look clever. The logic seemed airtight: only take long breakouts when the bigger trend is already up, with price above its 200-period moving average. Trade with the wind, not against it.
| Variant | Trades | Win rate | Expectancy | Profit factor |
|---|---|---|---|---|
| Volume only | 132 | 45.5% | +0.435% | 2.09 |
| Volume plus uptrend filter | 87 | 43.7% | +0.41% | 1.95 |
| Volume, against the trend | 45 | 48.9% | +0.48% | 2.46 |
The trend filter didn’t help. It cut the trade count by a third and the edge slipped.
And before you read that bottom row as a win: yes, the counter-trend variant posts the best numbers, but it’s only 45 trades against the volume-only version’s 132, far too thin to trust. Those are mostly the sharp snapbacks Bitcoin loves after a fast fall, and I’m not building a strategy on a sample that small.
The lesson is the useful part, and one I keep relearning: the volume filter was already doing the work. Stacking another rule on top just added complexity and threw away good trades.
The market doesn’t reward effort for its own sake. The best version of this is the plain one, boxes plus a volume spike, and I’ve stopped apologising for how simple that is.
Which timeframe actually works
I didn’t just assume the 1-hour chart. I checked three:
| Timeframe | Trades | Win rate | Expectancy | Verdict |
|---|---|---|---|---|
| 15-minute | 551 | 41.6% | +0.171% | Too noisy, the edge shrinks |
| 1-hour | 132 | 45.5% | +0.435% | The sweet spot |
| 4-hour | 4 | 75% | +1.356% | Too few signals to trust |
- 15-minute hands you plenty of trades and a thinner edge. Lower timeframes are a fakeout farm, and even volume can’t fully weed them out.
- 4-hour looks glorious at +1.356%, right up until you notice it’s four trades in two years. Four trades tells you nothing, so I won’t pretend it does.
- 1-hour is the balance: a genuine edge and enough trades to mean something.
Trade it on the 1-hour chart.
Does the edge survive beyond Bitcoin?
One asset proves nothing. A pattern that only works on Bitcoin over one bull market is a story, not an edge.
So I ran the exact same rules, boxes plus the volume filter, on EUR/USD and on gold, over the same two years. I scaled one thing per market: what counts as a “tight” box, since a quiet five hours on EUR/USD spans a fraction of what it does on Bitcoin.
| Market | Raw expectancy | With volume filter | Win rate | Profit factor |
|---|---|---|---|---|
| Bitcoin, 1h | +0.155% | +0.435% | 45.5% | 2.09 |
| EUR/USD, 1h | +0.041% | +0.158% | 46.8% | 3.25 |
| Gold, 1h | +0.248% | +0.439% | 58.1% | 3.78 |
The shape holds. On EUR/USD the raw rules are almost dead money, and the volume filter roughly quadruples the per-trade edge while the breakouts it throws away stay near break-even, the same tell I saw on Bitcoin. Gold barely needed the help, because it trended so hard over these two years that even weak breakouts paid, but the filter still lifted the win rate to nearly six in ten.
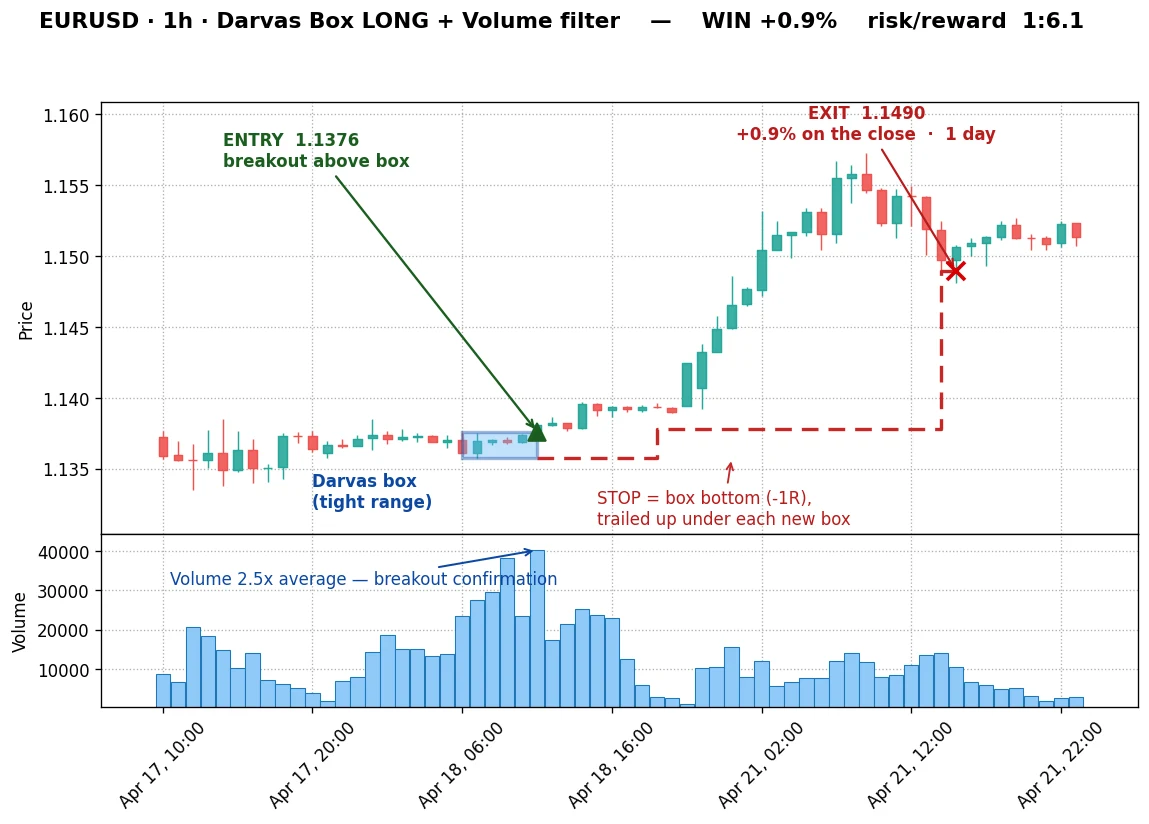
It’s the same box-then-pop you already know, just on different markets. Take EUR/USD on 18 April 2025: price went quiet in a tight box near 1.1376, then broke higher on volume two and a half times its average.
From there the stop trailed up box by box for about a day, until it clipped the trade at 1.1490, a 1:6.1 winner. That is a move of about 114 pips, the unit currency traders count moves in, and the same shape Bitcoin produced, at a calmer scale.
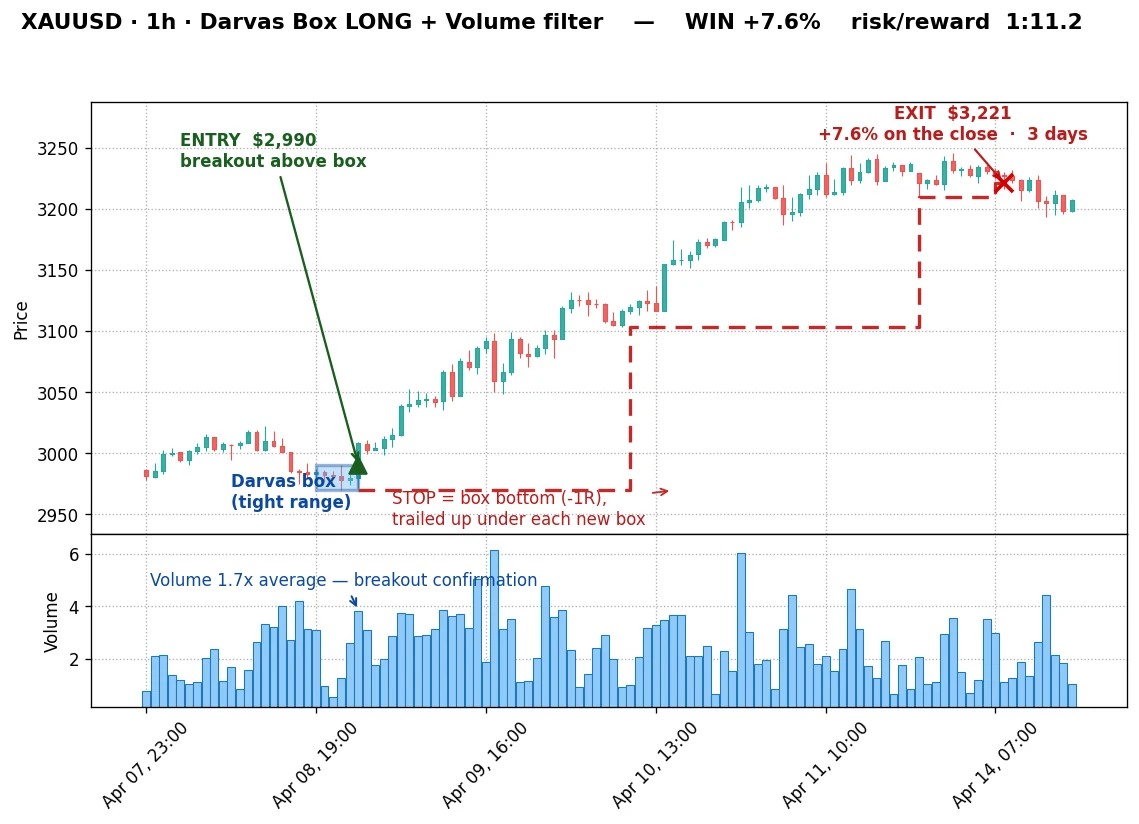
Gold is the louder story, because it spent these two years going almost straight up, which is exactly the market this strategy is built for. On 9 April 2025, price coiled into a box near $2,990 and broke out on volume about 1.7 times its average. The stop ratcheted up under each new box and the trade ran to $3,221 over the next three days, a 1:11.2 winner.
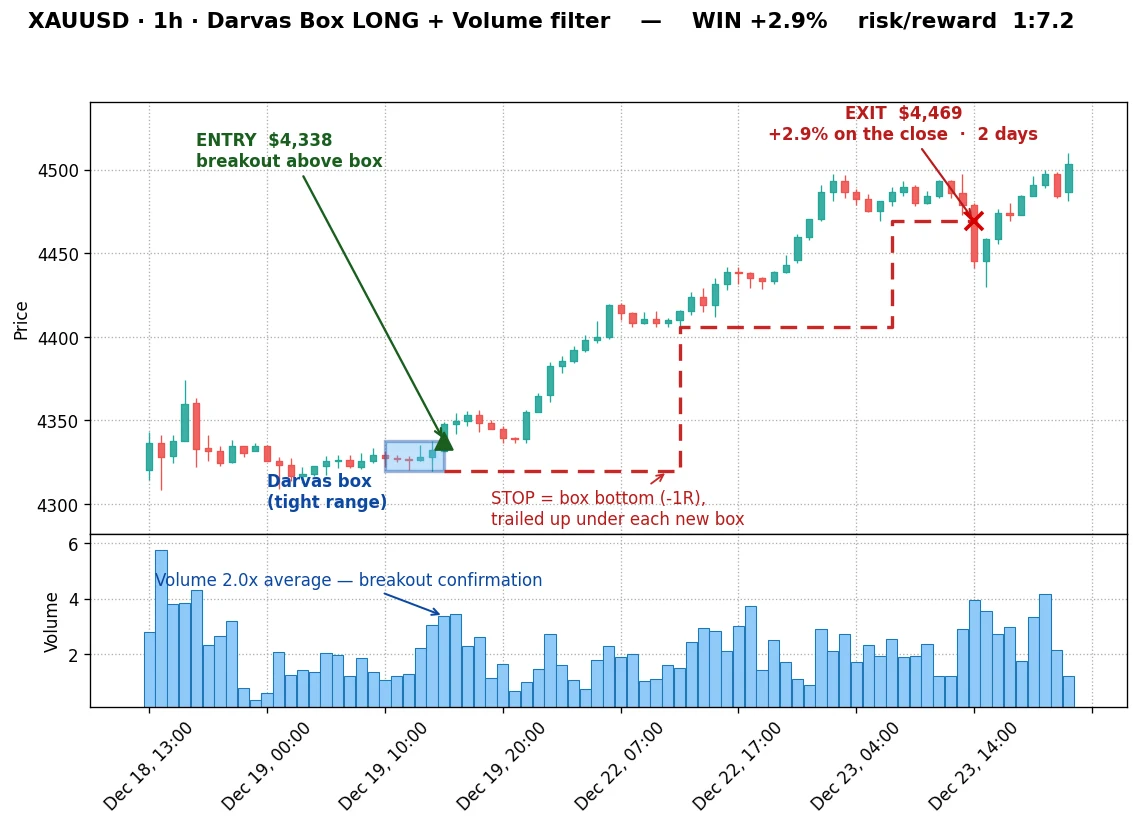
And it wasn’t a fluke of one breakout. Later that same year, on 19 December 2025, the same setup near $4,338 broke on double volume and trailed up for about two days to $4,469, another 1:7.2 winner.
In a market trending this hard, the boxes keep stacking one on top of the last, and the trailing stop quietly banks each leg. That is the whole reason this old, simple pattern is having a moment again: it does its best work in exactly the kind of run gold has been on.
There’s one honest wrinkle worth saying out loud: Forex has no real volume. It’s a decentralised market with no single tape, so what you get from any feed is tick volume, a count of how often the price updated, not how much money changed hands.
It’s a proxy for how busy the market was. And the proxy still works: a burst of ticks at the breakout separates the real moves from the limp ones, just like true volume does on Bitcoin.
And one thing flipped. On Bitcoin the higher-timeframe trend filter made things worse. On EUR/USD and gold it helped, nudging both expectancy and win rate up. I’m not going to dress that up into a universal rule. Different markets, different behaviour, and anyone selling you one setting that rules them all hasn’t tested on more than one.
What this looks like in practice
Percentages stay abstract, so picture the shape of a typical run with the volume-filtered version:
- Roughly 55 trades in 100 lose, each costing about the 1 you risked (say 1% of the account).
- The other 45 win, most of them small to medium.
- A few run huge: 1:9, 1:10, 1:20. On a 1% risk plan, a 1:20 trade adds about 20% from a single position.
Across the full two years and 132 trades, the combined result came to +57.5%, and a fat slice of it came from the three trades up above.
This isn’t a strategy that drips out steady gains. It bleeds slowly through small losers, then makes it all back, and more, in a handful of trends. If you can’t sit through the bleed, you won’t be around for the payoff, and it will feel broken right up until the moment it isn’t.
That “rests on a few big trades” worry is exactly the test I’d run on anyone else’s numbers, so I ran it on these. The average edge was +0.435% per trade, so:
- Drop the single best trade: it barely moves, down to +0.371%.
- Drop the three biggest winners entirely: still +0.271% across the other 129 trades, clearly positive.
- Worst drawdown: only about 7% from peak to trough over the whole two years.
The big trends pad the result, they don’t prop it up. A shallow drawdown plus an edge that survives losing its best trades is the line between something real that trends amplify and a fluke resting on a couple of lucky candles.
Common beginner mistakes
- Taking every breakout. Without the volume rule you’re back at +0.155%, the noise zone. The filter is the edge.
- Loosening your stop. The stop only ever moves up, under new boxes. Widening it to “give the trade room” turns a clean 1-unit loss into a five-unit disaster.
- Setting a fixed take-profit. A target at 1:2 would have cut every one of those 1:10 and 1:20 winners short, and those winners are the whole edge.
- Dropping to 5-minute or 1-minute. Lower timeframes feel exciting and quietly hand your edge to the spread and the fakeouts.
- Over-filtering. As I just showed, bolting on a trend filter made it worse. Resist the urge to improve a rule that already works.
Honest scope: read this before you trade it
Every number here comes from one backtest on a single window of history. Here’s exactly what it does and doesn’t cover:
- Asset: tested on Bitcoin, EUR/USD and gold, all on the 1-hour chart. The edge held on all three, though remember Forex volume is only a tick-count proxy. Other markets and timeframes are still untested ground.
- Period: June 2024 to June 2026, one market cycle. A single window can flatter anything.
- Direction: long only. This window trended up, so longs had the wind behind them. Short breakouts are a separate question, historically weaker for this pattern, and I’m not going to hand you numbers I haven’t earned.
- Execution: entries are modeled at the breakout level with 0.1% fees. Real fills on thin breakouts can be worse.
- This is education, not advice. Past results aren’t future ones, and anyone who tells you otherwise is selling something.
How to trade it, in five steps
- Mark the boxes. On a 1-hour chart, find tight ranges where the high holds for about five bars. Draw the ceiling and floor.
- Wait for the volume. Only take the breakout if the breakout bar’s volume is clearly above its 20-bar average (around 1.5 times or more). Most charting tools show this the moment you add a volume moving average set to 20. This one habit is most of the edge.
- Stop under the box. This is where position sizing earns its keep: risk a small, fixed slice of your account to the box-floor distance. Quick example: on a $500 account risking 1%, you have $5 at stake. If the box floor sits about 2% below your entry, you’d buy roughly $250 of Bitcoin, so a stop-out costs about $5, which is your 1, the risk.
- Trail, don’t predict. Move the stop up under each new box. Let the trade decide when it’s over.
- Expect to lose often. A win rate under 50% is normal here. On a loser, your only job is to keep it near that 1.
Where to go from here
Want to put this through its paces yourself? Open a free demo account on TradingView or any major exchange, mark a week of 1-hour Darvas boxes, and take only the ones with a clear volume spike. Track your results as risk/reward, the 1:X on each trade, not dollars, for 20 trades. That’s how you find out whether a strategy fits you before a cent is on the line.
FAQ
Does the Darvas Box work on crypto?
Does it work on Forex or gold?
What's the win rate?
Should I add a trend filter or more indicators?
Why long only?
What timeframe is best?
How many trades will this give me?
What's the difference between a Darvas Box and a normal breakout?
Can I trade it without volume data?
Does it work in a sideways or falling market?
How many losses in a row should I expect?
Can I automate it?
What do the key terms mean?
🌍 Our recommended brokers
Reader Reviews
Be the first to review this — tell other traders what actually helped, or where it fell short.
Leave a Review

Quant Researcher & Systems Builder
Quantitative researcher who builds the automated systems behind Arxum strategy testing. Works in Python and Pine Script, using AI alongside classic backtesting to validate strategies on years of real data.