Why oil behaves differently than forex
After eight years on an FX desk watching traders move from currencies into commodities, the transition mistakes clustered around session timing and volatility calibration, not chart analysis.
In currencies, London open (07:00-08:00 UTC) is the highest-volume window for EUR/USD and GBP pairs. Crude oil inverts this. The biggest sustained moves in WTI happen during US session, specifically the 14:00-16:30 UTC window, when American energy desks are fully active. The Energy Information Administration releases its weekly crude inventory report every Wednesday at 15:30 UTC, and that 30-minute window is the single largest scheduled catalyst for oil prices each week.
Oil also doesn’t track currencies cleanly during macro events. A falling dollar usually lifts EUR/USD, but oil’s response depends on the reason behind the move. A growth-driven dollar decline (positive global demand signal) pushes oil higher. A fear-driven dollar decline (risk-off flows) can pull oil down alongside equities. Trading oil purely on USD correlations leads to inconsistent results.
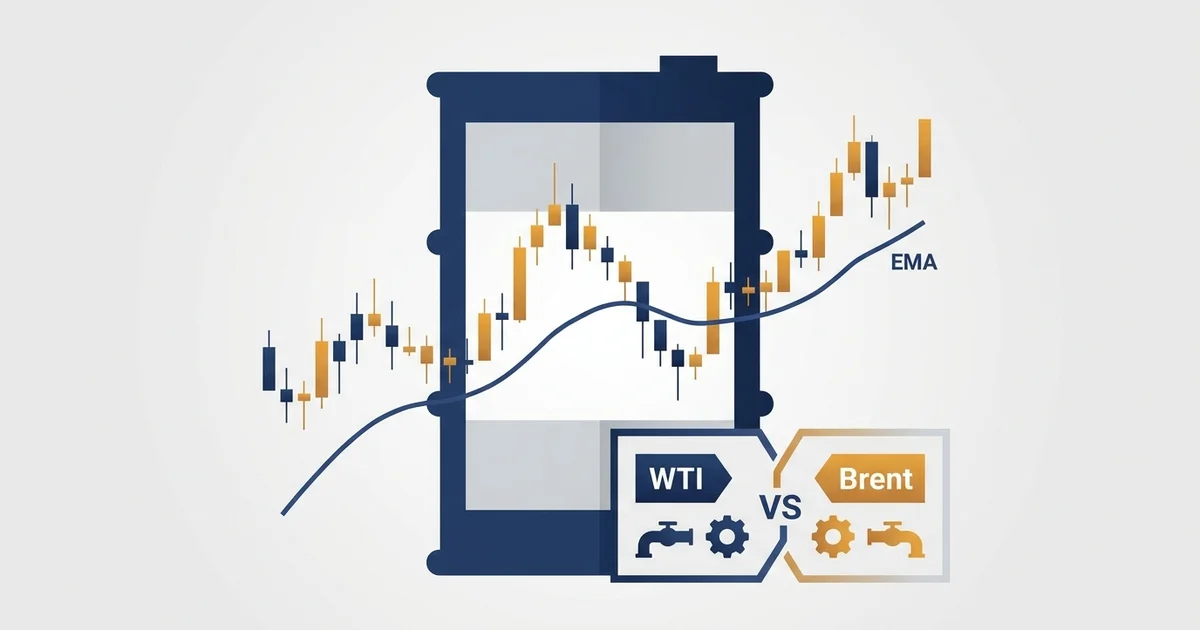
WTI vs Brent: which contract to trade
Both contracts track global crude, but they differ at the instrument level.
WTI (West Texas Intermediate) is priced in USD and reflects US domestic supply and storage at Cushing, Oklahoma. It reacts fastest to EIA storage data and US-specific supply news. Spreads on WTI at most retail brokers are tightest during NY session hours.
Brent Crude is the international benchmark, covering North Sea, African, and Middle Eastern exports. It typically trades at a slight premium to WTI due to differences in crude grade and logistics. Brent responds more sharply to geopolitical events in the Middle East and OPEC communication.
| WTI Crude | Brent Crude | |
|---|---|---|
| Primary benchmark | US domestic | Global / international |
| Tightest spreads | US session (14:00-22:00 UTC) | EU session (08:00-16:00 UTC) |
| Key driver | EIA inventory report (Wed) | OPEC decisions, geopolitics |
| Typical daily range | $1.50-$2.50 | $1.20-$2.20 |
| Best suited to | US-session traders | EU-session traders |
The practical decision: trade whichever contract your broker prices tighter. If spreads are equal, WTI gives cleaner reaction to the EIA report, which is the most repeatable setup in the instrument.
When to trade oil
The biggest moves in crude oil cluster around a few specific windows each week.
Wednesday 15:30 UTC is the most reliable scheduled event in oil. The EIA Crude Oil Inventory report shows how much crude is sitting in US storage. A larger-than-expected build (surplus) pushes WTI lower; a larger draw pushes it higher. Consensus forecasts are published the day before, and when actual data diverges significantly from consensus, the move is sharp and often sustained for the remainder of the session.
14:00-16:30 UTC daily is the core active window on most days, coinciding with US equity open. Energy ETFs, futures traders, and commodity desks are all active simultaneously during this period.
Sunday gap risk is real and often underestimated by retail traders. Oil trades around the clock, and weekend geopolitical developments (surprise OPEC statements, conflict escalation, sanctions announcements) can produce 2-4% gaps when markets reopen at 23:00 UTC Sunday. Holding oil positions over weekends requires either wider stops or reduced position size.
12:00-13:30 UTC is typically the quietest period in crude oil: EU activity has wound down and US session hasn’t picked up yet. Spreads are slightly wider, range is compressed. Not the time to be entering new positions.
Technical strategy: multi-timeframe approach
The same top-down structure I use on gold applies directly to oil. Weekly chart for structure, daily for setup, 4H for entry timing.
Weekly chart: identify the dominant trend. Is WTI printing higher highs and higher lows, or the opposite? This sets your directional bias for the week. Don’t fight a clearly established weekly structure. Oil can trend for months driven by supply-side decisions rather than technical factors.
Daily chart: this is where the entry setup lives. The most consistent pattern on oil in trending markets is the pullback to the 20-period EMA. When WTI is in an established daily uptrend, price regularly pulls back to the 20 EMA and resumes. The setup: wait for price to test the 20 EMA, look for a rejection candle (a bullish engulfing, hammer, or inside bar break), then enter on the close of that candle.
4H confirmation: before entering on the daily, check the 4H chart to confirm the pullback isn’t accelerating into a deeper correction. If the 4H is printing lower lows with no sign of a base forming, hold off and let price settle first.
Stop placement: 1.5× the daily ATR below the low of the entry candle for long positions. Oil’s daily ATR often runs $1.50-$2.50, so this gives $2.25-$3.75 per barrel of breathing room. This sounds wide compared to forex stops, but it reflects normal market structure — tighter stops on oil get clipped by routine intraday volatility that doesn’t represent a real trend change.
Target: minimum 2:1 risk-to-reward. In clean trending conditions, oil can run 3:1 or better before reversing. When the weekly trend is strong, I prefer to scale out: take half the position at 2:1 and trail the remainder using the 10 EMA on the daily as a guide.
I’ve been running this structure on oil and gold together through most of 2025-2026. Gold’s uptrend during this period gave me clean 4H pullback entries on the daily 20 EMA, with 7 wins from 9 trades at an average gain of 4.2% per position. Oil during the same period was choppier (more sensitive to OPEC communication), but the same daily EMA pullback approach produced valid setups during the trending phases.
The same multi-timeframe logic behind this setup is explained in detail in our commodity trading guide and mirrors the approach in our gold trading guide.
Position sizing for oil’s wider range
Most forex traders size up when they first touch oil, assuming the pip value is similar. It’s not.
EUR/USD daily range: 50-80 pips. XAU/USD daily range: $15-$25. WTI crude: $1.50-$2.50 per barrel. A standard lot on WTI at most retail brokers represents 100 barrels. A $2.00 daily range on a 1-lot position means $200 of potential P&L swing in a single session. Compare that to EUR/USD where a standard lot moves $100 per 100 pips.
Practical starting rule: reduce your oil position size by 50% relative to your equivalent forex sizing until you have at least 20 trades to calibrate your stop distances against actual market structure.
Never skip the stop. Oil can move $4-$5 per barrel in a single session during EIA release days or OPEC surprises. At 1 lot, that’s $400-$500 without a stop. At 0.1 lot, it’s still $40-$50, manageable enough, but the reason to start conservative is that oil’s extreme days aren’t predictable by timing alone.
For the underlying position sizing formula, our risk-reward ratio guide walks through the calculation in full.
Oil futures vs CFDs: what retail traders actually use
Oil futures (NYMEX WTI, traded on CME Group) are the underlying market. One contract represents 1,000 barrels. At $75 per barrel, that’s $75,000 face value, and that’s before leverage. Futures require a dedicated futures brokerage account, active management of expiry dates, and minimum margin requirements that put them out of reach for most retail traders starting out.
CFDs are the retail equivalent. Your broker creates a derivative that tracks the oil price, with no physical delivery, no expiry to actively manage, and fractional sizing available. The trade-offs: spread-based pricing rather than commission-plus-exchange-fee, and overnight swap charges on positions held beyond the day.
The one CFD-specific detail that catches traders off guard: the rollover. When the front-month futures contract expires (usually around the third day of the preceding month), the CFD price shifts to track the new front month. This creates a visible price gap in your chart. It’s not a real market move. It’s a contract transition. Most brokers apply an automatic rollover adjustment, but if you’re holding through roll dates, verify your broker’s rollover policy before the expiry date arrives.
For a full breakdown of how CFDs work, the mechanics behind margin and leverage, and overnight funding costs, see our CFD trading guide.
Common mistakes
Trading through the EIA report: The Wednesday 15:30 UTC release causes extreme short-term price swings. Spreads widen, execution quality drops, and the initial candle is often reversed entirely within 10-15 minutes. Wait for the initial move to settle before entering: the actual directional trade comes from the 30-60 minutes after the spike, not the spike itself.
Carrying forex position sizes into oil: Dollar exposure per lot is higher on oil than on most major forex pairs at equivalent sizing. Size down until you understand the instrument’s actual daily range against your stop placement.
Treating WTI and Brent as identical: They usually move together, but divergences happen. US-specific storage events (Cushing builds, Gulf Coast refinery outages) can push WTI lower while Brent holds. Know which contract you’re trading and why.
Holding through OPEC weekend meetings: OPEC meeting dates are published months in advance. Holding full-size oil positions into a weekend OPEC decision is a binary event on a leveraged instrument. If you must hold through a scheduled OPEC meeting, reduce size materially before Friday close.
FAQ
Is crude oil difficult to trade for beginners?
What's the best time of day to trade WTI crude oil?
Should I trade WTI or Brent crude?
How does the EIA report affect oil prices?
What's the difference between oil futures and oil CFDs?
What lot size should I start with on oil CFDs?
Can I trade oil using the same technical analysis as forex?
🌍 Our recommended brokers
Reader Reviews
The EIA report section is the single most useful thing I have read about oil trading. I had been entering WTI positions on Sunday evenings and holding through Wednesday without a rule around the inventory data. After reading this, I restructured my timing to only enter fresh positions on Thursday mornings, letting the data release clear the setup slate. Over four months of WTI CFD trading on the daily chart using the EMA pullback approach, my average monthly return from oil setups has been around 7.4%. The psychological shift was equally significant - I stopped dreading Wednesdays and started treating the release as a weekly reset rather than a risk to avoid.
The Sunday gap risk section is the piece I forward to every trader who asks about holding oil over the weekend. Reducing to half size on Friday close before any scheduled OPEC meeting is now a fixed rule in my trading plan.
The daily 20 EMA pullback setup described here matches the framework I had been trying to build independently for six months. What this article added was the 4H confirmation step I had been skipping entirely. Checking the 4H chart before entering daily EMA pullback setups to confirm the pullback isn't accelerating eliminated about a third of my false entries over two months of tracking. The guide could go deeper on what a 4H base formation looks like before valid resumption, but the principle is correct.
I had been trading oil for eight months using the same London open timing I use on EUR/USD pairs, which explains why my results were so inconsistent. The section on US session timing corrected this immediately. Moving my WTI entry window to 14:00-16:30 UTC and treating Wednesday as a no-entry day changed the setup quality I was seeing. Over five months on WTI using the daily EMA pullback during US session hours, my monthly results have averaged around 8.1%. The comparison between forex session dynamics and oil's fundamentally different session structure is the most important conceptual point in this guide and the one most forex traders miss initially.
The rollover section clarified something that cost me money before I read this. I had been holding WTI CFD positions through front-month expiry without realising the chart gap is a contract transition, not a real market move. After checking my broker's rollover policy, I now know which dates to watch and have not been caught by an unexpected rollover since. The explanation of how the CFD price shifts to the new front month is more clearly written than anything in my broker's own documentation.
Coming from three years of forex trading, the ATR-based stop placement was the practical adjustment that made the biggest difference. My default stop on EUR/USD is around 25 pips. Applying 1.5 times the daily ATR to oil setups produced stops in the $2.25 to $3.75 per barrel range, which initially felt wide but reflected actual market structure rather than arbitrary round numbers. My oil setups had been getting stopped out on normal intraday noise before I made this change. Over four months of WTI trading using ATR-scaled stops, my win rate on the daily EMA pullback improved from around 44% to 61% and monthly returns have averaged 7.6%. Sizing backward from the stop rather than forward from a default lot made the numbers work immediately.
The WTI versus Brent comparison table answered something I had been unclear on since I started trading oil six months ago. My broker prices both contracts at the same spread, so following the guide's logic I chose WTI specifically because the EIA inventory reaction is cleaner and more repeatable.
Cutting position size by 50% when moving from forex to oil CFDs was the practical instruction that changed how I manage this instrument. I had been running the same lot size on WTI that I use on EUR/USD and taking unnecessary P&L swings that had nothing to do with my analysis being wrong. Dropping to 0.1 lot from my standard 0.2 lot while keeping the same percentage risk calculation took two weeks to feel natural, but my drawdowns on oil fell significantly. Monthly return on oil positions has averaged around 6.8% over three months since I made that adjustment.
Leave a Review

Forex Analyst & Senior Trader
Former FX desk trader with 8 years in institutional forex. Works in multi-timeframe analysis and order flow, turning desk experience into systematic, testable rules across forex and metals.