What is VWAP, really?
Before any results, here is the thing itself. One line, drawn where the money actually traded.
A plain moving average treats every candle the same. VWAP does not.
It weights each price by the volume traded there, so a bar where a fortune changed hands pulls the line toward it, and a quiet bar barely moves it.
That is the whole idea. The line sits where most of the money agreed price was fair.
The math is lighter than the name. For each bar you take the typical price, high plus low plus close over three, multiply it by that bar’s volume, and divide the running total by the running volume.
High-volume levels dominate the average. Quiet levels fade.
Above the line, price is at a premium. Below it, price is at a discount. That single read is why desks watch it: an execution filled below VWAP beat the day, one filled above paid up.
Classic VWAP resets every session, so it belongs on intraday charts. We tested something different: a rolling 20-bar VWAP on the daily, which never resets and works as a swing tool.
Same fair-value idea, a timeframe a beginner can actually hold. For the full formula, Investopedia’s VWAP entry walks the derivation.
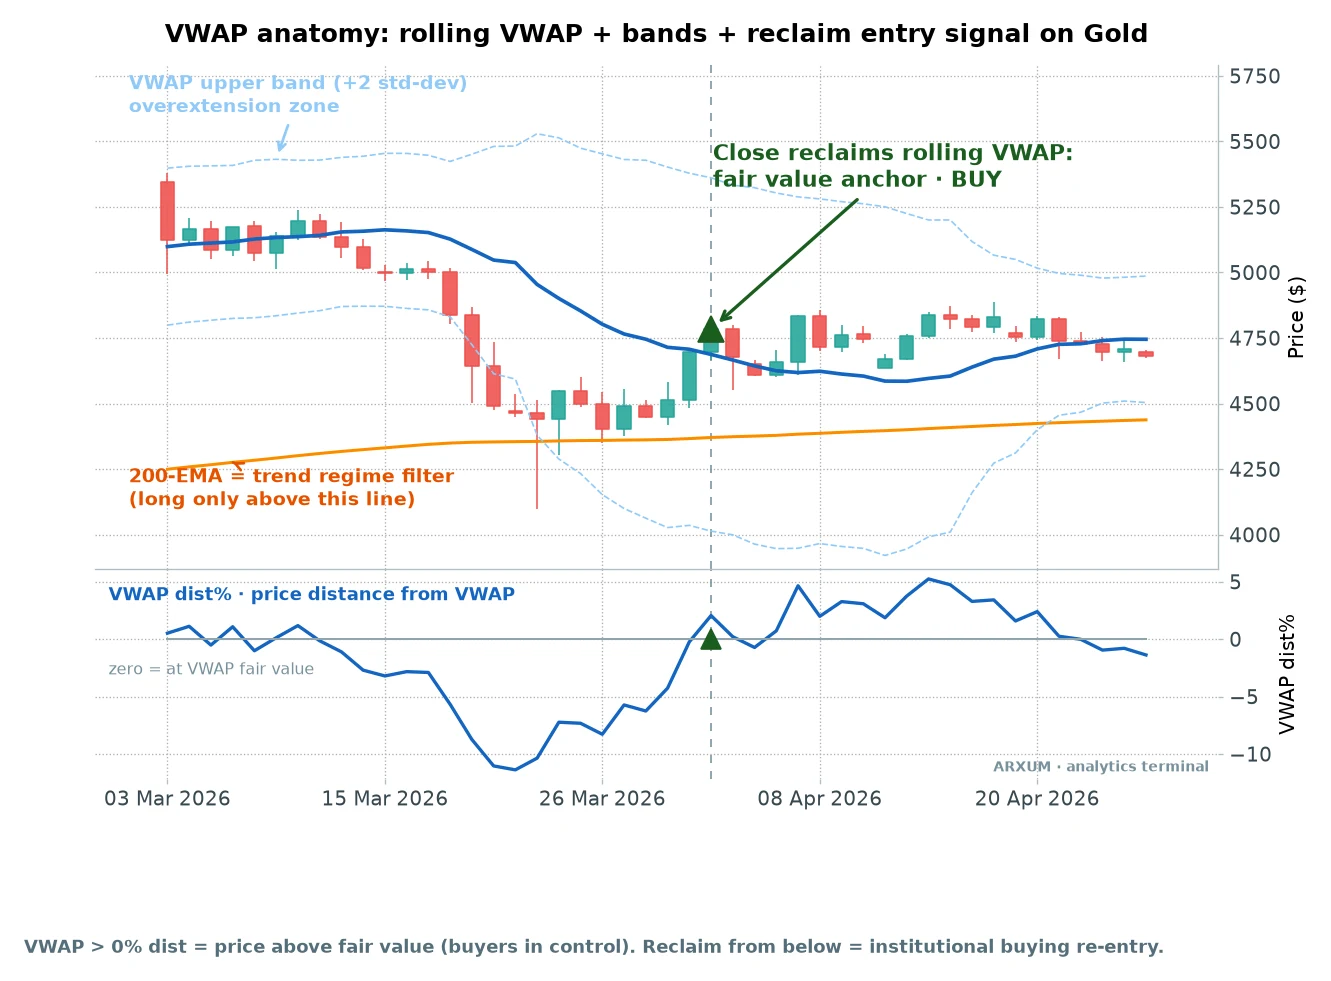
Three things sit on that chart, and you need all three before the setups make sense.
- The rolling VWAP (blue). Fair value. Price reclaiming it from below is the core signal.
- The bands (dashed). A stretch of two standard deviations either side of VWAP, like Bollinger Bands but volume-weighted, meaning Bollinger bands sit around a plain moving average where every candle counts equally while these sit around VWAP and shift with where the volume actually traded, not just with price. Roughly 95% of price sits inside them, so a tag of the upper band means price is far above fair value.
- The 200-EMA (orange). A slow moving average that marks the trend regime. Price above it means the trend is up, and we take longs only. That one filter keeps you out of the setups that bleed.
VWAP works as dynamic support and resistance as well. In an uptrend the line becomes the floor pullbacks bounce off.
That is the second setup below.
The three VWAP trading setups
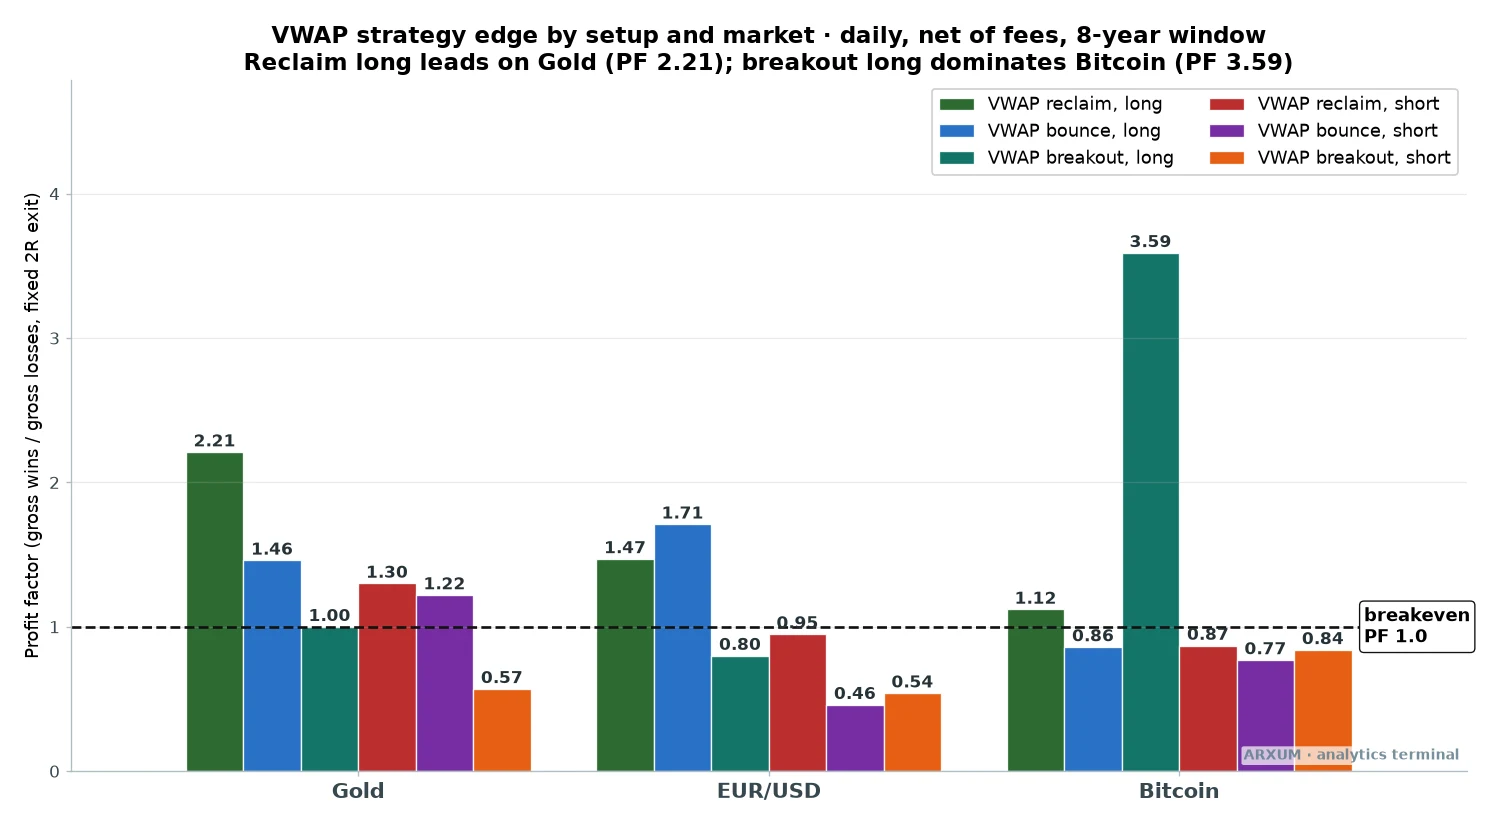
We took the rolling VWAP and ran three ways of trading it across eight years of daily data, net of fees, long and the mirror short. Gold, EUR/USD and Bitcoin.
No tuning, no cherry-picked asset.
The split was clean, and it is the whole map of this article.
| Market | Best setup | Trades | Profit factor |
|---|---|---|---|
| Gold (XAU/USD) | Reclaim, long | 45 | 2.21 |
| EUR/USD | Bounce, long | 28 | 1.71 |
| Bitcoin (BTC) | Breakout, long | 29 | 3.59 |
Two words carry the rest of this piece, so here they are in plain terms.
Profit factor is every dollar the setup won divided by every dollar it lost. Above 1.0 it makes money, below 1.0 it loses, and 2.0 means it won two dollars for each one given back.
Reward-to-risk, written 1:X, is per trade: the 1 is the distance from your entry to your stop, the X is how many times that distance the trade made. Every setup here targets a fixed 1:2, so a winner pays twice what a loss costs.
Here are the three, ranked by how well they held up. Tap a row to jump to its rules.
| Rank | Setup | Where it pays | Profit factor |
|---|---|---|---|
| 1 | The VWAP reclaim | gold in an uptrend | 2.21 |
| 2 | The VWAP bounce | gold and EUR/USD pullbacks | 1.46 to 1.71 (gold to EUR/USD) |
| 3 | The VWAP breakout | Bitcoin bull runs only | 1.00 to 3.59 (gold to Bitcoin) |
One number defines each setup: how far price is from VWAP at entry. The lower panel on every trade chart plots that as VWAP dist%, where zero means price is exactly at fair value.
Reclaim buys near zero, bounce buys a touch above, breakout buys when price is already stretched. Keep that in mind and the charts read themselves.
1. The VWAP reclaim
The lead, and the cleanest thing the data found. Price drifts below fair value, then a daily candle closes back above the rolling VWAP.
That reclaim is the buy.
It is a mean-reversion-to-trend signal. The market dipped under fair value, buyers stepped back in, and you join as they retake control.
The rules, on the daily chart:
- Price is above the 200-EMA, so the trend regime is up. Longs only.
- Price has been sitting below the rolling VWAP, then a daily candle closes back above it. That close is the trigger.
- Enter at the next day’s open. Stop below the pullback low. Target twice the risk, a fixed 1:2.
Front-load one gauge before the chart, because it appears on all of them. ADX, short for Average Directional Index, is a trend-strength reading from 0 to 100.
Low means chop, high means a strong move. We mark the 22 line on every chart, because that is where the edge showed up in the sweep.
It is free on TradingView.
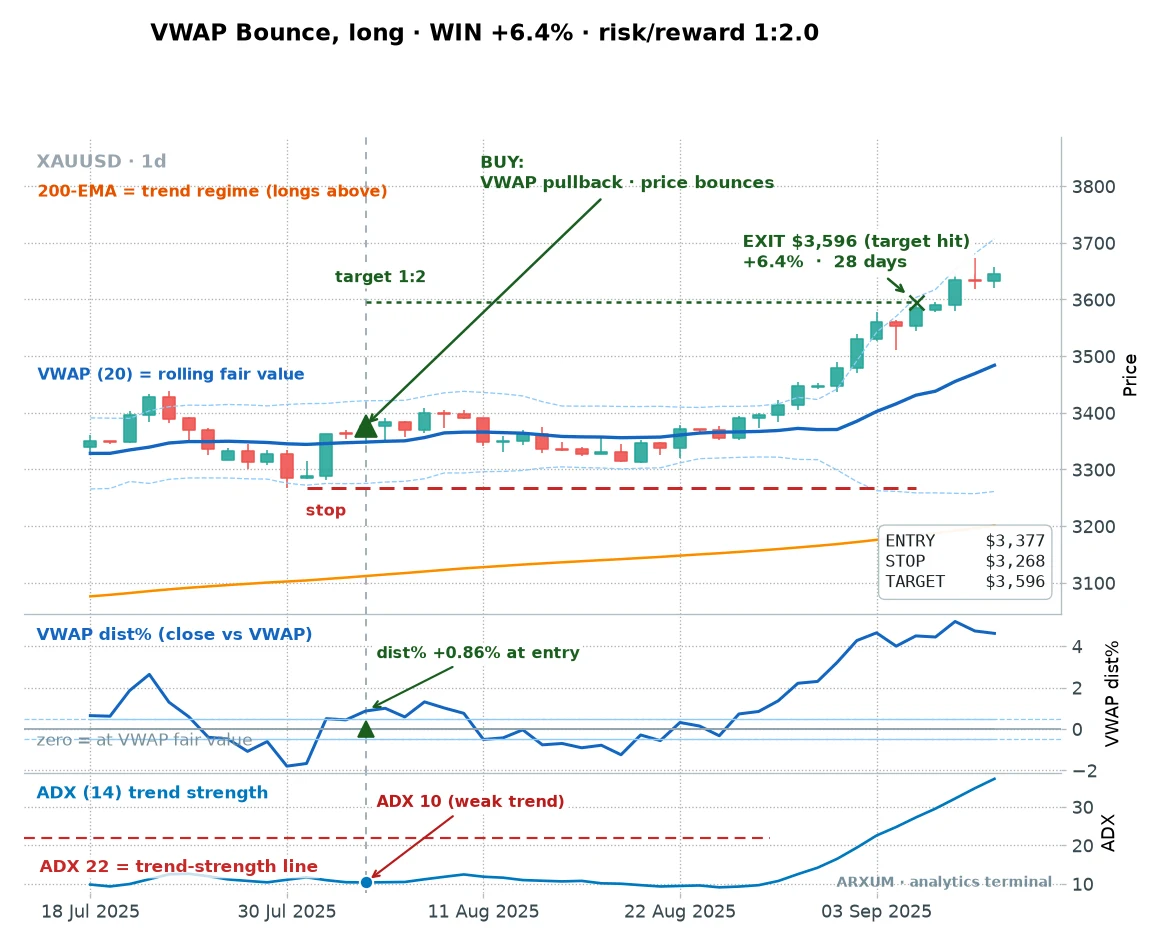
Here is a reclaim on gold that worked.
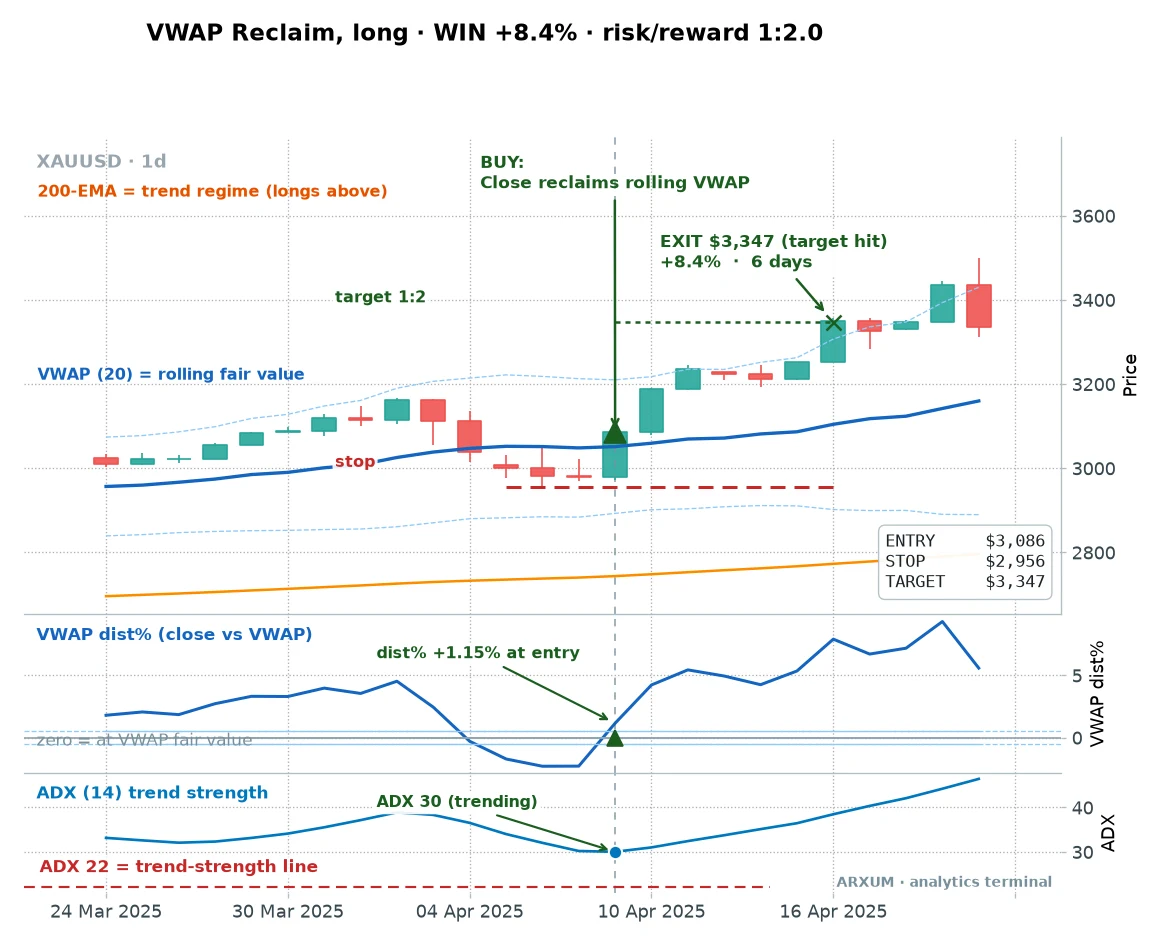
Read it left to right. Price slid under the blue VWAP, the dist% panel dipped below zero, then the marked candle closed back above the line while price held over the orange 200-EMA.
Entry at $3,086, stop at $2,956, target at $3,347. Price reached target in six days for +8.4%, twice what the stop risked.
The regime filter did the heavy lifting. Price was above the 200-EMA, so this was a long in an uptrend, not a knife-catch in a falling market.
It repeats. Here is a second reclaim on gold, same rules, a different stretch of the tape.
Now the honest half. The reclaim wins barely over half its trades, so it loses plenty.
Here is one that failed.
The reclaim printed, price ticked up, then sellers took it straight back down through the stop in eight days. No filter saves you from this one.
It is the cost of doing business, and the 1:2 target is what pays for it: one winner covers two of these.
That is the machine over the full run. Not two lucky charts, the whole thing.
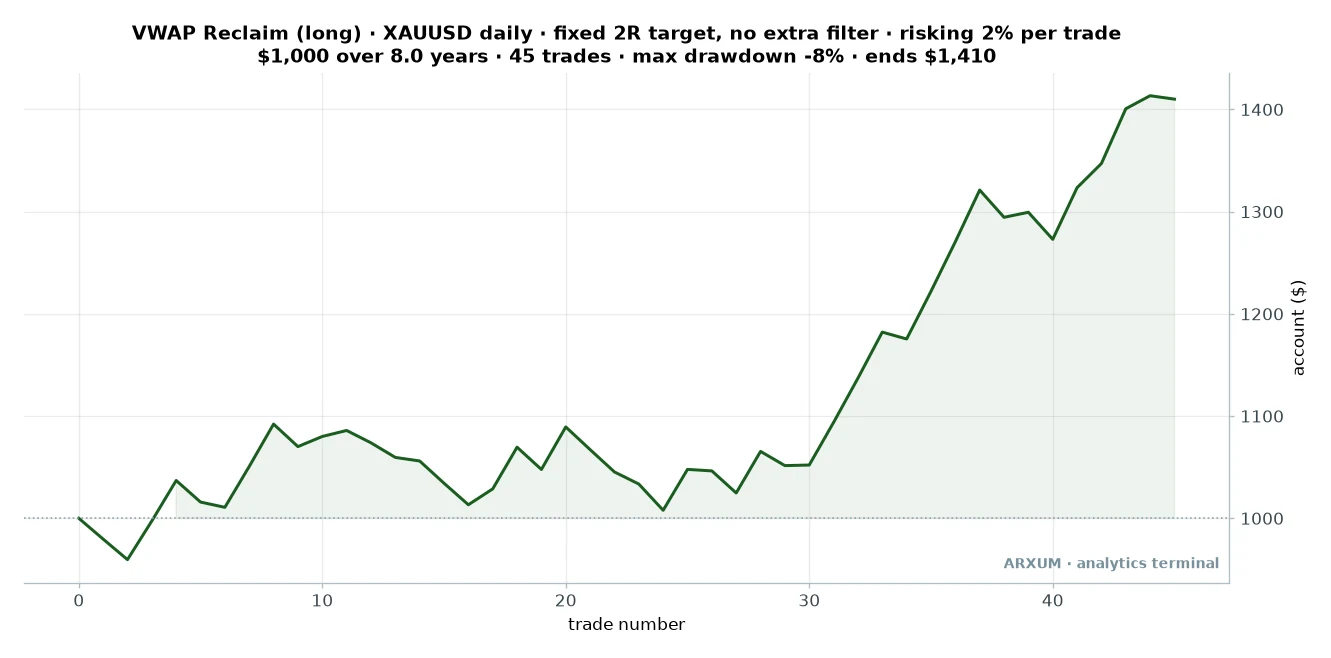
Look at the shape, not just the end. The account chops sideways for the first thirty trades, a long grind of small wins and small losses cancelling out.
Then the back half climbs as gold trends.
That is the true face of this setup. A win rate near a coin flip, a lot of nothing, then a run of winners that pays for everything.
One line in the table below needs a word first. Max drawdown is the deepest the account ever fell from a prior high, so the -8% here means the worst peak-to-trough dip along the way cost 8% of capital before the account recovered.
| Trades | 45 |
| Win rate | 51% |
| Reward-to-risk | 1:2 |
| Profit factor | 2.21 |
| Max drawdown | -8% |
| Avg hold | about 8 days |
| Net return on $1,000 | +41% |
Can you push it further? The sweep says yes, with the right confirmation.
And the winner is not the one most guides reach for.
Volume barely moved the needle. What lifted the reclaim was regime, stacked on regime.
| Filter at entry | Trades | Profit factor |
|---|---|---|
| No extra filter | 45 | 2.21 |
| Also above the 50-EMA | 36 | 3.00 |
| RSI above 50 | 38 | 2.65 |
| Quiet volatility | 19 | 3.57 |
| Counter-trend (RSI below 50) | 7 | 0.33 |
The read is plain. Add a faster moving average, the 50-EMA, on top of the 200, and demand price be above both.
That double-regime check lifted the profit factor from 2.21 to 3.00 and still left 36 trades, a real sample.
So the verdict is concrete: take the reclaim only when the trend is clearly up, and skip the volume filter. The bottom row shows the mirror image: reclaims taken against the trend, with RSI under 50, collapsed to 0.33.
That is a losing setup. Trend is the whole game here.
2. The VWAP bounce
Second in the ranking, and the one that reads most like textbook VWAP. In an uptrend, price rides above fair value, pulls back to touch the rolling VWAP, and bounces.
You buy the bounce.
Where the reclaim buys price coming up from below, the bounce buys a pullback landing on the line from above. VWAP acts as the floor.
The rules, on the daily chart:
- Price is above the 200-EMA, trend up, longs only.
- Price pulls back from above to touch or near the rolling VWAP, then a daily candle turns back up off it.
- ADX above 22, so a real trend is in force, not a drift. Enter next open, stop below the pullback low, target 1:2.
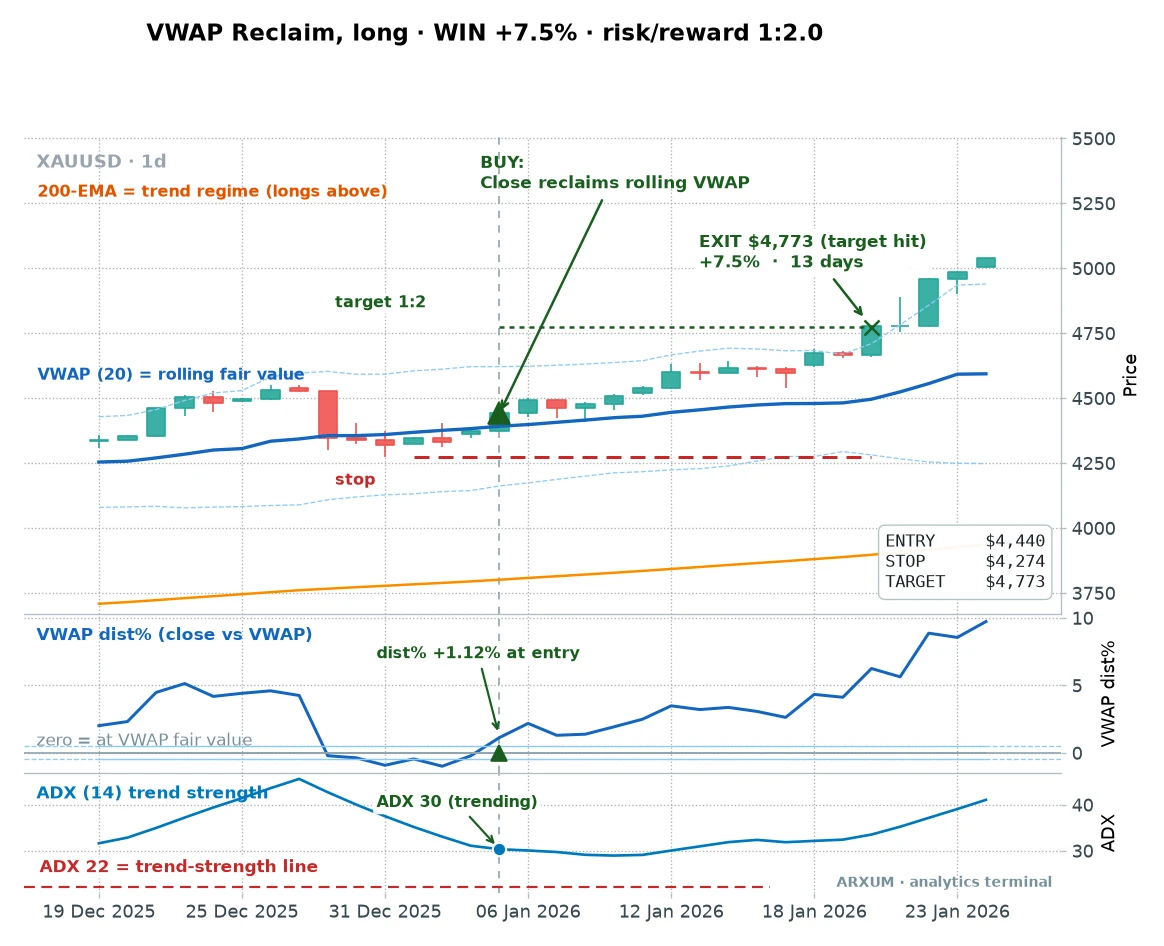
Here is a clean one on gold.

Price was trending up, well above the 200-EMA. It eased back to the VWAP, the dist% panel dropped near zero, then the next candle turned up off the line.
Entry $4,440, stop $4,274, target $4,773. Thirteen days to target for +7.5%, twice what the stop risked.
The bounce holds up on more than one occasion, which is what you want to see.
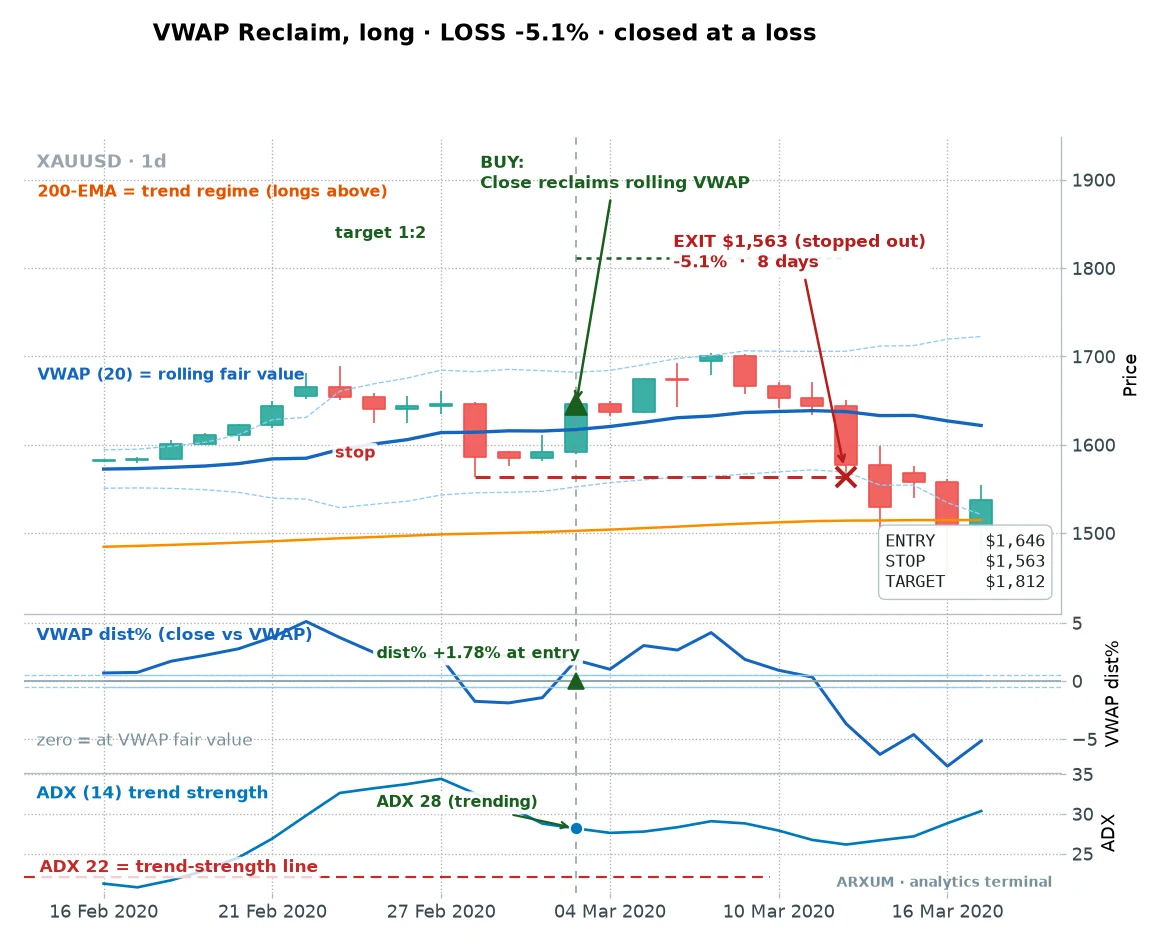
And the failure, so you know its face. When the pullback does not hold, price rolls straight back through the stop.
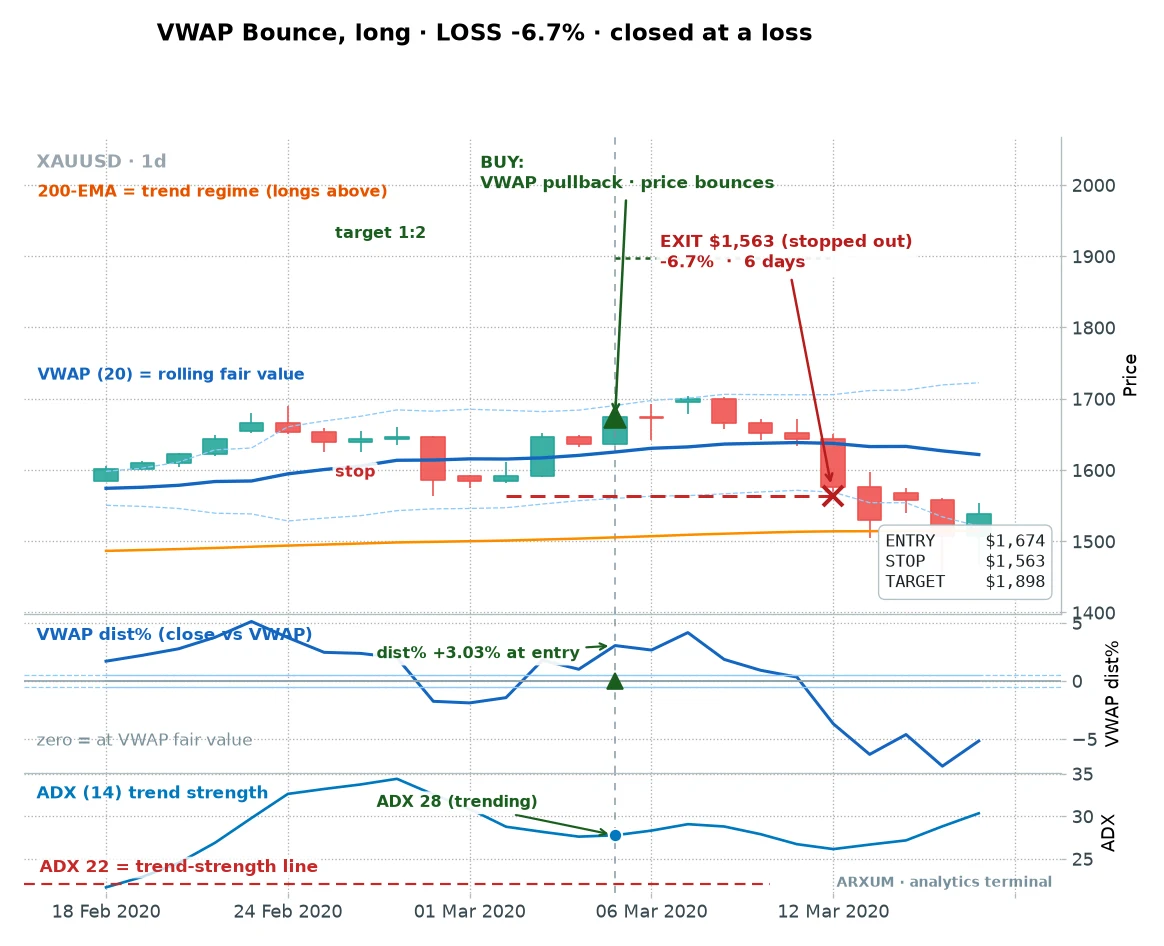
This one stopped out for a 6.7% loss when the pullback gave way and price kept falling. The stop is close on a bounce, but a run of these is exactly what the drawdown below is made of.
The full run tells the harder story of this one. It is more patient than the reclaim.
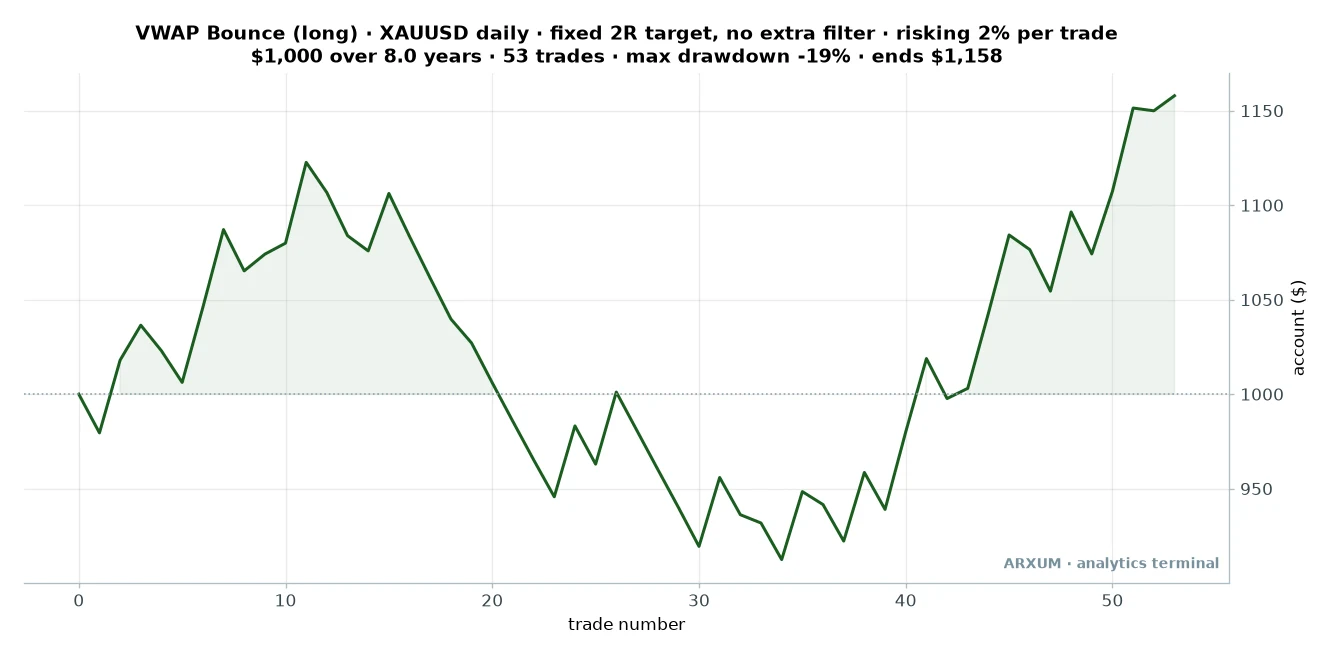
This curve is the reason to size small. The account climbed, then bled for a stretch of twenty-odd trades down to about a 19% drawdown, then recovered.
If you had started at the top of that hump, you would have sat underwater for months.
That is normal, and it is survivable at 2% a trade. It would not be survivable if you were risking a tenth of the account each time.
| Trades | 53 |
| Win rate | 42% |
| Reward-to-risk | 1:2 |
| Profit factor | 1.46 |
| Max drawdown | -19% |
| Avg hold | about 13 days |
| Net return on $1,000 | +16% |
The filter that helped here was different from the reclaim, which is the point. Each setup wants its own confirmation, not one fixed recipe.
On the bounce, screening for ADX above 22 raised the profit factor from 1.46 to 1.88. You read that off the chart with no extra work: the ADX panel is already there, and you want it sitting above the 22 line at entry.
A pullback in a genuinely trending market bounces. A pullback in a limp, low-ADX market just keeps falling.
3. The VWAP breakout
Third, and the one with a split personality. On most markets it is dead.
On one it is the best setup in the whole study.
The idea is momentum, not mean reversion. Price does not pull back to VWAP, it explodes away from it, closing above the upper band.
You buy the expansion and ride it.
The rules, on the daily chart:
- Price above the 200-EMA, trend up.
- A daily candle closes above the upper VWAP band, the plus-two-standard-deviation line. That is price stretching well past fair value on strength.
- ADX above 22 to confirm real trend. Enter next open, stop back inside the band, target 1:2.
On gold, it looks great on a good day.
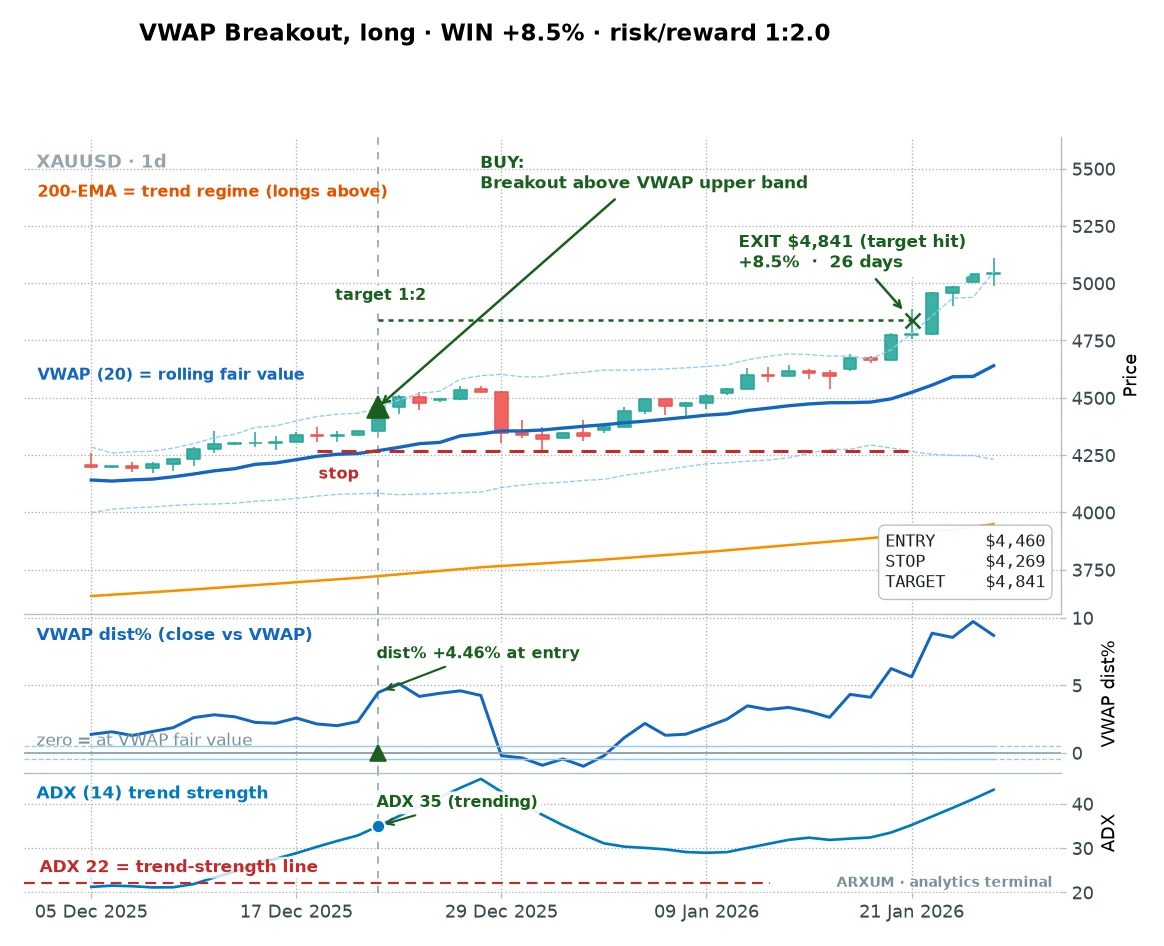
Entry $4,460, stop $4,269, target $4,841, and price marched to it over most of a month. When a breakout works, it works big, because you are riding a market that has already committed.
Now the trap, and it is a real one. Chase a breakout that is already stretched far past the line, and you buy the top.
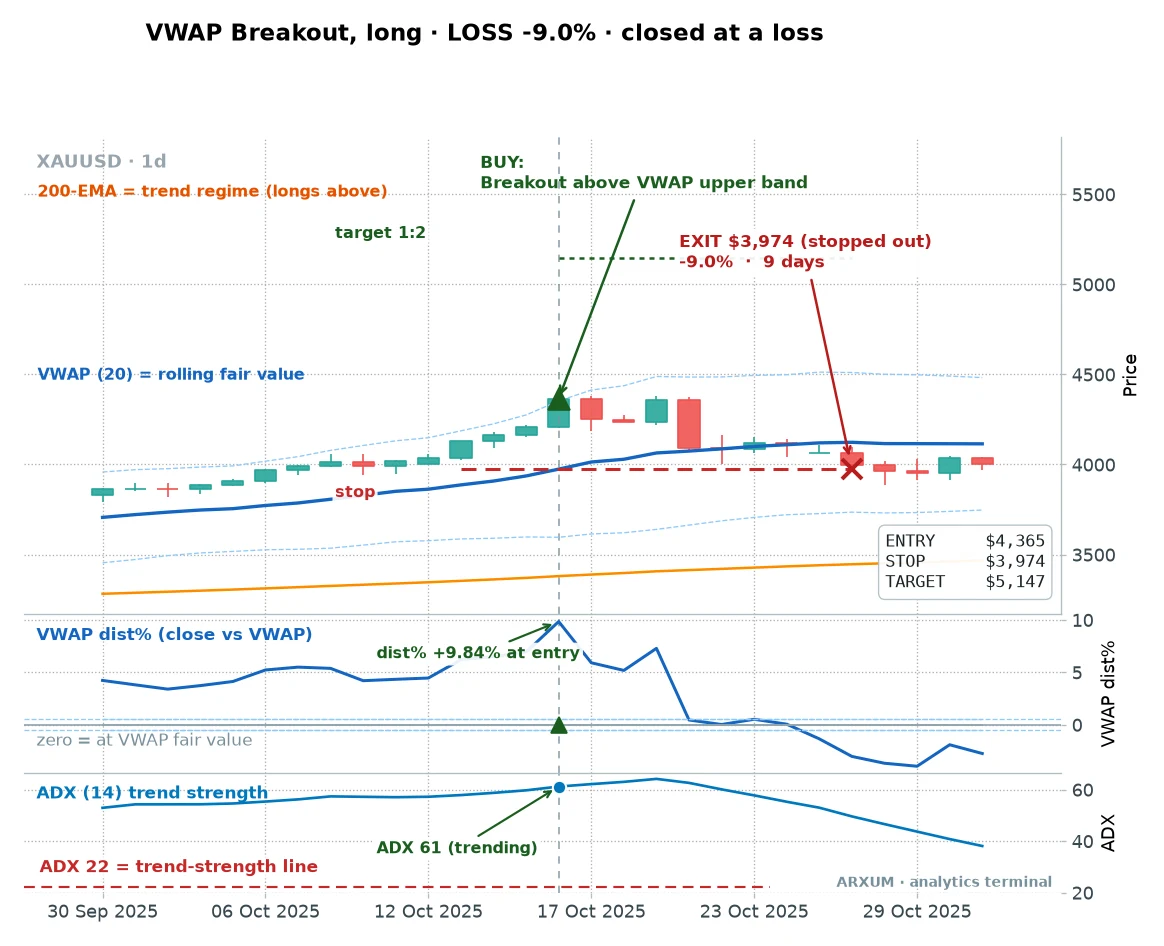
Look at the dist% panel on that chart. Price was nearly 10% above fair value at entry, and ADX read 61, a violent, overstretched move.
Buying there is buying exhaustion. It reversed and stopped out for the worst single loss in the study.
The lesson: a breakout you take at fair-value-plus-a-little is a trade, one you take at fair-value-plus-a-lot is a coin toss against gravity.
The full gold run shows why breakout ranks last on the metal.
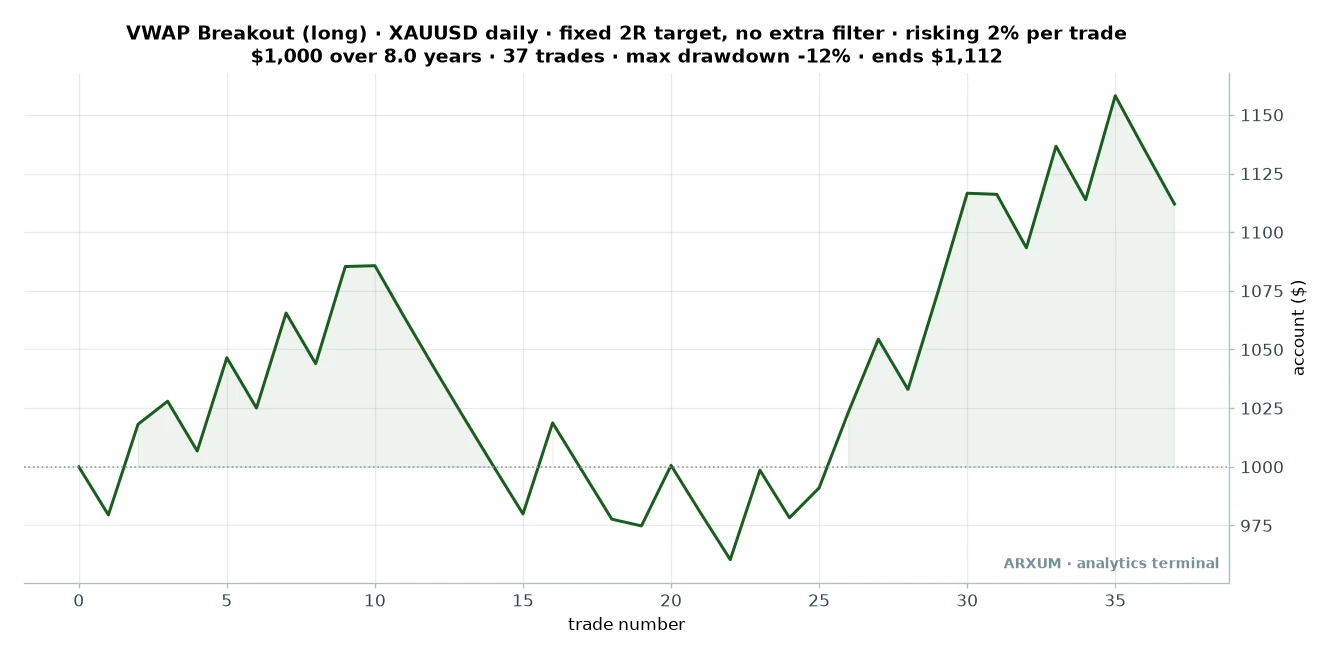
| Trades | 37 |
| Win rate | 43% |
| Reward-to-risk | 1:2 |
| Profit factor | 1.00 |
| Max drawdown | -12% |
| Avg hold | about 3 weeks |
| Net return on $1,000 | +11% |
A profit factor of exactly 1.00 is the definition of a coin flip. The breakout on gold makes and loses about the same.
The small +11% the equity curve ends on is not an edge; it is the order the winners and losers happened to fall in. Each winner pays 2R and each loss costs 1R, so a slightly different sequence would have left the same PF-1.00 run flat or under water.
It is not a setup to trade on the metal, and I would leave it there.
So why does it lead the whole ranking? Because on Bitcoin, this same breakout was the single best thing we tested.
That is the next section.
Does the edge travel?
A finding on one market is a coincidence. The reason to trust the reclaim is that the same line and the same rules paid on more than gold.
Here is the lead setup, the reclaim, run across all three markets.
| Market | Trades | Win rate | Profit factor |
|---|---|---|---|
| Gold (XAU/USD) | 45 | 51% | 2.21 |
| EUR/USD | 34 | 41% | 1.47 |
| Bitcoin (BTC) | 58 | 40% | 1.12 |
Gold leads, but the reclaim stayed above breakeven everywhere. On EUR/USD it printed a 1.47 profit factor, a modest but real edge, and its bounce cousin did a shade better at 1.71.
Here is a EUR/USD reclaim that worked, so you see the setup is not gold-only.
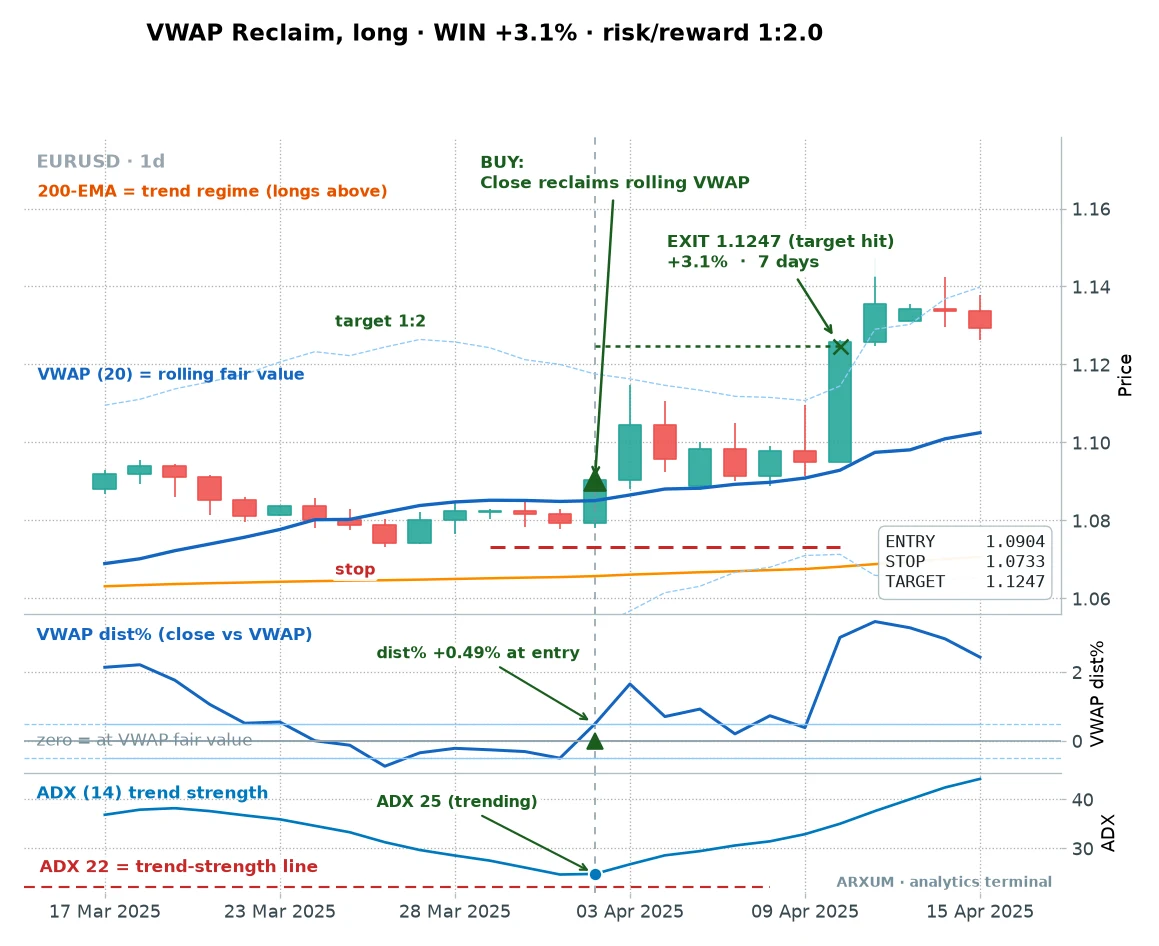
Same shape as the gold trade, smaller numbers because a currency pair moves less than the metal. Entry 1.0904, stop 1.0733, target 1.1247, a clean 1:2.
The percentage gain is smaller, but the reward-to-risk is identical.
It repeats on the pair, too, which is what separates a setup from a fluke.
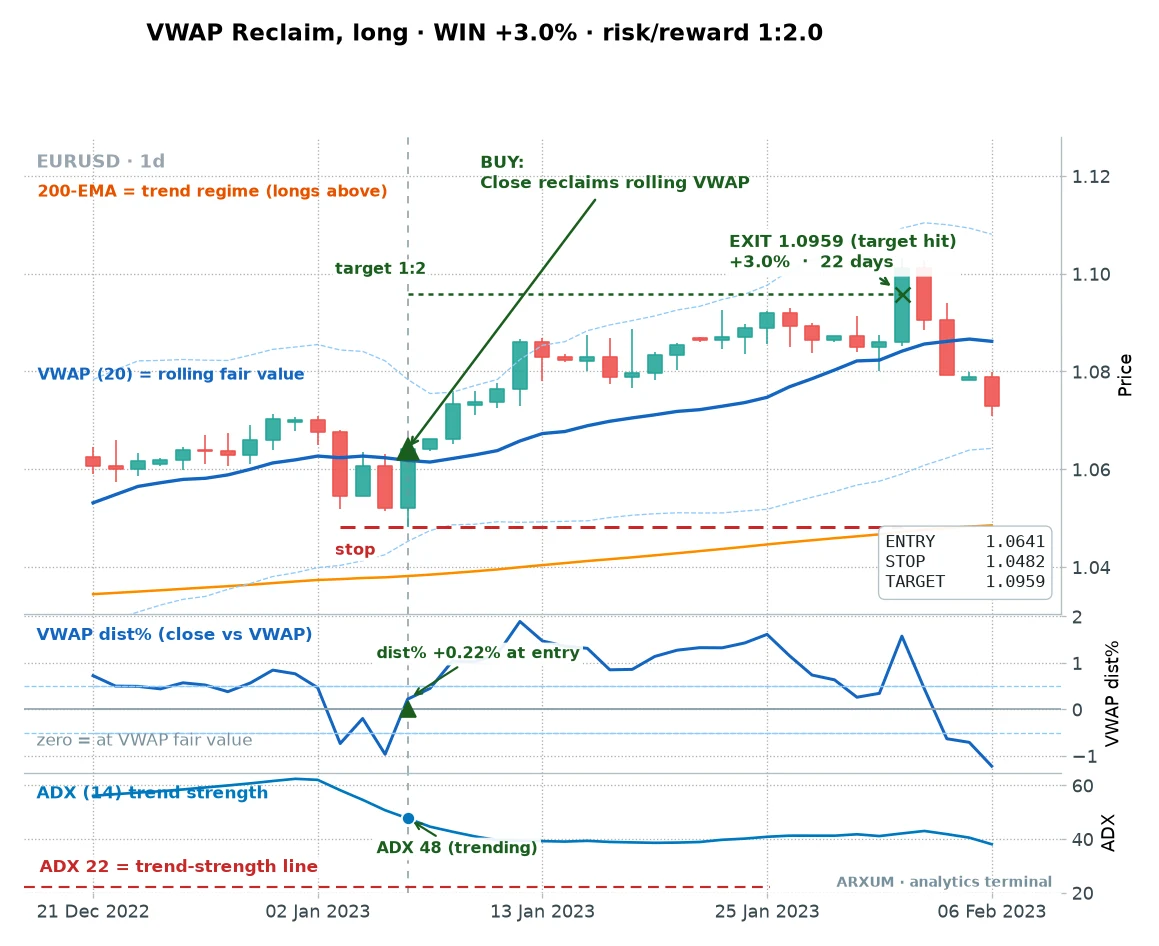
The gain looks modest next to gold, but that is the currency, not the setup. A 1:2 trade on EUR/USD compounds the same way a 1:2 on gold does; you just size larger because the stop is a smaller percentage move.
EUR/USD wanted its own confirmation, though. On the pair, screening for ADX above 22 lifted the reclaim from 1.47 to 1.85.
Currencies need the trend spelled out more than gold does.
And it loses on EUR/USD too. Here is one.
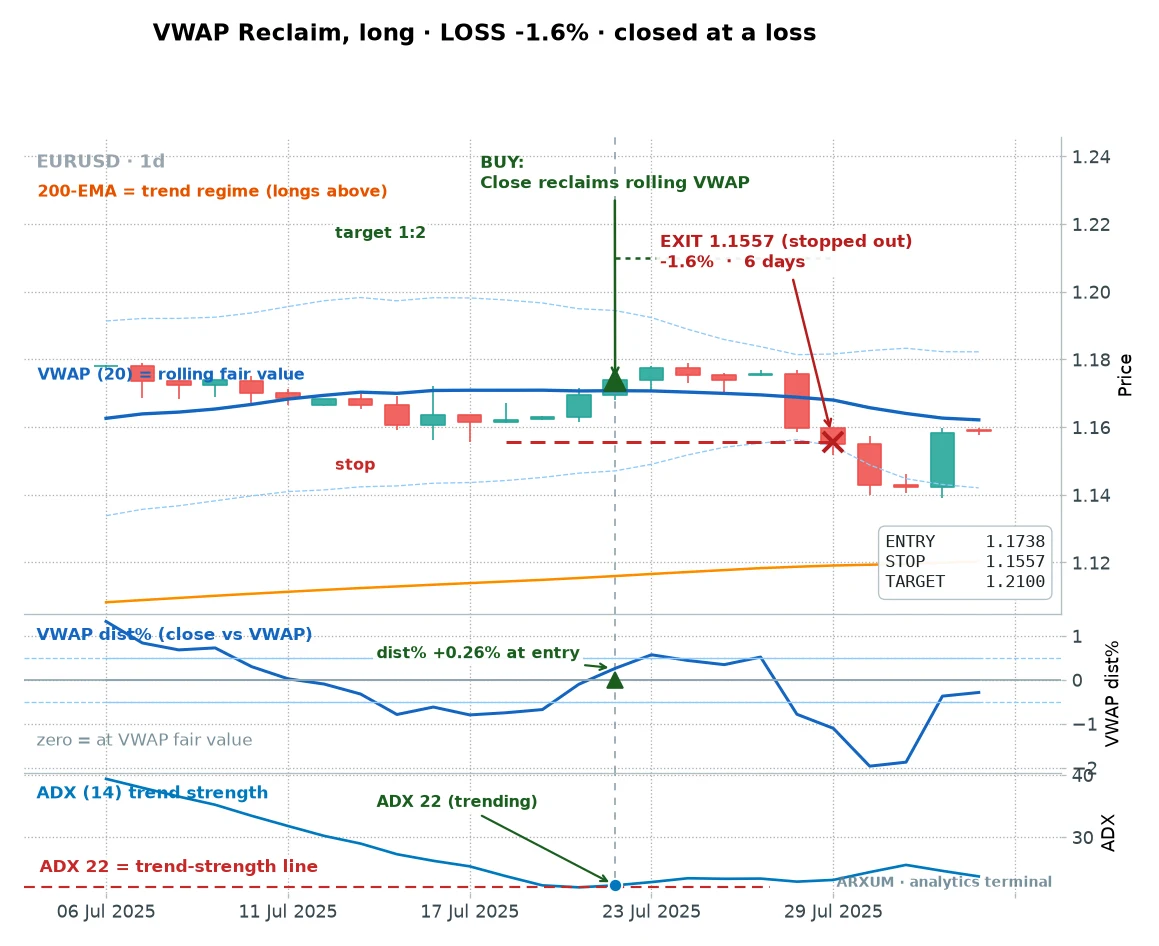
Notice the ADX panel sat right on the 22 line, the lowest reading the filter accepts. That is the marginal trade the filter is meant to warn you off.
When trend strength is only just there on a currency, the reclaim is a coin flip.
Bitcoin flips the whole map. The reclaim only managed 1.12 there, but the breakout, the setup that died on gold, printed a 3.59 profit factor at a 66% win rate over 29 trades.
Adding the ADX filter pushed it higher again, though on too few trades to lean on.
The reason is regime. Bitcoin trends in long, violent bull runs, and a band breakout in that environment catches the whole leg.
One honest caveat, though. I have no annotated Bitcoin trade to show you here, so treat that 3.59 as what it is, a strong number from the sweep and a bull-cycle capture, not a ranging-market tool.
Its out-of-sample profit factor was only 1.45, so the edge fades when crypto stops trending.
Silver and oil were not part of this run. If you trade them, the honest answer is that this study does not cover them, and I would not assume the gold numbers carry over.
How well it holds up, and where it breaks
Real numbers include the ugly ones. Here is where the VWAP indicator stops helping.
- The reclaim edge is regime-dependent. Split the eight years in half. On the first four years the gold reclaim barely cleared breakeven, a 1.11 profit factor. On the last four, data it was never built on, it ran at 3.54. An edge that holds on unseen data is trustworthy, but this split says plainly that the reclaim needs a trending market. In a flat, choppy regime it grinds.
- The short side is weak. Every mirror-short setup came in near or below breakeven. Reclaim short on gold managed 1.30, bounce short on EUR/USD sank to 0.46. VWAP long in an uptrend works because the assets we trade spent these years trending up. Do not assume the short is symmetric.
- Gold breakout is dead. A 1.00 profit factor is a coin flip. Use the breakout on Bitcoin in a bull run, not on the metal.
- Drawdowns are real. The bounce sat 19% underwater at its worst. That is a run of losses you have to live through, not a number to skim past.
- The forex volume is a proxy. Spot EUR/USD has no central exchange, so the only volume you can weight by is tick volume, a count of how many times the price changed, not the real size that traded. It tracks activity closely enough to be useful, but the EUR/USD results lean on that proxy. Read them with a little more salt than the gold and Bitcoin numbers, which come from real exchange volume.
The single worst trade in the study, the 9% breakout loss, came from chasing price nearly 10% above VWAP at an extreme ADX. Left in, it drags every average.
That is the honest data, and it points straight at the rule: do not chase overextension.
How to actually place the trade
Rules are useless until you can size and click them. Let me walk one from the account down, then hand you a few ready configs.
Start with the money, because that decides which market you can trade. Take a $1,000 account and the standard rule of risking 2% per trade, so your budget is $20 per trade.
Now try to place the lead setup, the gold reclaim, at those numbers. The winning example entered at $3,086 with a stop at $2,956, a risk of $130 per ounce.
The smallest gold position most brokers allow is one micro lot, which for gold is one ounce. On a currency pair a micro lot means something different, as the EUR/USD math below shows.
So the least you can risk on gold is $130.
That is the problem. For $130 to be 2% of your account, you would need about $6,500.
On a $1,000 account, a single ounce of gold risks 13% of your capital, six times the rule. The gold reclaim does not fit a small account without breaking your own risk limit.
So a $500 to $1,000 trader takes the same setup on the cheaper market, EUR/USD, where it fills cleanly. Here is that trade, sized step by step.
- Risk budget: 2% of $1,000 is $20.
- The trade: enter 1.0904, stop 1.0733. A pip is the fourth decimal place on a currency pair, so that 0.0171 gap is 171 pips of risk.
- Cost per pip: one micro lot of EUR/USD, 0.01 lots, moves $0.10 per pip.
- Risk per micro lot: 171 pips times $0.10 is $17.10.
- Size: $20 ÷ $17.10 = 1.17 micro lots. Round down to 1 micro lot to stay under budget, risking about $17.
That one micro lot is roughly $1,090 of currency held against a $1,000 account, so your effective leverage is about 1:1. Your broker offering 1:100 is just margin headroom that lets the position exist.
It is not extra risk, because the 2% stop already caps your loss.
Here is that exact trade on the chart, so you can see where each price goes before you type it.
To place it: wait for the daily close back above the rolling VWAP, then enter at the next open with a market order, or a buy-stop above the signal candle’s high. Put 1.0733 in the stop-loss field and 1.1247 in the take-profit field, which is twice the stop distance for a 1:2.
Then leave it alone until one of them hits.
Three ready configs, all daily, all longs in an uptrend above the 200-EMA:
- Gold reclaim: buy when a daily candle closes back above the rolling VWAP, ADX above 22, ideally price also above the 50-EMA. Stop below the pullback low, target 1:2. Best profit factor, needs a bigger account.
- Gold bounce: buy when a pullback touches the rolling VWAP and the next candle turns up, ADX above 22. Stop below the pullback low, target 1:2.
- EUR/USD reclaim: the reclaim rule on EUR/USD, ADX above 22 to filter the weak-trend traps. The version a small account can actually place.
Here is the exact TradingView recipe, because the platform lists 20-plus VWAP variants that look nothing like ours:
- The VWAP line. Type Rolling VWAP into the indicator search and add that continuous rolling version. The plain built-in VWAP, also called Anchored or Session VWAP, resets every session and is the single most common one to grab by mistake.
- The bands. Open the Rolling VWAP indicator’s settings and turn on its standard-deviation Bands, then set the band multiplier to 2. That is the dashed overextension zone shown on every chart here.
- The trend filter. Add Moving Average Exponential twice, at lengths 200 and 50.
- The trend strength. Add Average Directional Index (ADX) at length 14, the gauge read against the 22 threshold.
- The dist% panel. The VWAP dist% oscillator in the lower panel is our own computed gauge, price’s percent distance from the VWAP line, not a one-click TradingView default. You can eyeball the gap between price and the VWAP line, or search community scripts for a VWAP distance or percent study.
- MT4 or MT5 users. Rolling VWAP is not native there, so the closest is a community VWAP indicator or the standard-deviation channel.
A word on the discipline, tied to these exact numbers. The reclaim wins about half its trades, so losing streaks are the norm, not a sign you are doing it wrong.
Expect to sit through a run of stops like the bounce’s 19% drawdown before the winners arrive.
If you take three to six losses in a row, do not double up to win it back. That streak usually means the market stopped trending, which is exactly when these long setups stall.
Step back, check whether price is still above the 200-EMA and ADX is still over 22, and only re-engage when the regime is back. Trade money you can afford to lose, keep the risk at 2%, and let the fixed 1:2 target do the compounding.
Where to go from here
The VWAP indicator is a fair-value line, and the honest edge is narrow: buy the reclaim in a trending market, size it small, and skip the breakout unless you are on Bitcoin in a bull run.
If you want to go deeper on the pieces, the ADX guide covers the trend filter that gates every setup here, and the reward-to-risk explainer unpacks the 1:2 math the whole study rests on.
FAQ
What is VWAP in plain terms?
Does VWAP actually work?
What is the best timeframe for VWAP?
What settings does the VWAP strategy use?
Which markets does VWAP work best on?
How much money do you need to trade VWAP?
How is VWAP different from a moving average?
How do you use VWAP to enter a trade?
What is the difference between rolling VWAP and session VWAP?
What do profit factor and reward-to-risk mean?
Reader Reviews
Be the first to review this — tell other traders what actually helped, or where it fell short.
Leave a Review

Quant Researcher & Systems Builder
Quantitative researcher who builds the automated systems behind Arxum strategy testing. Works in Python and Pine Script, using AI alongside classic backtesting to validate strategies on years of real data.