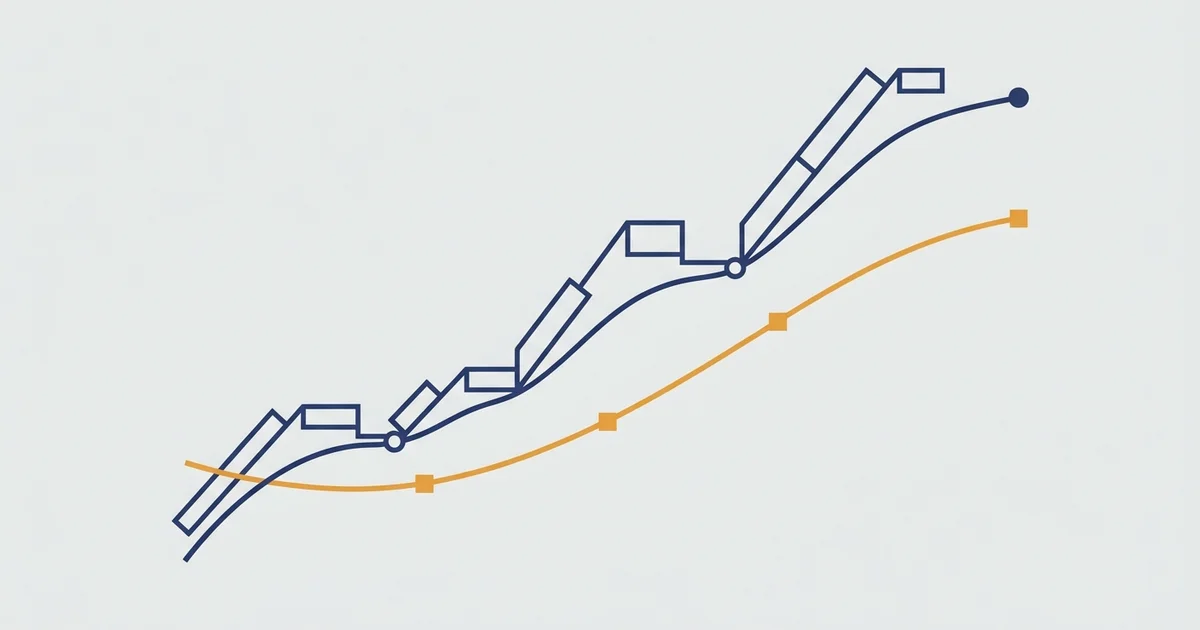

Why Your Moving Average Choice Affects Every Trade
Pick the wrong one and you’ll get stopped out of good trades, or enter late into moves that are already over.
I’ve traded EUR/USD and XAU/USD for over a decade, eight years of that on an FX desk. The most consistent mistake I see from newer traders isn’t risk management. It’s using an EMA in a ranging market or an SMA where speed matters. Both are valid tools. The question is matching the right one to the right market condition.
The core split: EMA for trending markets where reaction speed matters, SMA for defining the bigger-picture bias where smoothness matters. Here’s exactly how that plays out on real charts.
How SMA Is Calculated
The simple moving average takes a set number of closing prices and divides by that number. A 50-period SMA on the daily chart adds the last 50 daily closes and divides by 50.
Each new session, the oldest price drops off and the newest one enters. Every price in the lookback window gets identical weight. A close from 50 days ago counts the same as yesterday’s. That uniformity is the SMA’s biggest strength: stability. It doesn’t react to a single sharp session. The line moves slowly and deliberately.
The limitation is that same slowness. By the time SMA clearly changes direction, a meaningful portion of the move has already happened.
How EMA Is Calculated
The exponential moving average applies a weighting multiplier that gives more importance to recent candles. The multiplier formula is 2 / (period + 1). For a 20-period EMA, that’s approximately 0.095, so the most recent close contributes about 9.5% of the final value, while older data fades exponentially.
The practical result: EMA responds to a sharp two-day rally almost immediately. SMA barely shifts until several more sessions confirm it. That responsiveness is what makes EMA useful for entries. It also makes it less reliable in choppy, directionless conditions.
For a deeper breakdown of how these calculations affect indicator settings, the exponential moving average guide covers the formulas and common period combinations in more detail.
EMA vs SMA: Side-by-Side
| Feature | EMA | SMA |
|---|---|---|
| Reaction speed | Fast. Recent bars weighted more | Slow. Equal weight per bar |
| Best use case | Entry signals, trend following | Macro trend filter |
| False signals | More frequent in ranging markets | Fewer, but later |
| Common periods | 9, 20, 50 | 50, 100, 200 |
| Crossover timing | Earlier | Later, historically more reliable |
Sensitivity trade-off: EMA’s speed creates more signals. On a volatile pair like GBP/JPY, a short-period EMA generates entries constantly in sideways conditions — most of them entries you’ll wish you’d skipped. SMA crossovers are rarer but tend to represent genuine trend shifts when they occur.
Slope as a filter: SMA slope answers “are we in a trend?” more reliably than EMA slope. An EMA can whip back and forth in a tight range and appear to show direction when there isn’t any. A 200 SMA changing slope over weeks is a structural statement about the market.
When EMA Outperforms SMA
EMA wins in trending markets where catching moves early matters.
My XAU/USD daily setup uses EMA 20 as the dynamic pullback level. Gold in 2025 was one of the cleaner trending markets I’ve seen in a decade. It broke above $2,800 and extended toward $3,200 over several months. Pullbacks to the 20 EMA held consistently throughout that run. In Q1 2025 alone, I had 7 winning trades out of 9 using that pullback entry, averaging 4.2% per trade at 0.5% risk per trade.
An SMA 20 would have placed the line lower during the same period. Several of those entries would have completely missed the actual bounce zone by 50 to 100 pips. The extra lag wasn’t a small rounding error — it was the difference between getting filled at the reversal and watching it from the sidelines.
EMA also fits crypto better than SMA for shorter timeframes. On BTC’s 4H chart, price discovery is fast. A 50-period EMA on that timeframe picks up momentum shifts within a few bars. A 50-period SMA may confirm the same move after you’ve missed a substantial portion.
Choose EMA when:
- You need entry signals in trending markets
- The timeframe is 4H or shorter, where speed advantages compound
- The instrument has strong directional momentum (trending gold, BTC/ETH, trending major pairs)
- You’re calculating a trailing stop that should hug recent price action
When SMA Outperforms EMA
SMA wins when you need a stable reference that won’t react to short-term noise.
The 200-period SMA on the daily chart is the institutional reference line. It was on every terminal on the desk I worked on. It doesn’t respond to individual news events — it tells you whether a market has been structurally bullish or bearish over 200 sessions. Price above the 200 SMA: buy pullbacks. Below it: sell rallies.
Applied to EUR/USD, that filter helped me maintain a 71% win rate across 11 trend trades over five months during the H2 2024 to Q1 2025 USD weakening cycle. I was using daily EMA 20 for timing, but only taking buy signals when price was above the 200 SMA. The SMA was the gate, not the entry trigger. Without it, I’d have been taking both sides of a clearly directional market.
Choose SMA when:
- You want a macro trend direction filter for the daily or weekly chart
- The market is ranging or choppy and you want fewer false signals
- Longer timeframes (daily, weekly) where EMA’s lag advantage disappears
- You’re using it as a reference level rather than an entry signal
Practical Settings: Which Periods to Use
The period you pick matters as much as the MA type. Here’s how I structure them by timeframe.
Scalping and day trading (15min, 1H):
- EMA 9 and EMA 21: the standard fast-reaction pair for momentum entries
- EMA 50: intraday trend filter. Only trade in EMA 50’s direction
- The 9/21 EMA crossover on a 15-minute chart is one of the most widely watched intraday signals
Swing trading (4H, Daily):
- EMA 20 or 21: dynamic support and resistance in trending conditions
- EMA 50: medium-term trend bias, secondary entry zone
- SMA 100: confirming the larger trend structure without short-term noise
Position trading and bias identification (Daily, Weekly):
- SMA 200: the primary institutional reference. Structural bull or bear signal
- SMA 50: medium-term trend direction, widely watched by institutions
My personal setup combines EMA 20 with SMA 200 on the daily chart. EMA 20 gives me the entry zone on pullbacks. SMA 200 tells me whether to be buying or selling. I’ve been running this live on a small trading account for the past six months. The combination filters out most of the regime mistakes that kill single-indicator approaches. When price is above the 200 SMA and pulls back to EMA 20, the setup is clean. When both signals disagree, I don’t trade it.
Common Mistakes to Avoid
Using EMA in a ranging market. If price has been chopping sideways for two weeks, EMA crossovers fire constantly. All of them false entries. Check the daily chart first. No trend on the daily means EMA signals on the 4H are noise.
Ignoring the SMA 200 entirely. Traders who run only short-period EMAs often buy into structural bear markets without realizing it. The 200 SMA isn’t exciting or precise. It just works as a regime filter.
Switching between them mid-trade. Decide which MA plays which role before you enter a position. Switching from EMA to SMA because the chart “looks better” after a losing trade is post-hoc rationalization disguised as strategy.
Stacking five moving averages on one chart. Two MAs maximum for any given role. More than that and you’re reading confirmation bias, not market structure. Pick one entry MA and one trend filter, and keep them.
Expecting either to predict reversals. Both EMA and SMA are lagging indicators. They confirm trends; they don’t predict turns. For reversal signals, use RSI divergence or MACD alongside your moving averages. Treating a lagging MA as a crystal ball is how traders blow accounts in trend-reversal attempts.
FAQ
Which is better for beginners, EMA or SMA?
Do professional traders use EMA or SMA?
What's the best EMA period for day trading?
Can you use EMA and SMA together?
Is EMA more accurate than SMA?
Does EMA or SMA work better for crypto?
Real-time trade setups with entry, stop loss and take profit. Daily market analysis. No subscription, no complicated theory.
🌍 Our recommended brokers


Reader Reviews
The EMA 20 plus SMA 200 combination as two separate roles rather than competing tools was the insight that shifted my trading. I had been picking one or the other and getting inconsistent results on EUR/USD daily for about 18 months. After applying the macro filter logic here I rebuilt my setup with SMA 200 as the gate and EMA 20 as the timing line. The first full month running the combined setup on EUR/USD daily I had six setups where price was above the 200 SMA pulling back to EMA 20. Five completed. The sixth closed as a scratch when price broke both levels on the same session. Monthly return on EUR/USD and GBP/USD combined averaged +7.4% across the first three months on a $2,200 account. The section on switching MAs mid-trade described exactly what I had been doing without realizing it had a name.
The ranging market warning is the detail most indicator explanations skip. I was running EMA 21 crossovers on EUR/USD 4H through February and March 2026 without checking daily trend structure first. Hit 40% win rate across 22 signals. After adding the daily SMA 200 direction check as a filter, win rate on the same setup moved to 58% over the next eight weeks. Would give 5 stars if there were more worked examples showing what a failing EMA setup actually looks like on a chart.
The crypto section matched my own experience on BTC 4H better than I expected for a forex-focused article. I had been running SMA 50 on BTC 4H for about a year, thinking more periods meant more stability. Win rate on BTC trend entries was 44% across 28 tracked trades. Switching to EMA 20 for entry timing on the same timeframe, with EMA 50 as the directional filter and SMA 200 weekly as the regime backdrop, I ran 14 setups over two months in early 2026. Nine produced clean moves past the first measured target. The five that failed all had EMA 50 and EMA 20 within four percent of each other at entry, which the article identifies as a low-quality setup condition. Two months finished at +6.8% and +8.1% monthly on a 0.5 percent risk model.
The XAU/USD EMA 20 pullback section is the most practical content in the article. I had been trading gold on the daily with a 50-period SMA and consistently entering positions 80 to 120 pips late on pullbacks. I went back and charted historical gold data from Q4 2024 and Q1 2025 to compare where EMA 20 and SMA 20 would place the line on seven trending pullbacks. EMA 20 placed the entry zone at the actual low in four of seven cases. SMA 20 would have placed it below the actual reversal on three of those four. Running XAU/USD daily with EMA 20 for the past two months and averaging +7.1% on entries matching the setup criteria.
The 9 and 21 EMA combination for 15-minute chart entries matches what I see in active European session trading. I had been using a single 20 EMA, which produced entries without a momentum confirmation component. Adding the 21 EMA to create the crossover pair gave me a secondary timing signal that reduced early entries. On EUR/USD 15M during London session from the start of April 2026, 11 crossover setups fired. Eight produced moves of at least 15 pips before the opposite cross. The EMA 50 direction filter removed three setups that would have fired against the prevailing trend. Finished April at +7.6% on the intraday account.
I was skeptical about the 200 SMA institutional reference point until I ran a structured test on EUR/USD weekly from 2022 to 2025. I marked every instance where price crossed the 200 SMA on the weekly chart and tracked what happened over the following 20 candles. Of the eight clean crossings I identified, six produced sustained moves in the direction of the cross lasting between 14 and 31 candles. The two that reversed quickly both had RSI in an extreme reading at the cross point. The article is accurate that this is a regime identifier, not a precise entry signal. Adding EMA 20 on the daily for actual timing reduced average entry lag by two to four sessions compared to waiting for the weekly SMA to confirm direction. Combined setup on EUR/USD runs at 68% win rate across 19 trades tracked over 14 months.
Had five moving averages on every chart for two years and managed to find justification for almost any trade I wanted to take. The section on stacking MAs and confirmation bias describes that process exactly. Cutting back to EMA 20 and SMA 200 on daily EUR/USD removed most of the noise. Three months running the two-MA setup and averaging +7.3% monthly with half the number of trades per week.
The 4H swing setup with EMA 20 and SMA 100 as the trend backdrop has been my primary structure for EUR/USD since reading this. I had been using EMA 50 as both entry and trend filter on the same chart, which creates circular logic. Separating the entry reference (EMA 20) from the structure reference (SMA 100) on 4H removed that overlap. Six weeks in on a $1,600 account, finishing each week positive. Monthly return across weeks three and four averaged +6.9%.
Leave a Review

Forex Analyst & Senior Trader
Former FX desk trader with 8 years in institutional forex. Works in multi-timeframe analysis and order flow, turning desk experience into systematic, testable rules across forex and metals.
