
The Chaikin Money Flow indicator, by the textbook
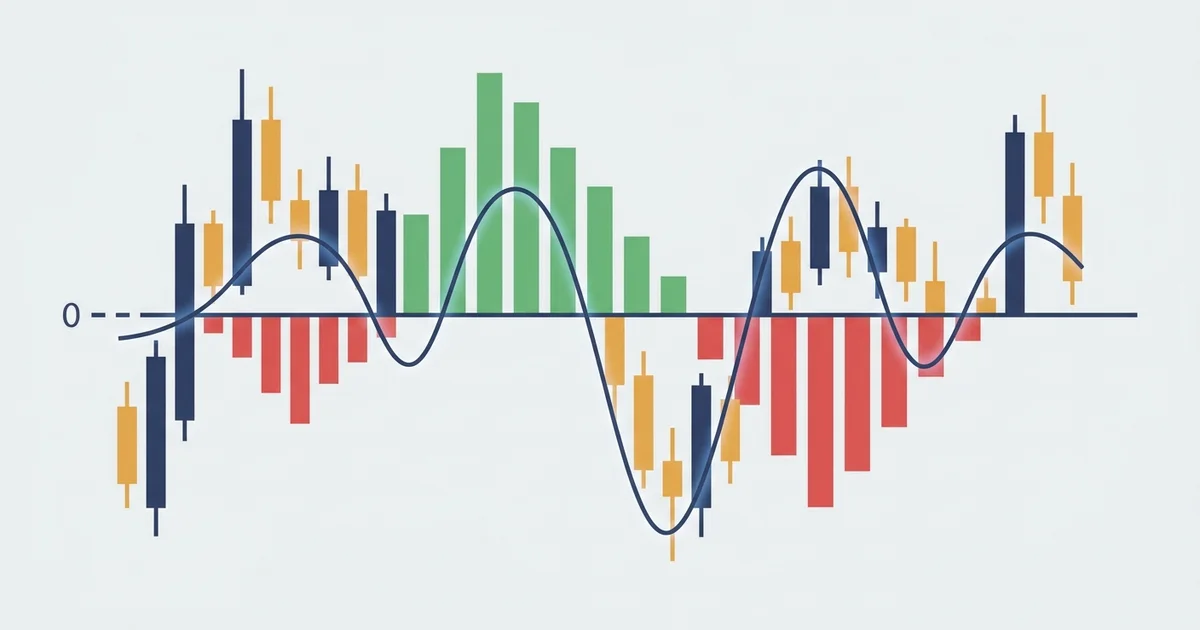
Here is the thing you came to see. This is the Chaikin Money Flow indicator, the way every chart draws it.
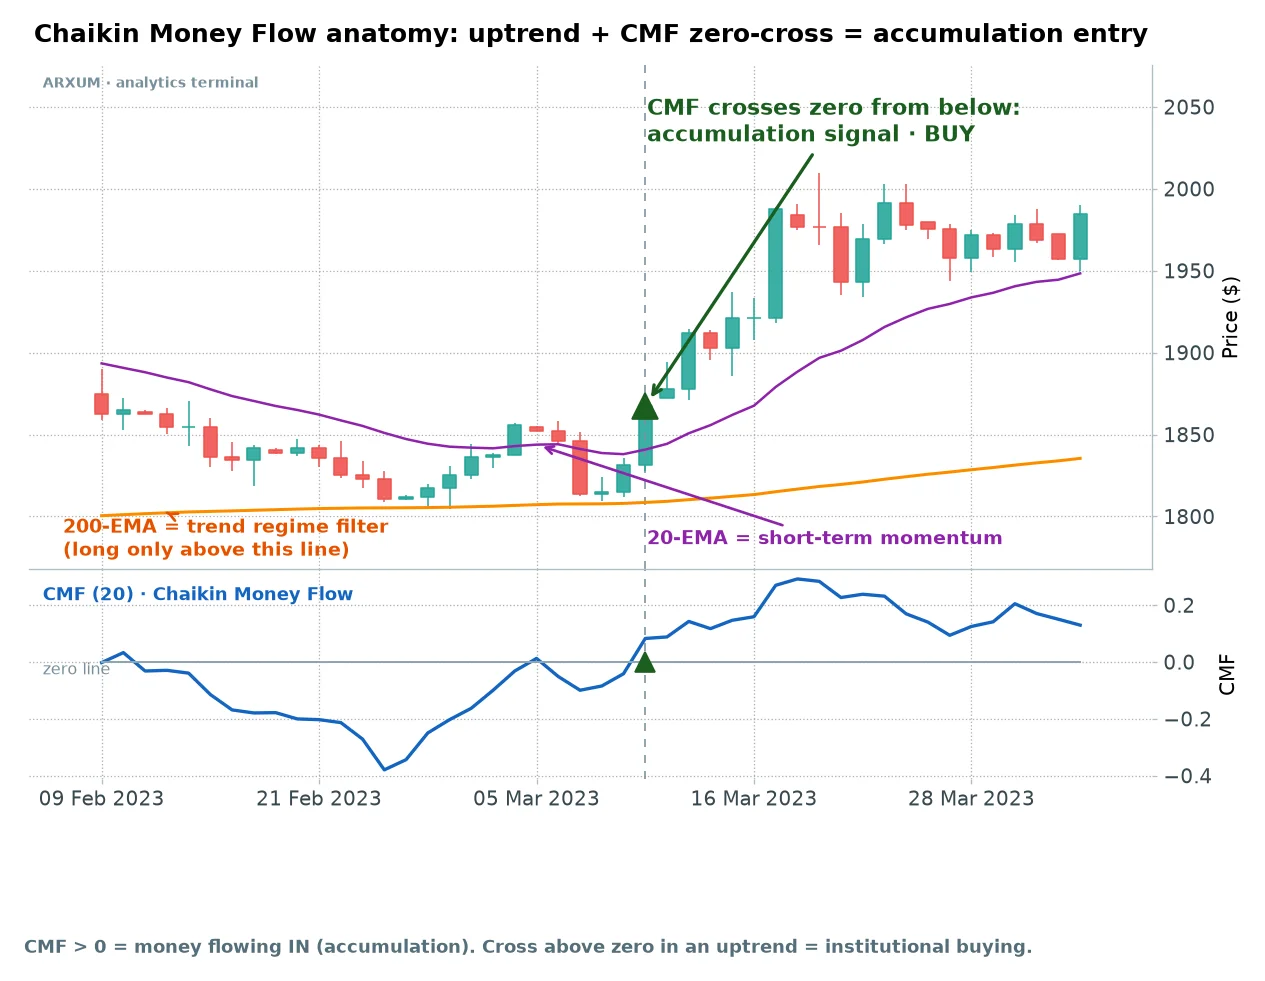
CMF lives in a panel below your chart. It swings around a center line at zero, capped at plus one at the top and minus one at the bottom.
The line spends most of its life close to zero, drifting a little above or a little below.
That sign is the whole message. Above zero, more volume is trading on up-closes than down-closes, so buyers are pushing, what the indicator calls accumulation.
Below zero, sellers are in charge, called distribution.
A steady stretch above zero often means larger players are quietly building a position rather than a few small buyers nudging price. That is the “institutional buying” the chart above points at, and it is why a cross back above zero in an uptrend is worth more than the same cross in a flat, sleepy market.
Marc Chaikin built it in the 1980s to answer one question a plain price chart hides. Is the crowd behind this move, or is price drifting on thin participation?
One thing to clear up early, because the keyword confuses people. CMF is not the same as the chaikin oscillator, which is Marc Chaikin’s other tool.
Both grow out of the same accumulation idea, but the chaikin oscillator is a fast momentum line off that data, while the CMF indicator is the bounded reading between plus and minus one that we test here.
The two lines on price in the picture are just context. The orange line is the 200-day average, which traces the long-term trend, and the purple line is a short 20-day average that shows near-term momentum.
We use the 200-day line as a filter. The 20-day line is only there so you can see the pullback.
What the money flow reading actually measures
The math is friendlier than the name. Every bar gets a score for where it closed inside its own range.
- Close near the high of the bar, and the score is close to plus one. Buyers won the bar.
- Close near the low, and it is near minus one. Sellers won it.
- Close in the middle, and it is near zero. A draw.
That score is then multiplied by the bar’s volume, so a strong close on heavy volume counts for far more than the same close on a quiet day. CMF adds up that volume-weighted money flow over the last 20 bars and divides by the total volume over those bars.
The result is the line you see, a rolling read of who has been winning, weighted by size.
The default length is 20 bars, and we left it there. It is the setting Chaikin published, and it is the one nearly every platform loads by default, so it is the honest one to test.
The two setups the data likes
Most guides stop at “buy above zero, sell below.” We ran that idea properly and two versions earned their keep. Both are long-only.
A long is simply a buy, a trade that profits when price rises. Both versions also lean on the same trend filter.
Here is the plain zero-cross:
- Regime first. Only take longs when price is above its 200-day average, the exponential moving average that traces the trend. Above a rising 200-EMA is an uptrend, and that is the only place these longs are allowed.
- The trigger. Buy when CMF crosses back up through the zero line, from below to above. Buying pressure has just taken over.
- The stop. Under the recent swing low, the lowest low of the last ten bars. The gap from your entry down to that stop is your risk, the 1 in every risk/reward figure here.
- The target. A fixed 2R, twice that risk. If you risk a dollar, you aim for two.
- The backstop exit. If neither the stop nor the target is hit, the trade closes after 30 days. CMF is a momentum read, and a signal that has not paid in a month has usually gone stale.
The second setup is the CMF pullback recovery, a slightly pickier cousin. It waits for CMF to have been clearly positive recently, then dip below zero, then cross back up.
That prior positive reading is the tell that separates a real pullback inside a trend from aimless churn around zero.
The one-line version: trade with the 200-day trend, buy the CMF cross back above zero, stop under the swing low, aim for twice your risk.
You will also meet a third variant in the charts just below, the threshold-cross. It waits for CMF to clear a small cushion past zero rather than the bare line, on the idea that a bigger reading means more conviction.
It is the shakiest of the three, and I come back to why later.
The edge, market by market
Before any single trade, here is the whole study on one chart. We ran both setups, long and short, on gold, the euro and Bitcoin, on the daily chart, net of fees, over an eight-year window.
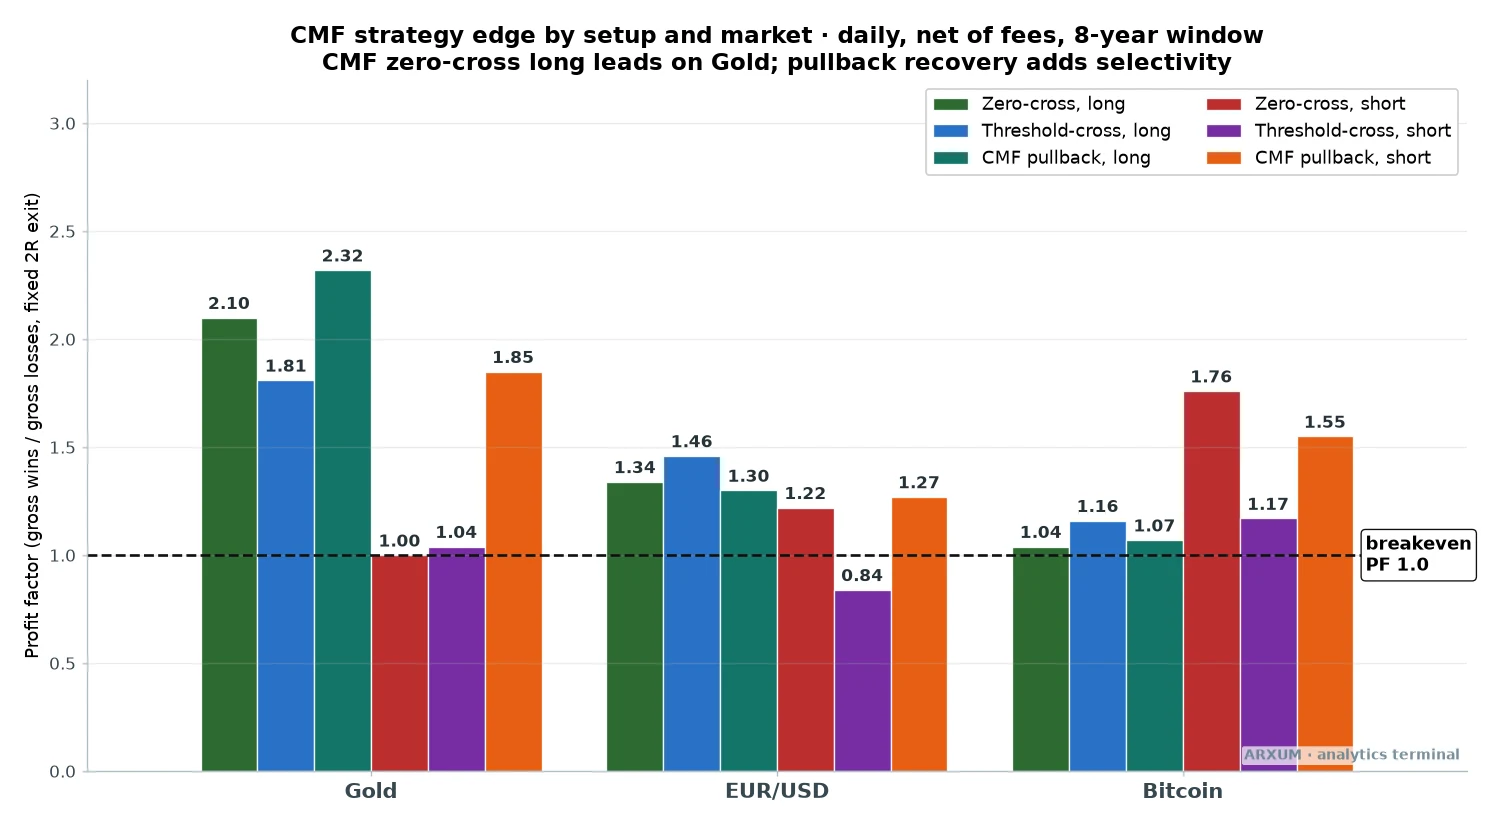
The bars measure profit factor, which is the whole strategy’s dollars won divided by dollars lost. Above the dashed line at 1.0 the setup made money, below it lost.
Read the height as how many dollars came back for each dollar the losers cost.
| Market | Best long setup | Profit factor | Trades |
|---|---|---|---|
| Gold | CMF pullback recovery | 2.32 | 37 |
| Gold | Zero-cross | 2.10 | 45 |
| EUR/USD | Threshold-cross | 1.46 | 31 |
| EUR/USD | Zero-cross | 1.34 | 34 |
| Bitcoin | Threshold-cross | 1.16 | 50 |
Gold is the standout. Both of its long setups cleared a profit factor above two, which is a genuine edge, not a rounding error.
The euro paid, but modestly. Bitcoin barely cleared breakeven on the long side.
The short setups are the honest warning, and the chart above will not let me pretend otherwise. A few short bars do clear the breakeven line on paper, the gold short among them and both euro shorts just above it.
But that is the paper reading over the whole window, not a real edge. Split those shorts onto fresh data they had never seen and the short side falls apart, the Bitcoin shorts most visibly, which I come back to later.
So the map is simple: on paper a couple of shorts printed a profit, none of them survive out of sample, and this stays a long tool with gold its best home.
Gold: the setup in the clear
Gold is where CMF shines right now, because gold has been trending hard. Spot gold (XAU/USD) ran from under $2,000 to north of $4,000 across the test window, and a momentum tool loves that kind of one-way market.
Here is one from the backtest, from the entry to the exit.
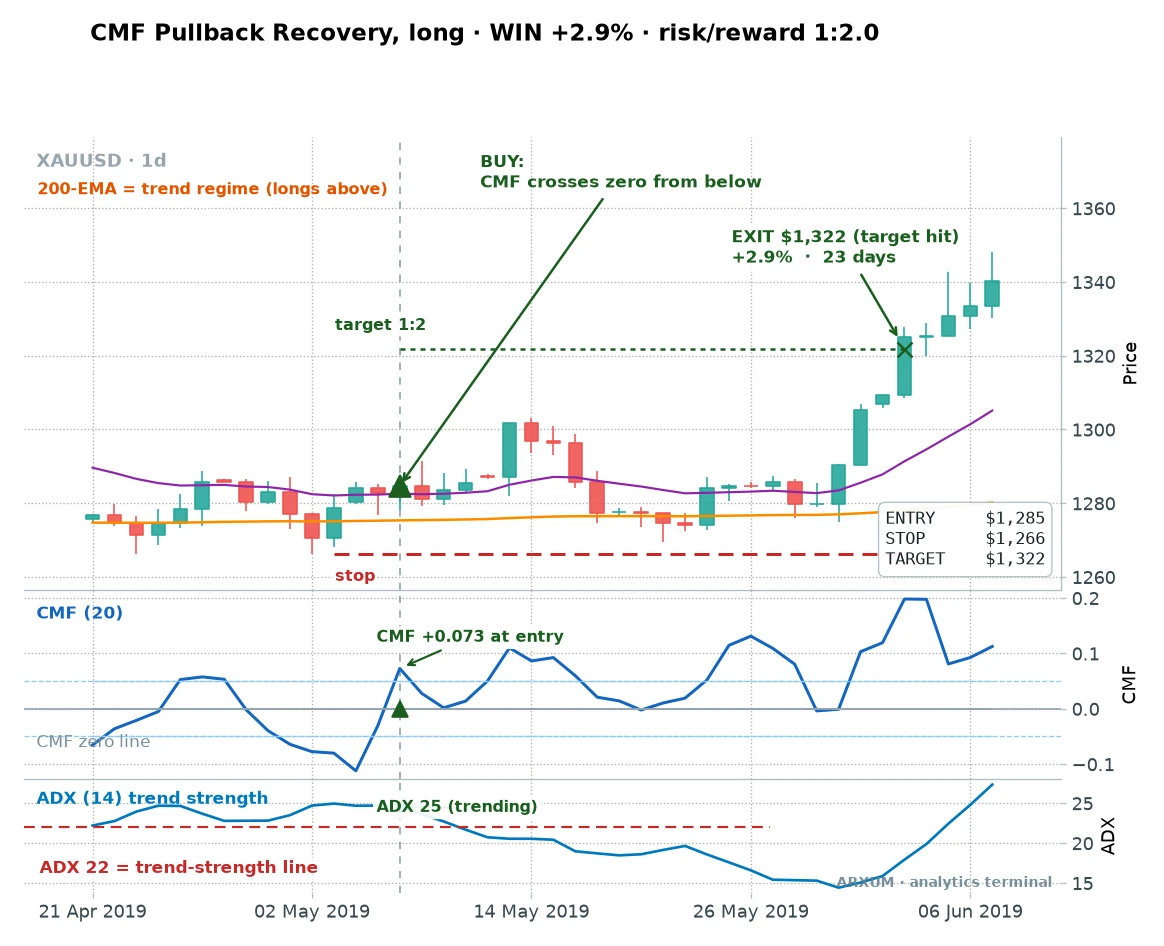
Price was grinding higher above the 200-day line, the orange one. It paused, CMF slipped under zero on the dip, then snapped back above it.
That cross is the entry, the green triangle, with CMF reading +0.073 as buying returned.
The stop went under the recent swing low, at $1,266, about $19 below the $1,285 entry. The target sat twice that distance away at $1,322, and price reached it 23 days later for a clean +2.9%.
That phrase risk/reward 1:2 is worth a slow read. The 1 is your risk, the entry-to-stop distance.
The 2 is the reward, so this winner made back twice what it would have lost if stopped. Our risk/reward ratio guide walks through it in full.
Now the filter that earns its place on that chart, the bottom panel. It is ADX, the average directional index, and it deserves a proper introduction because a beginner has no reason to know it.
- What it is. ADX is a trend-strength gauge that runs from zero up to about 60. High means a strong, committed trend; low means a limp, directionless market. It does not say up or down, only strong or weak.
- Where to find it. It is free on TradingView and built into MT4 and MT5. Add it and you get the single line you see here.
- The level we use. Above 22 counts as a real trend for this strategy. Twenty and 25 are the common textbook defaults, and we settled on 22 because that is where the edge showed up in the data.
On this trade ADX read 25 at entry, above the 22 line, so the trend was real and the CMF cross had wind behind it. That is the combination the filter is hunting for.
A second gold winner: the same shape, years apart
One trade is an anecdote. Here is the same setup off a very different market, a violent selloff that snapped straight back.
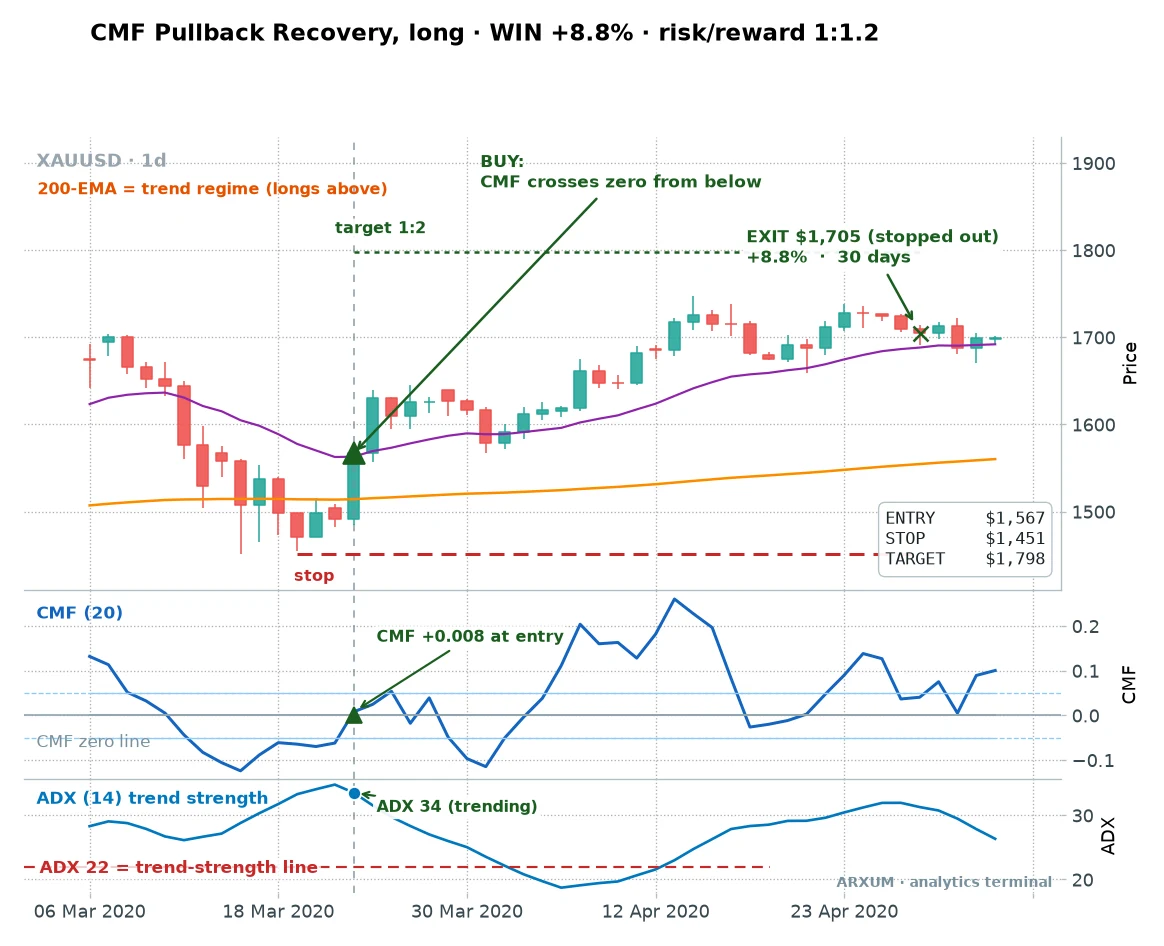
Price had crashed, then found a floor near $1,451 and turned up hard through its 200-day line. CMF crossed back above zero at $1,567, with ADX at 34, an even stronger trend read than the last trade.
This one never reached its 2R target. Instead it ground higher for the full 30 days and exited on the time limit at $1,705, up +8.8%.
The stop sat far below at $1,451, because the crash made the swing-low very wide.
That wide stop is why the chart labels this trade risk/reward 1:1.2 rather than 1:2. The reward came to about 1.2 times the risk, short of the 2R target, because the far-off stop pushed the target out of reach even as the trade paid well.
The lesson to carry: the target is a cap, not a promise. Most winners hit the 2R target, a few time out below it, and once in a while a wide-stop trade like this one drifts past what a tight target would have banked.
Does it pay over time, or is it two lucky trades?
Two charts prove nothing on their own. The real test is the full grind, so here is every pullback trade on gold, stacked into an account curve.
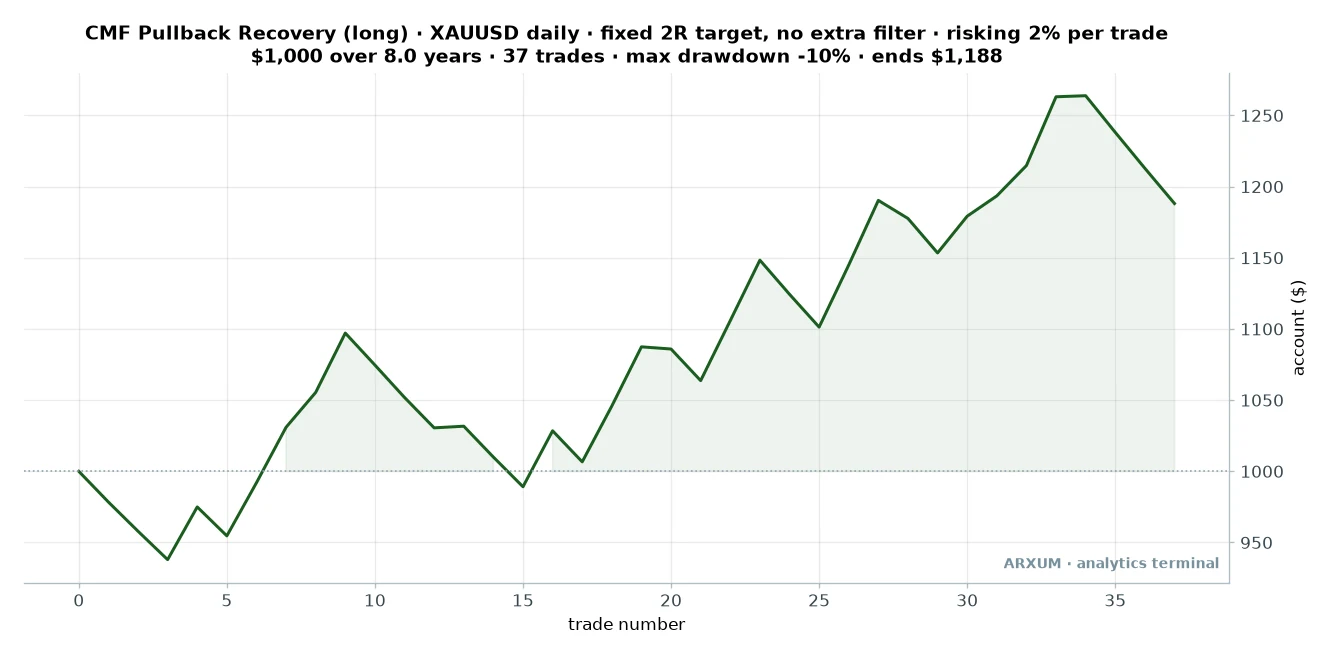
| Trades | 37 |
| Win rate | 49% |
| Reward-to-risk | 1:2 target |
| Profit factor | 2.32 |
| Max drawdown | −10% |
| Avg hold | up to 30 days |
| Net return on $1,000 | +19% |
Read the curve honestly. It is not a smooth climb.
There are flat stretches and small dips where stop after stop fires, then a trend shows up and the account steps higher.
That lumpy shape is what a real momentum edge looks like. Anyone selling you a strategy with a straight diagonal line is selling you a curve fit.
One number in the table needs unpacking. The curve is built the way you would actually trade it: a $1,000 account, 2% of it risked on every trade, position sized to the stop, fees taken out.
A full stop-out costs 2% of the account, and a trade that hits its 2R target adds about 4%.
A fair worry, when a few winners carry a low win rate, is that the whole edge is two runners. So look at the curve again.
It steps higher in several separate places, not one lucky jump, and setting aside even the single biggest winner leaves the line clearly positive. The edge is spread across many trades, not propped on one candle.
When it fails, and why I’m showing you
I am not in the business of showing only the pretty ones. Here is a loss, and it is the same setup that won above.
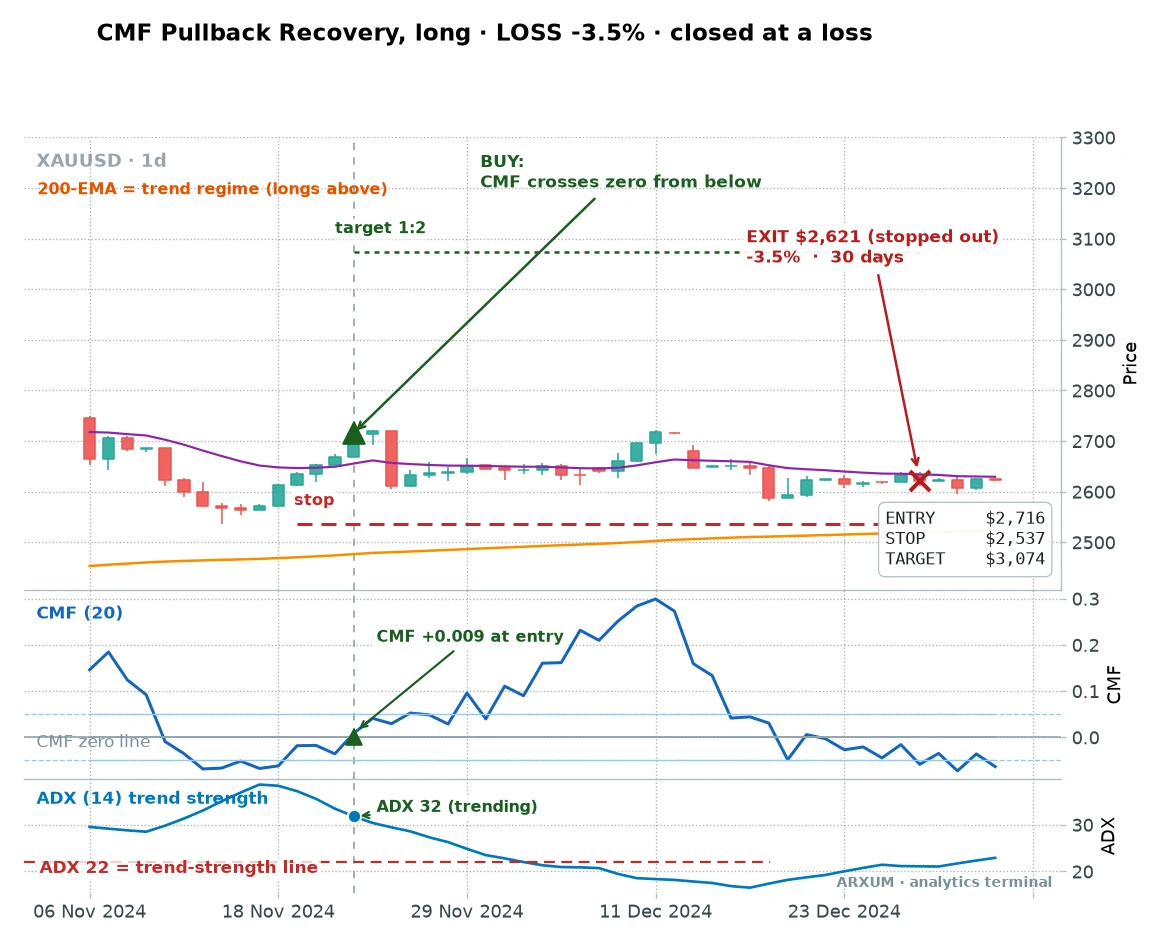
Every box was ticked. Price was above the 200-day line, CMF crossed back above zero, and ADX read 32, comfortably in trend territory.
The entry fired at $2,716.
Then it simply did not work. Price stalled, drifted lower, and 30 days later the trade closed down 3.5%, never reaching the stop below or the target above.
This is the honest part, and it matters more than a clean story. The ADX filter improves your odds across many trades, it does not screen out every loser.
This setup looked identical to the winners, and it still lost, because the trend it was riding quietly ran out.
The takeaway: a filter buys you an edge, not certainty. You win a bit under half the time and come out ahead only because the winners, capped at twice your risk, outweigh the losers, which the stop keeps small.
The filter that lifts the edge: only trade a real trend
The ADX line is not decoration. It is the single most useful add-on in the whole study, so here is what it did to the raw numbers on gold.
| Confirmation on the pullback | Trades | Win rate | Profit factor |
|---|---|---|---|
| No filter, trend regime only | 37 | 49% | 2.32 |
| ADX 22 or higher | 18 | 61% | 3.74 |
| RSI on the trend’s side | 14 | 57% | 3.46 |
| Stochastic on the trend’s side | 10 | 80% | 4.82 |
The ADX filter took the profit factor from 2.32 to 3.74. You trade half as often, but each trade is worth far more, because you are only buying the cross when the market is genuinely trending.
The other two rows are real but thinner. An RSI reading on the trend’s side lifted it to 3.46 across 14 trades, and a stochastic filter hit 4.82, but on only 10 trades, too few to lean on hard.
ADX is the one with enough trades behind it to trust.
How do you read the trend off a live chart without running any of this? Two ways.
- Watch the price. Clean higher highs and higher lows above a rising 200-day line is a trend. A flat, tangled mess is not.
- Watch the ADX line. Above 22 and rising, take the CMF cross. Below 22, the market is drifting, and the cross is far more likely to be noise.
This is the filter to actually use: take the CMF cross only when ADX confirms a real trend, and pass when it does not.
Does it travel? The euro and Bitcoin
Gold is the easy case because it trended so cleanly. The harder question is whether the edge survives on markets that behave differently.
EUR/USD is the honest stress test. The euro spent most of the window chopping sideways, the opposite of gold’s one-way run.
The zero-cross still cleared breakeven at a 1.34 profit factor, and the pickier threshold version reached 1.46.
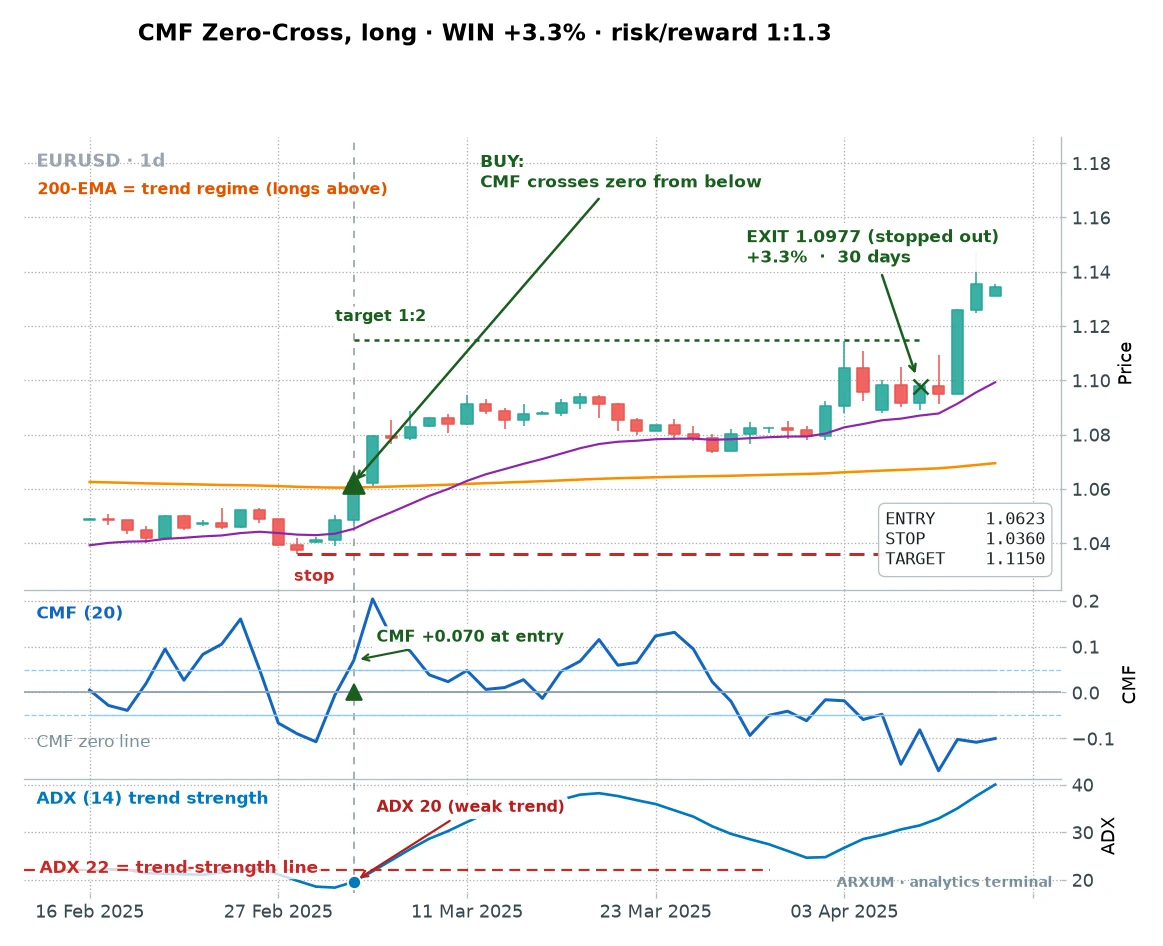
Here the euro was climbing above its 200-day line and CMF crossed back above zero at 1.0623, reading a strong +0.070. The stop went under the swing low at 1.0360, and the trade drifted up to exit at 1.0977 for +3.3%.
Notice the ADX panel read only 20 at entry, just under our 22 line. This winner slipped through with a weak trend read, the mirror of the losing gold trade that had a strong one.
That is variance being honest with you: the filter shifts the odds, it does not decide any single trade.
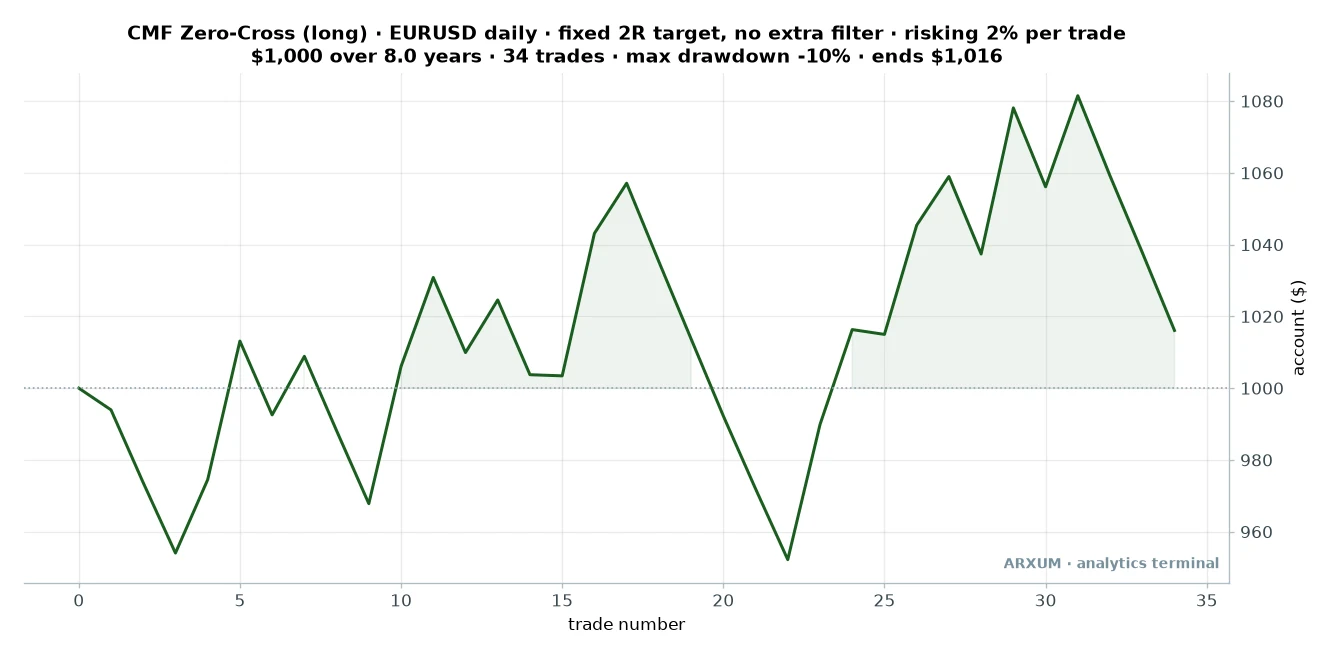
| Trades | 34 |
| Win rate | 41% |
| Reward-to-risk | 1:2 target |
| Profit factor | 1.34 |
| Max drawdown | −10% |
| Avg hold | up to 30 days |
| Net return on $1,000 | +1.6% |
Read that curve for what it is. Positive, but barely, and it spends long stretches going nowhere.
The euro simply did not trend enough over this window to hand the tool the big runs gold gave it.
Bitcoin is the other end of the spectrum, and it needs a plain warning. On the long side CMF barely cleared breakeven, a 1.04 to 1.16 profit factor depending on the setup.
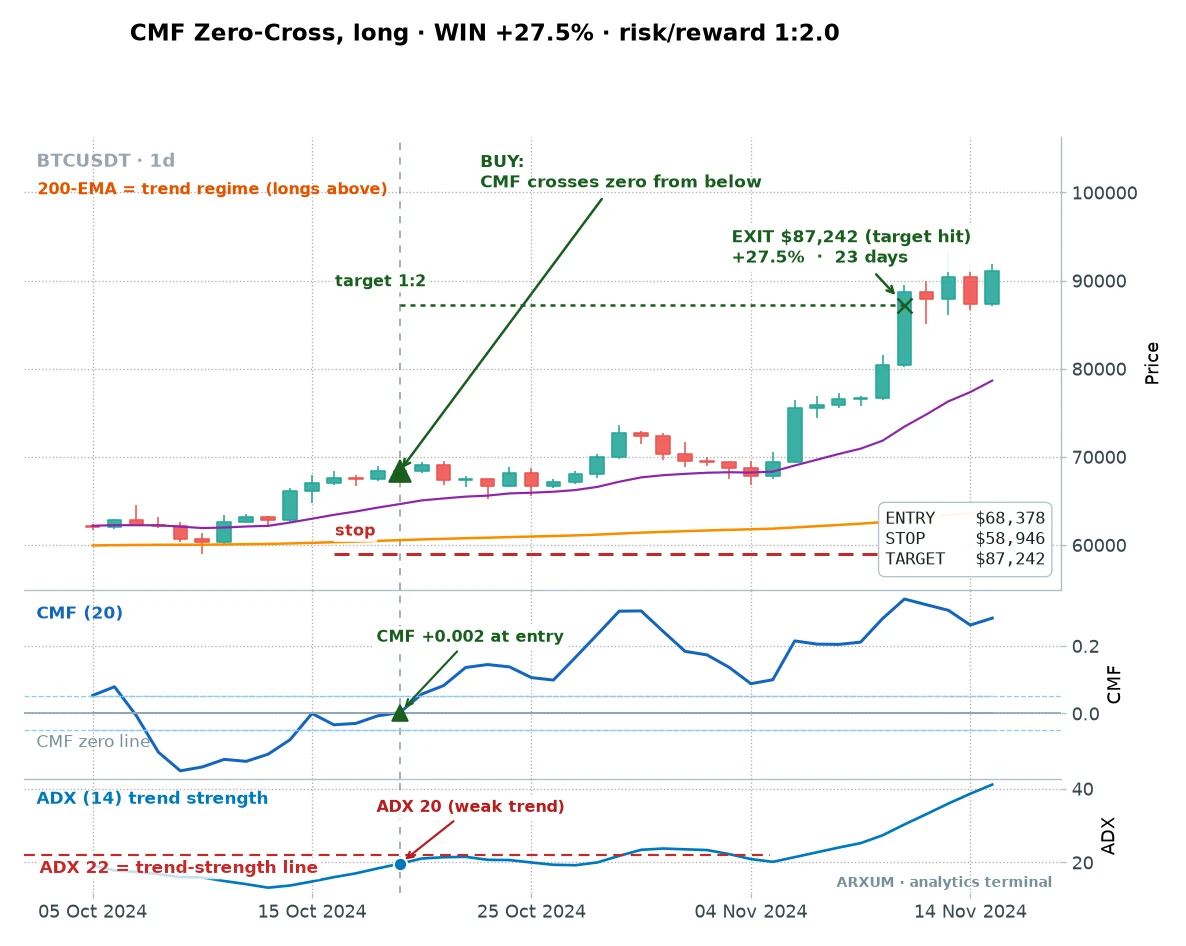
This one worked beautifully. CMF crossed back above zero at $68,378, the stop went under $58,946, and price hit the target at $87,242 for +27.5% in 23 days.
A textbook trade, though notice the ADX panel read only 20 here, a weak trend, the same reminder the euro trade gave: the filter tilts the odds, it does not promise the outcome.
But do not let one runner sell you the market. Across every Bitcoin trade the long edge is marginal, and that single win is the exception, not the pattern.
The short side looked better on paper, but its whole edge came from the old bear markets and vanished on the recent data it had never seen. Bitcoin is structurally a one-way bull asset, so on Bitcoin you use longs, and you accept the edge here is thinner than on gold.
Now the caveat that sits under every gold and euro number, and it is fair to say it plainly. CMF is a volume tool, and spot gold and the euro have no central volume feed, so those tests use tick volume, a count of how often the price updated rather than how much money changed hands.
Bitcoin’s numbers use real exchange volume. Tick volume is a proxy, and it works well enough that gold posted the strongest edge in the whole study, but it is why the cross-market picture is the proof, not any single feed.
If you want the same idea on real volume, the on balance volume and money flow index guides run the other two classic volume tools through the same engine.
Zero-cross or pullback, and the setup to be careful with
Two long setups paid on gold, and it is worth knowing when they agree. Often they fire on the same bar, and that overlap is a small confidence boost.
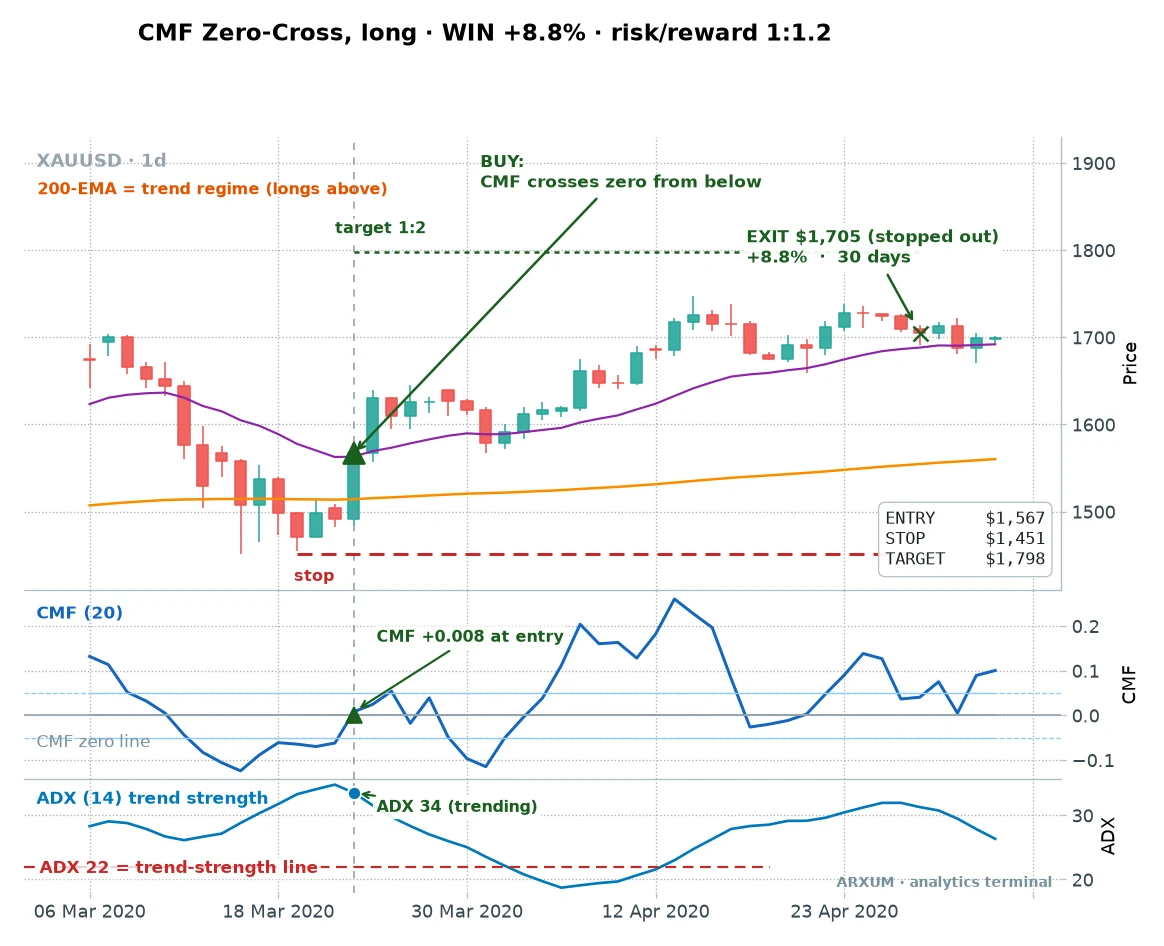
This is the same market-bottom trade from earlier, now seen through the plain zero-cross. Both rules flagged this bar, which is exactly what you want, two independent reads pointing at one entry.
So which to trade? The pullback recovery is the pickier one and posts the higher profit factor, 2.32 against the zero-cross’s 2.10, because it waits for a prior strong reading before it acts.
The zero-cross fires more often and is simpler to spot. A beginner is fine starting with the zero-cross and adding the pullback’s patience later.
There is a third variant I tested, the threshold-cross, which waits for CMF to reach plus or minus 0.05 rather than a bare zero. On the full window it looks fine, a 1.81 profit factor on gold.
Here is the catch, and it is why I am flagging it rather than recommending it.
Split that threshold setup into the first four years and the last four, and its edge lives entirely in the recent stretch. On the earlier half it actually lost money.
A setup that only works on the years that happened to trend is not an edge you can lean on, so treat the threshold version as interesting, not trusted.
Robustness: does the edge survive fresh data?
The single most useful test of any strategy is whether it holds up on data it was never built around. So we split gold’s pullback setup in half.
- Built on the first four years: a 1.74 profit factor, positive but unremarkable.
- Run on the last four years it had never seen: a 2.70 profit factor, stronger.
- The honest read: the edge did not just survive out of sample, it improved, helped along by gold’s powerful bull run in the later stretch.
Take that improvement with a pinch of salt, because a trending market flatters a trend tool. The point is not that CMF gets better every year.
It is that the setup did not collapse the moment it met new data, which is where most published strategies quietly die.
One more number worth your trust. Across the whole eight years, the worst peak-to-trough drop on the gold account was about 10%, against a buy-and-hold drawdown of roughly 27% over the same period.
You gave up some of gold’s raw return, and in exchange your worst stretch was far shallower.
Profit factor is not reward-to-risk
Two numbers in this guide both look like “1-point-something,” and beginners blur them constantly. They answer different questions.
- Reward-to-risk (1:2) is about a single trade. It is how many times its risk that one trade made back, so a 1:2 winner returned twice what it put at stake.
- Profit factor (2.32) is about the whole strategy. It is total dollars won divided by total dollars lost across every trade, so 2.32 means the system made $2.32 for every dollar it lost.
You can have a healthy reward-to-risk on individual trades and still lose overall if you win rarely enough. Gold’s pullback wins just under half the time, so it leans on the 2R target to carry a profit factor above two.
Watch one number without the other and you will fool yourself.
Sizing the trade, and placing it
Say you have a $1,000 account and you risk 2% per trade, the standard most desks use. That is $20 of risk on the trade, no more.
Take the recent gold winner. Entry was $4,440, the stop $4,274, so the risk was $166 per ounce.
The position size is one division:
- Risk budget: $20
- Risk per ounce: $166
- Position size: $20 ÷ $166 = 0.12 ounces
Here is the honest problem that division exposes. The smallest gold position most brokers offer is one micro lot, which is one ounce.
Your math says 0.12 ounces, so on a $1,000 account at honest 2% risk you simply cannot take this gold trade at a standard broker. The position is smaller than the minimum size.
That is not a flaw in the strategy. It is the reality of trading an expensive instrument on a small account, and the fix is never to widen the stop or oversize to “make it fit.” That is how a 2% plan quietly becomes a 10% plan.
So here is the same math on a market a small account can actually reach: EUR/USD, the euro against the dollar. Forex is sized in lots and measured in pips, the fourth decimal of the price, and on one micro lot each pip is worth about $0.10.
Take the real euro trade from earlier. Entry 1.0623, stop 1.0360, so the risk is 263 pips.
Same $1,000 account, same 2% rule, so $20 of risk:
- Risk budget: $20
- Risk per pip you can take: $20 ÷ 263 pips = about $0.076 per pip
- Position size: $0.076 ÷ $0.10 = 0.76 micro lots
Now the small-account honesty this exposes. That 0.76 is below the one-micro-lot minimum, so to place the trade at all you round up to one micro lot, which risks about $26, or 2.6% of a $1,000 account rather than 2%.
The clean fixes are both honest. Trade this daily setup on an account nearer $1,300, where one micro lot is exactly 2%, or size down on a market where the stop in dollars is smaller.
What you never do is stretch the risk to force the fit. For gold on a small account specifically, you would need a broker offering fractional or cent-lot sizing.
If you are starting with just a few hundred dollars, the honest plan is short. Practice this exact setup on a free demo while you build toward roughly $1,300, or open a cent-lot account so the position can shrink to fit your balance.
What you never do is force a full-size trade onto a small account just to feel like you are in the market.
One micro lot of EUR/USD is about 1,000 units of currency, roughly $1,060 of exposure. On a $1,000 account that is close to 1:1 leverage.
If your broker offers 1:100, that is just margin headroom letting you hold the position with a small deposit, not extra risk. Your risk is fixed by the stop, and the 2% rule already accounts for it.
Once your size is set, the order itself is three fields, and it is the same trade you already saw win. Here it is again, marked up as an order ticket.
So placing the order is three fields:
- Entry: a buy at market on the close that confirms CMF crossing back above zero.
- Stop-loss: in the stop field, at your swing low.
- Take-profit: at twice your risk from entry, or leave it off and exit on the 30-day rule if it stalls.
You can chart and practice all of this on a free TradingView account before a cent is at risk. In TradingView, type the ticker, click Indicators, and add Chaikin Money Flow and ADX.
In MT4 or MT5, it is Insert, then Indicators, then Volumes for CMF and Trend for ADX.
The discipline this strategy actually needs
The risk talk here is not boilerplate, because this setup has a shape you have to make peace with.
You will lose a bit more than half your trades. A win rate near 49% on gold, and 41% on the euro, means losing streaks are normal, not a sign the tool is broken.
If you cannot sit through five or six small stops without abandoning the plan, this strategy will break you, not because it stopped working but because you stopped following it.
So a few concrete habits, tied to these numbers.
- Risk the same 2% every time. Do not size up after a loss to win it back, and do not size up after a win out of euphoria. The math only holds if every trade is the same fraction of the account.
- Use a circuit-breaker. If you take five or six losses in a row, the market may have stopped trending. Pause for a week and check whether price is still making clean higher highs above the 200-day line before the next trade.
- Run a calm live-versus-data check. If your live results drift far below what the numbers here suggest, over a meaningful run of trades, that is worth noticing. One bad week is just variance, so do not panic-quit. A sustained, wide gap is a real signal to step back and look at whether the market still suits the tool.
No mechanical setup is permanent. This one is a tool for trending markets, gold most of all right now, and when the market changes character your job is to notice.
Only risk money you can afford to lose, and treat the strategy as a way to read the market, not a money machine.
Common mistakes
- Buying every zero-cross. Without the trend filter you are taking crosses in flat, drifting markets where they are mostly noise. The 200-day line and ADX are the edge.
- Fading the +100 instinct onto CMF. CMF has no fixed overbought level the way some oscillators do. A high positive reading in an uptrend is strength continuing, not a reason to sell.
- Trusting CMF on thin volume. On spot forex and gold the reading leans on tick volume, a proxy. It works, but it is why you confirm with price and the 200-day trend, not the CMF line alone.
- Leaning on Bitcoin longs. The edge there is marginal in this study. If you trade CMF on Bitcoin, keep your expectations small and your size honest.
- Widening the stop. The swing-low stop is what keeps losers near your 1. Move it to “give the trade room” and one loss can wipe out several winners.
Where to go from here, and three ready configs
CMF is one of three classic volume tools, and they teach each other. If you want the same money-flow idea on markets with real exchange volume behind it, the money flow index and on balance volume guides run the other two through this same engine.
To go deeper on the filter that powered this whole article, the ADX indicator explainer is the place to start.
If you want to put CMF to work, here are three tested configurations to lift straight off the page:
- Gold, daily, pullback recovery. Long above the 200-day line, buy the CMF cross back above zero after a dip, ADX 22 or higher, stop under the ten-bar swing low, target twice the risk. The strongest edge in the study.
- Gold, daily, plain zero-cross. Same rules without the prior-dip condition. Fires more often, a touch lower profit factor, easier for a beginner to spot.
- EUR/USD, daily, zero-cross. The same cross on the euro, above its 200-day line. A modest edge, and the honest reminder that not every market trends like gold.
The bottom line: the Chaikin Money Flow indicator is not the buy-and-sell-signal machine it is usually sold as. Buy the cross back above zero in a confirmed uptrend and you have a setup that paid on gold, held on the euro, and asks for caution on Bitcoin.
The cross gets you in the door. The trend filter is what makes it worth trading.
FAQ
What is Chaikin Money Flow, in plain terms?
Does the Chaikin Money Flow indicator actually work?
What is the best Chaikin Money Flow setting?
What does the CMF zero line mean?
What is the difference between CMF and the Chaikin oscillator?
Which markets does Chaikin Money Flow work best on?
What timeframe is best for the Chaikin Money Flow indicator?
Does Chaikin Money Flow work on Forex without real volume?
How much money do I need to start with Chaikin Money Flow?
Can I use Chaikin Money Flow to short?
What are the key terms in this guide?
Real-time trade setups with entry, stop loss and take profit. Daily market analysis. No subscription, no complicated theory.
🌍 Our recommended brokers



Quant Researcher & Systems Builder
Quantitative researcher who builds the automated systems behind Arxum strategy testing. Works in Python and Pine Script, using AI alongside classic backtesting to validate strategies on years of real data.
