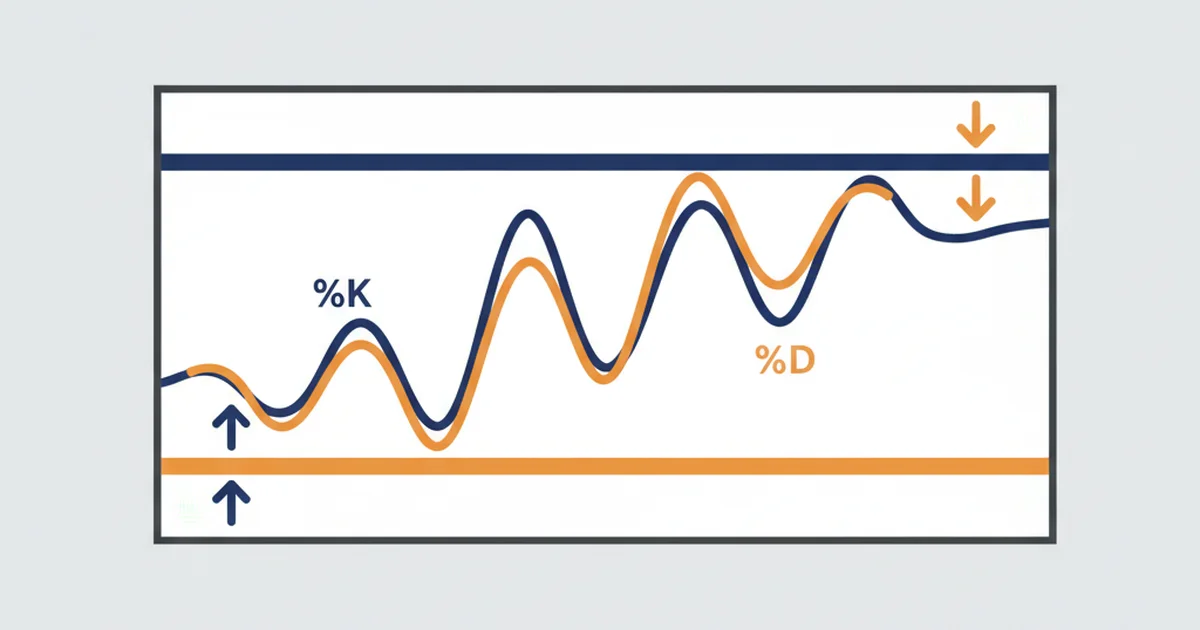

First the tool by the book, the read every beginner is taught, so you know exactly what a stochastic signal looks like. Then the part that matters: by the end you will have the version of this that actually held up over eight years of testing, not the textbook version that does not.
What the stochastic oscillator is
Before any results, here is the tool itself. One panel, two lines, a fixed 0-to-100 scale.
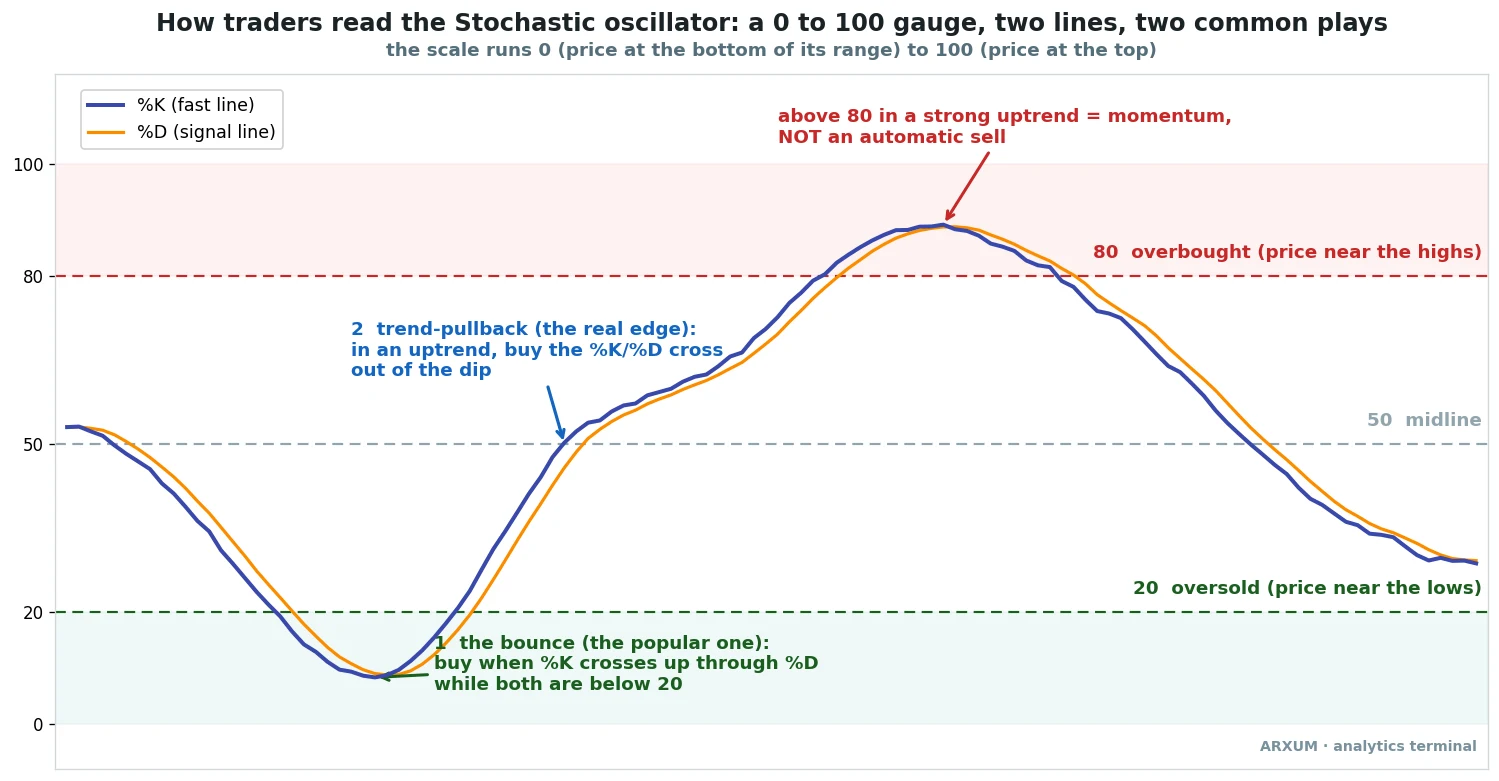
The idea is simple. In an uptrend, candles tend to close near the top of their recent range, so the line rides high. In a downtrend, they close near the bottom, so it sits low. The oscillator just turns that into a number.
- %K is the fast line. It reacts quickly to each new close.
- %D is the signal line, a 3-period average of %K. It lags a little and smooths the noise.
- 80 is the overbought band. The line near the top means price is closing high in its range.
- 20 is the oversold band. The line near the bottom means price is closing low in its range.
- 50 is the midline, a rough line between weak and strong momentum.
That is the whole anatomy. Two lines crossing each other, drifting between two bands.
Most people stop there and reach for the obvious trade: the line is below 20, so buy; it is above 80, so sell. That instinct is where the trouble starts, and it is the first thing the data corrects.
The popular read, and why it backfires
The classic stochastic trade is the oversold bounce. Wait for both lines under 20, buy when %K crosses up through %D, ride it back toward the middle. The overbought version is the mirror: sell the cross down through %D above 80.
It feels right. It is also the weakest version of the tool on a trending market.
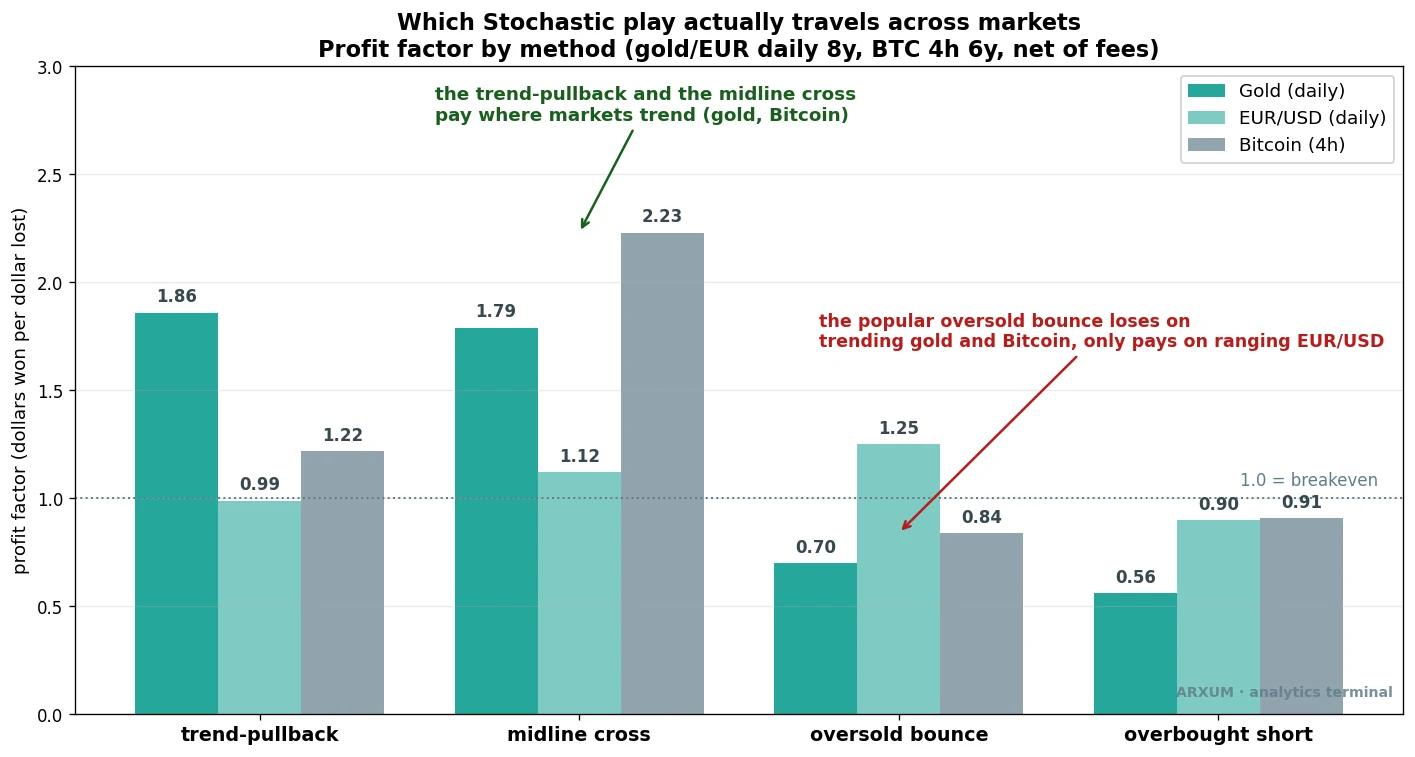
The chart needs one term first. Profit factor is dollars won for every dollar lost across the whole strategy. Above 1.0 means the play made money; below 1.0 means it bled. A profit factor of 1.5 means the system earned $1.50 for each $1 it gave back.
Now read the bars. On spot gold (XAU/USD), daily, over eight years, the oversold bounce scores a profit factor of 0.70, below breakeven. On Bitcoin it is 0.84, also a loser. The only market where it clears 1.0 is the euro, at 1.25, and the reason is the whole lesson of this piece.
Here is what is happening. When gold is in a strong uptrend, the stochastic spends weeks pinned above 80. Every dip to 20 is not a reversal coming, it is a brief pause inside a move that keeps going. Fade those signals and you are shorting strength and buying into chop.
The bands do not call tops and bottoms. They tell you where price sits in its range, nothing more. A market decides whether that reading means “reversal” or “carry on,” and most of the time it means carry on.
The settings, and the one filter you need first
Before the chart examples, two things to set up, because both appear on every chart that follows.
The stochastic settings. They are written as three numbers, the default being 14, 3, 3. The first is the lookback for %K, the second the smoothing for the %D line, the third an extra smoothing step. That default is the slow stochastic, and it is the right starting point for the daily-chart trades here. We get into fast versus slow later, but for now: leave it on 14, 3, 3.
The ADX filter. Every working version of this method leans on one extra reading, so meet it now rather than piecing it together off the charts. ADX is a trend-strength gauge that runs from 0 to 100. It does not say which way price is going, only how strongly it is moving. A low ADX means a flat, drifting market; a high one means a real trend with direction behind it.
You can add it free on TradingView, the same place you load the stochastic, by searching “ADX” or “Average Directional Index” in the indicators list. It draws in its own panel under price.
The level matters. Common cutoffs are 20 and 25; our testing settled on 22 as the line between chop and a real trend. Above 22, the move has enough direction to trust; below it, the market is drifting and the odds drop. On the charts below, the bottom panel is always the ADX line with that 22 level drawn, and a dot marking its value at the signal. Now the method.
The play the data actually rewards
So if fading the bands fails, what works? The same %K/%D cross, but pointed with the trend instead of against it.
We call it the trend-pullback. The rule set is short.
- Trend first. Price has to be above its 200-period moving average. A moving average is just the average close over the last 200 bars; above a rising one is an uptrend, and in an uptrend you only look for buys.
- Wait for the dip. Let the stochastic fall into the oversold zone. That is your pullback inside the larger trend.
- Enter on the cross. Buy when %K crosses back up through %D coming out of that dip.
- Exit at the top band. Close when %K reaches the overbought 80 level.
You are not fighting the trend. You are buying the trend on sale, when momentum has briefly cooled and is turning back up.
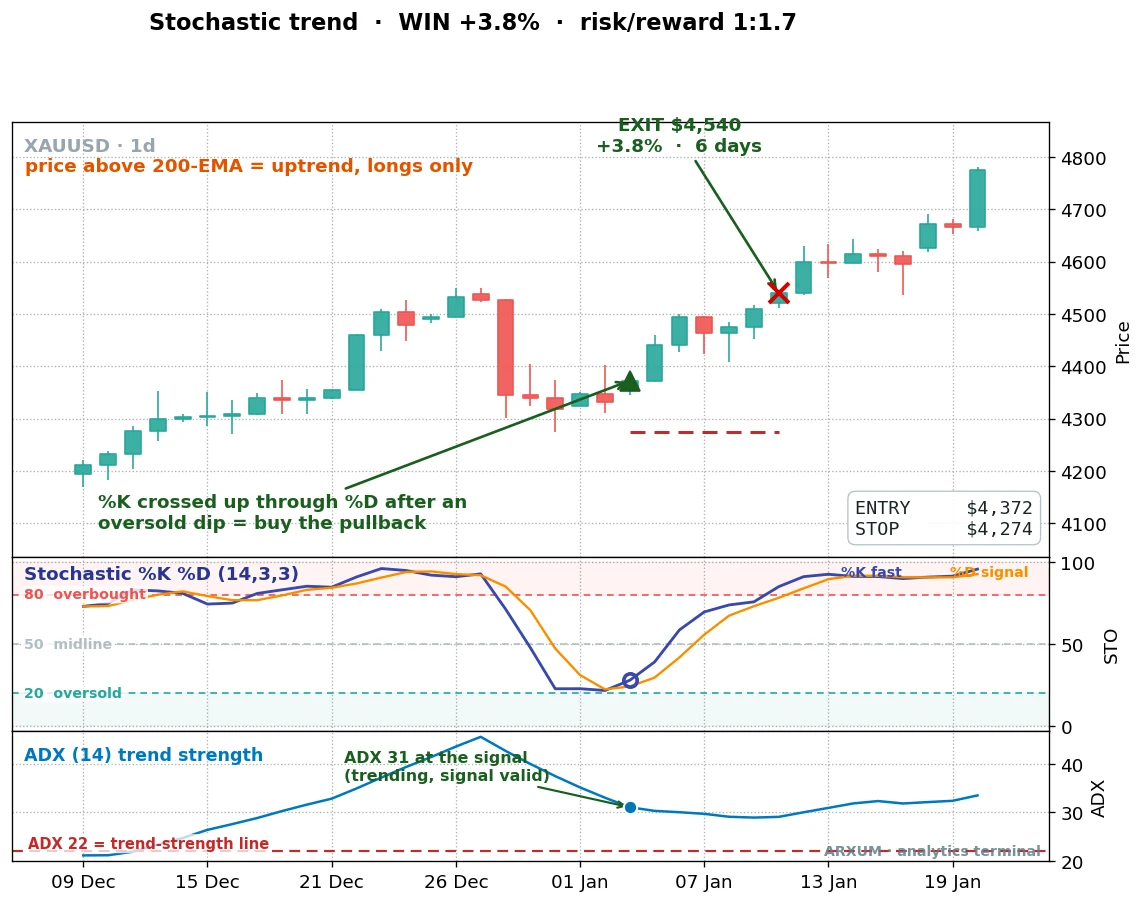
This is spot gold (XAU/USD) on the daily chart. Price is above its 200-day average, so longs only. The stochastic dips under 20, the two lines cross back up, and the entry goes in near $4,372.
Check the bottom panel, the ADX. Here it reads 31, comfortably above the 22 line, so the pullback is happening inside a genuine trend. That is exactly the condition this play wants, and the dot on the chart marks the reading at the entry bar.
Six days later the line tags the top band and the trade closes near $4,540. That is +3.8%, at a reward of 1:1.7.
That last number needs a plain definition, because beginners mix it up with profit factor. Reward-to-risk, written 1:X, is per trade: the 1 is the distance from your entry to your stop, the X is how many times that distance the trade earned. A 1:1.7 means the winner made 1.7 times what you were risking. Profit factor is the whole strategy; reward-to-risk is the single trade, and our reward-to-risk guide works through the 1:X math in full.
How it performs over the full run
Two example trades prove nothing on their own. The honest test is the grind: every signal, in order, compounded.
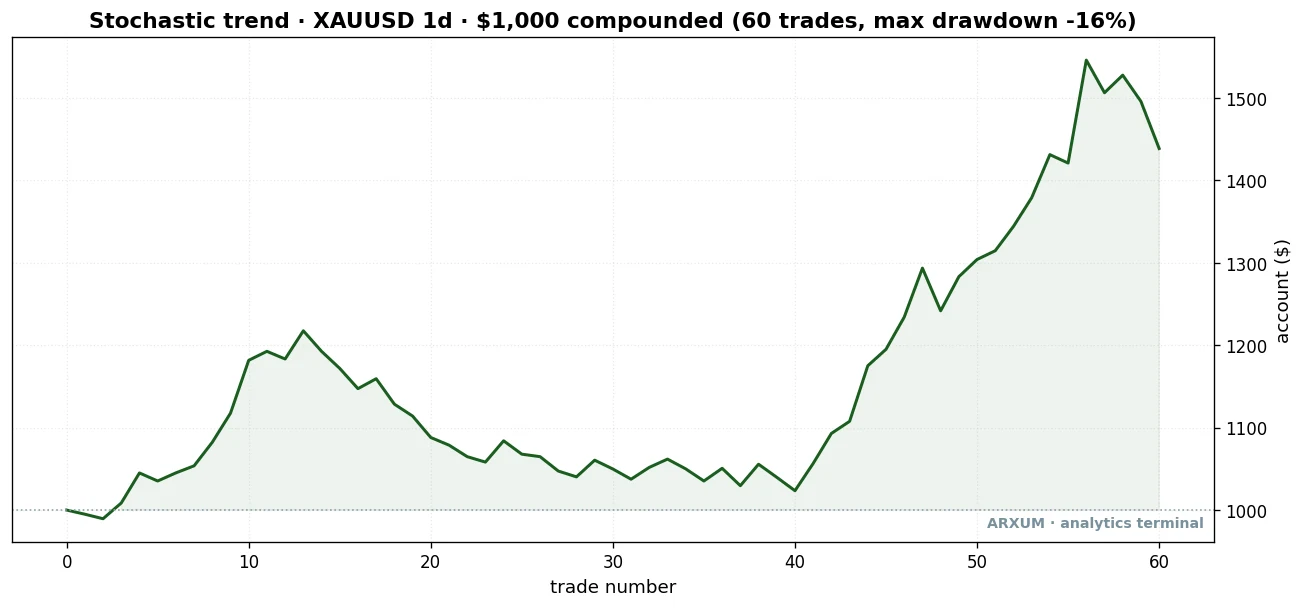
Read that curve in plain terms. The line is the account balance: what this exact method, the slow 14/3/3 trend-pullback on daily gold, did to a starting $1,000 over eight years. It is not a smooth ride, with a long flat stretch in the middle where the method just treads water, then a strong run as gold trended hard, ending near $1,439. The jaggedness is the point: a real edge grinds, it does not climb in a straight line.
| Trades | 60 |
| Win rate | 52% |
| Reward-to-risk | 1:1.7 |
| Profit factor | 1.86 |
| Net return on $1,000 | +44% |
A profit factor of 1.86 means the play earned $1.86 for every dollar it lost. The win rate, the share of trades that closed green, is barely over half, which is fine. The winners run a touch longer than the losers, so a 52% hit rate still compounds.
One number needs pinning down before you read on. That 1.86 is the trend-pullback on its own, every signal taken. The 5-step recipe later adds the ADX filter, and gating entries on ADX above 22, which is what the recipe tells you to do, lifts the profit factor to 2.92 while trading less often. So 1.86 is the floor if you take every cross; following the steps trades fewer, stronger setups for a better result. Every headline number here is the unfiltered version, so you always know the worst case.
One more number sits in that chart caption: drawdown. That is the deepest peak-to-valley dip the account suffered, the worst stretch you would have had to sit through. Here it was -16%, about a sixth of the account’s high given back before it recovered. That is the price of the return.
Does the edge hold up out of sample? We split the eight years in half. The play was profitable on the first four years it was built on, then stayed profitable on the second four it had never seen, with the profit factor improving from 1.6 to 1.99. An edge that survives data it was never fit to is one you can lean on, and this one did.
A second trade, so the pattern is clear
One winner could be luck. Here is another, a year earlier, so you can see the same shape repeat.
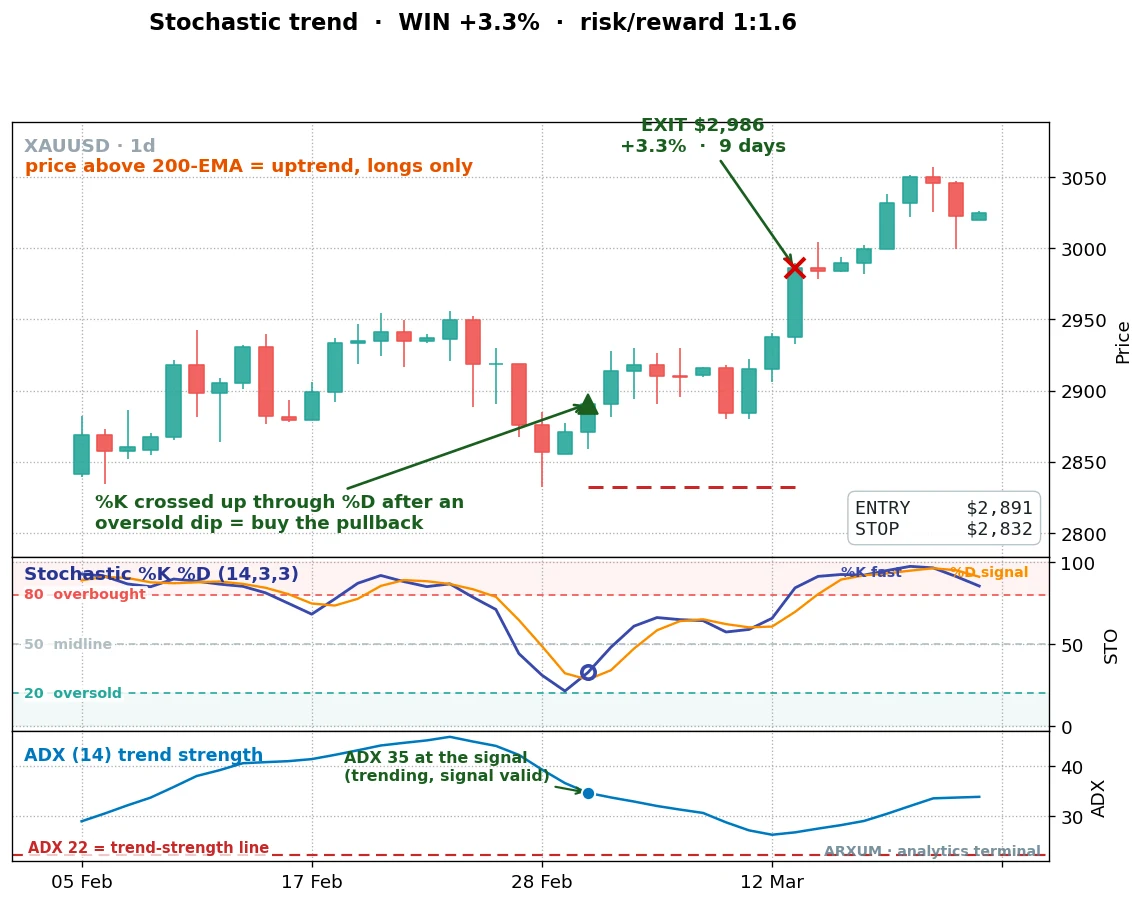
This is spot gold again, earlier in the same long uptrend. Same checklist, same picture. Price is above the 200-day average, the stochastic drifts down into the oversold zone, and the two lines cross back up out of it. The entry goes in near $2,891, with the stop just under the swing low at $2,832.
The ADX panel reads 35 here, a stronger trend than the first example. That is the filter doing its job: a high ADX is the green light, and the trade that follows is a textbook one.
Nine days later the stochastic climbs into overbought and the position closes near $2,986. That is +3.3%, and you can check the reward yourself: the risk was $2,891 minus $2,832, about $59, and the trade earned $2,986 minus $2,891, about $95. That is $95 ÷ $59 ≈ 1.6, a 1:1.6 reward. Notice the two entry prices too, $2,891 and $4,372, the gold bull run in two numbers, exactly the trending backdrop this play was built for.
The confirmation is found, not assumed
Here is the part that separates this from the average indicator guide. Most articles bolt the same three filters onto every setup: volume, a moving average, and a relative strength reading. We tested a wide menu instead and kept only what each market actually rewarded.
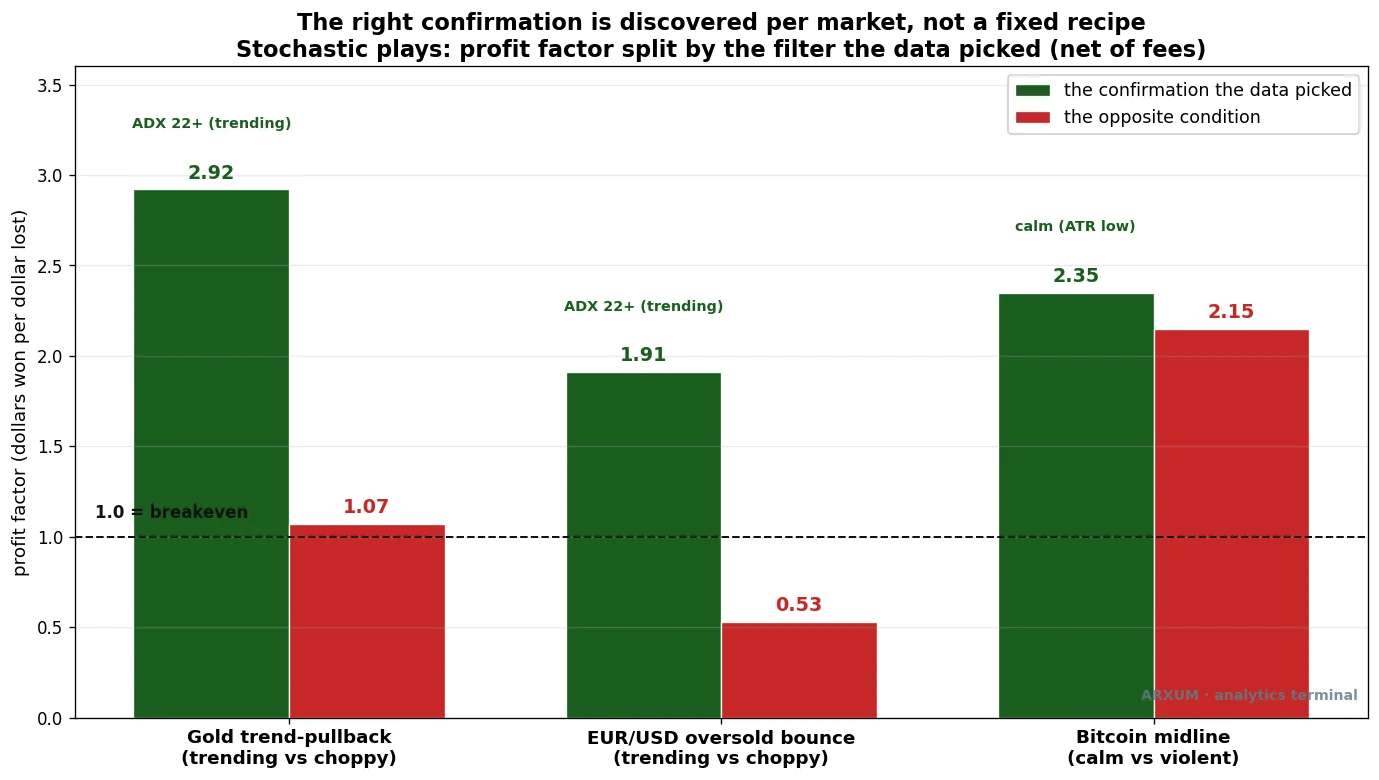
The answer was different for each market.
- Gold trend-pullback wanted the ADX trend-strength filter. With ADX above 22, the profit factor jumps to 2.92. When ADX is weak, below 22, it falls to 1.07, barely breakeven. The takeaway: take the pullback only when the trend behind it is real.
- The euro bounce also wanted ADX above 22, lifting it to 1.91 versus 0.53 in chop. On a ranging pair, a strong swing is worth fading back; a flat drift is not.
- Bitcoin wanted calm volatility, not a trend reading at all. Its best variant scored 2.35 when the market was quiet.
How do you read these conditions off a live chart? ADX sits in its own panel under price; when its line is climbing past 22, the move has direction. Calm volatility shows up as candles shrinking and the range tightening, the opposite of wild news-day bars. You do not need a fixed recipe, just the discipline to match the filter to the market in front of you.
Volume, the filter everyone reaches for first, barely mattered here. On gold it only fired on a handful of trades, too few to trust. That is the point: the confirmation is discovered, not assumed. The Supertrend guide found the same surprise on a trend-following tool, where a calm market, not volume, was the real edge.
Where the bounce does work: ranging markets
The trend-pullback is the lead, but it leaves out the trader the bounce was made for. Most readers trade Forex, and the euro is the most-traded pair on the planet. So where does the famous oversold bounce earn its keep? On a market that ranges instead of trends.
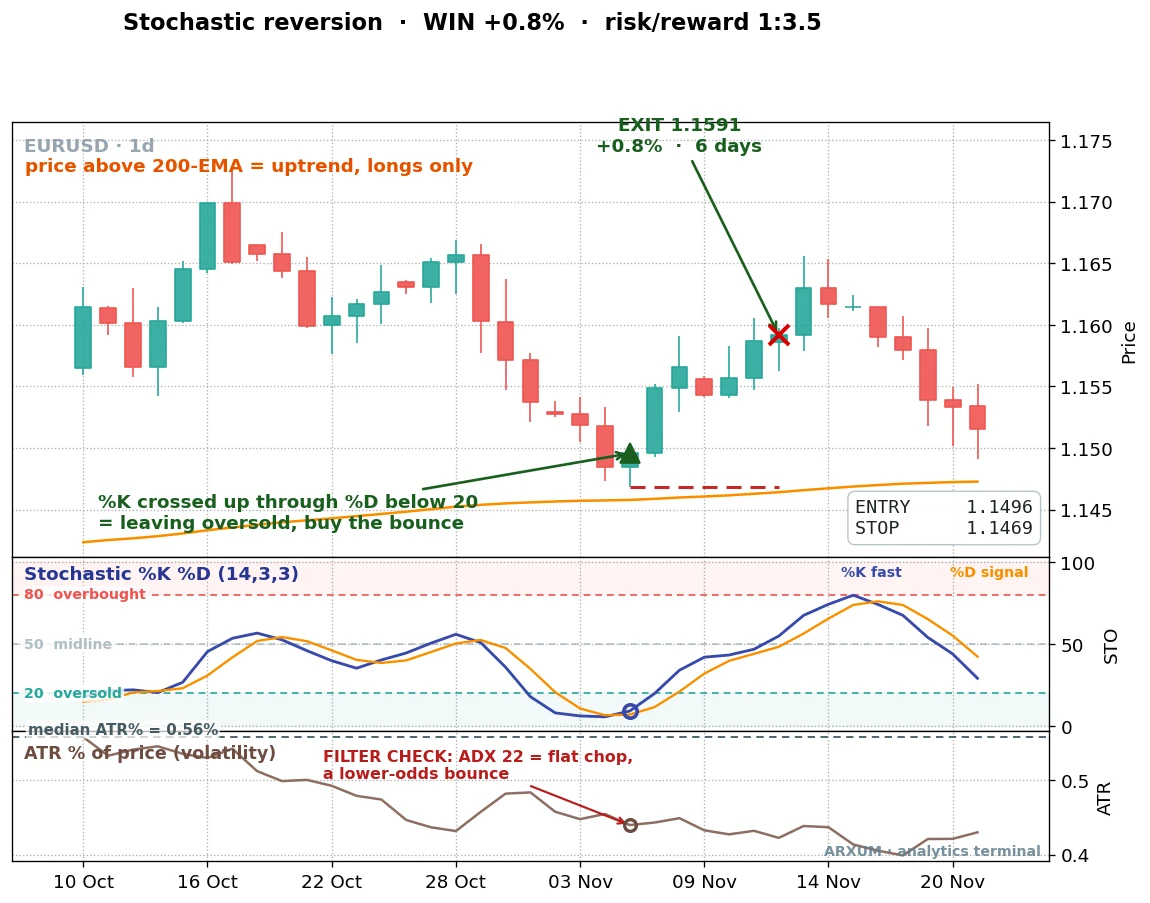
This is EUR/USD on the daily chart. The pair has spent weeks chopping sideways, with no strong trend pulling it one way. The stochastic drops under 20, the lines cross up, and the bounce carries price back toward the middle of its range. The reward came in at 1:3.5, a small win in percent but a clean one in risk terms.
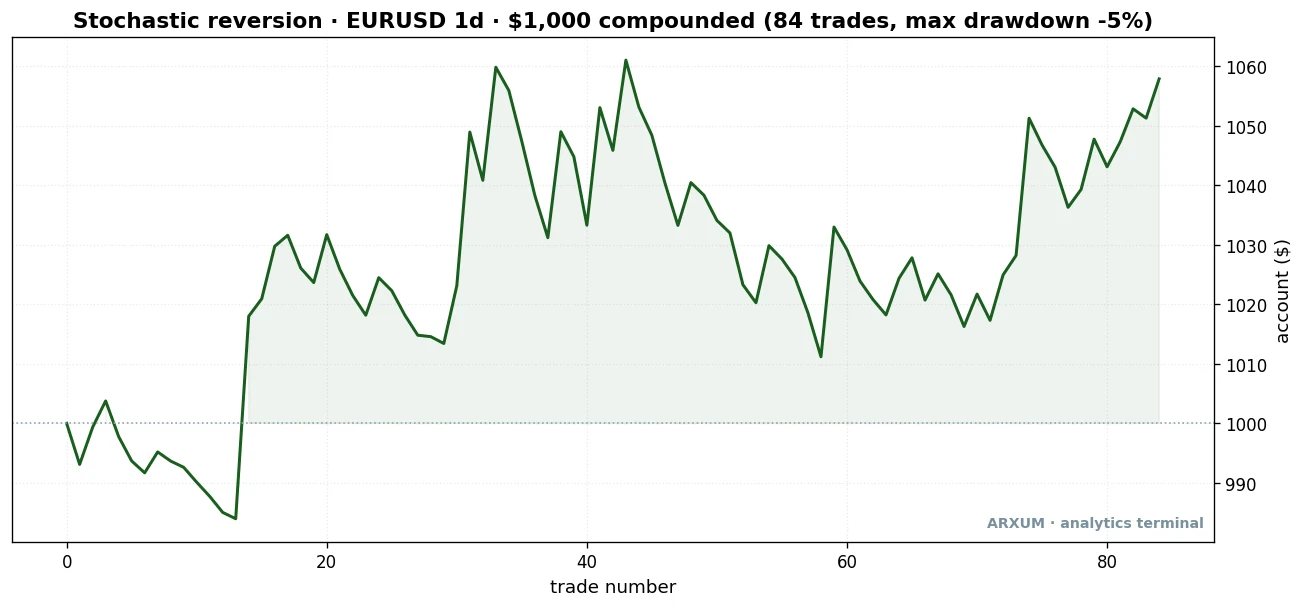
This curve is the same idea as the gold one, but for the bounce, the slow 14/3/3 stochastic on daily EUR/USD over eight years. It is a shallow, choppy climb that barely lifts off the starting $1,000. That flatness is honest: the bounce on the euro is a slow grinder, not a home-run machine, and the chart is telling you so plainly.
| Trades | 84 |
| Win rate | 36% |
| Reward-to-risk | 1:2.3 |
| Profit factor | 1.25 |
| Net return on $1,000 | +6% |
A profit factor of 1.25 over eight years, with a 36% win rate, the share of trades that closed green. That looks unexciting on paper. Read it the right way, though: it is thin but positive, low-frequency, and the drawdown was a gentle -5%, the easiest of the three plays to sit through. Add the ADX filter and the profit factor climbs to 1.91, the same trend-strength tell that helped gold, used here to skip the dead, flat stretches.
Do not let the modest table talk you out of it. For a beginner on a small account, the euro is the market you can actually afford, and a low-frequency, positive, shallow-drawdown setup is the right place to learn the mechanic without much can go wrong. The big percentage gains come later, on bigger size, once the process is second nature.
The lesson is not “gold beats the euro.” It is that the market picks the play. A trending market wants the pullback; a ranging market wants the bounce. The same two lines, read for the conditions in front of them.
The short side works the same way
Everything so far has been a buy, but the method is symmetric. In a downtrend, you mirror it: sell when %K crosses down through %D out of the overbought zone. On Forex a short is just a sell, with no borrowing or extra cost, so there is nothing special to learn beyond flipping the rules.
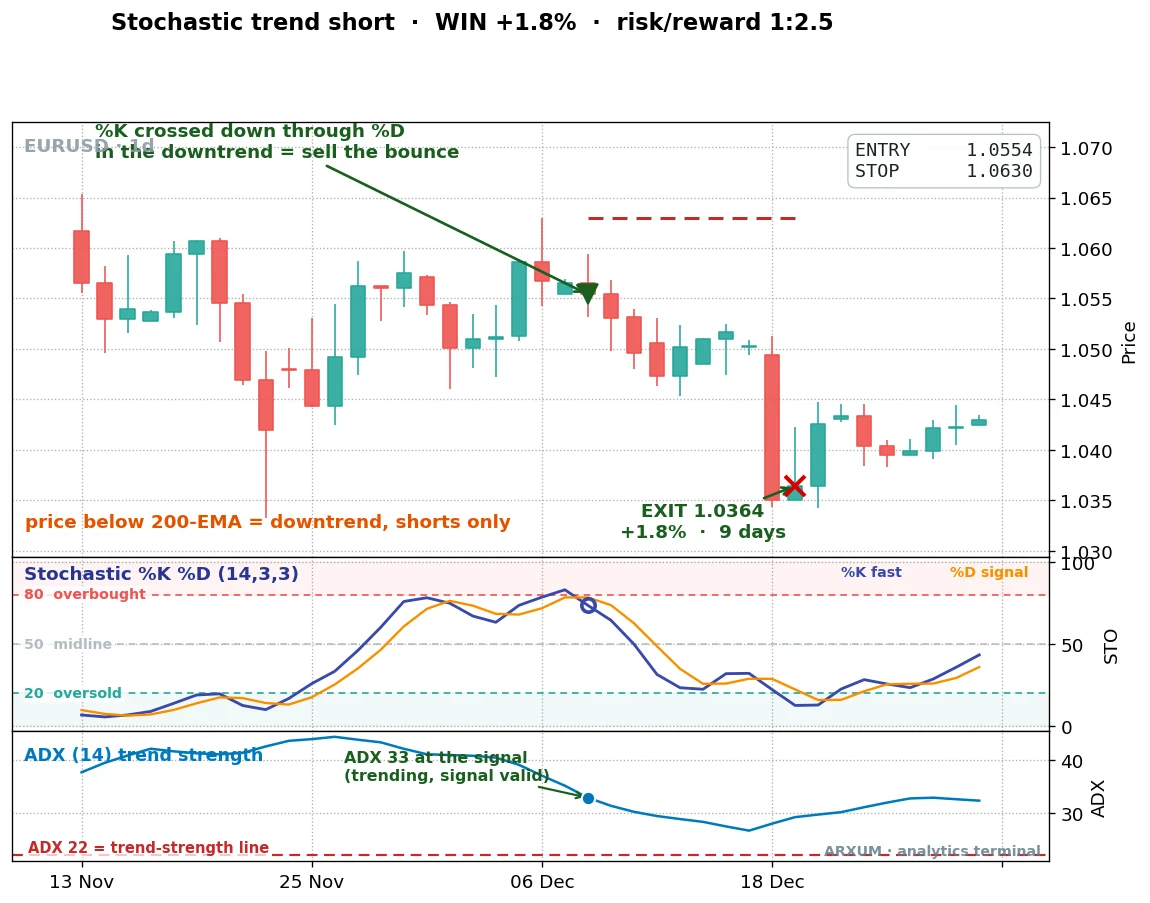
This is EUR/USD on the daily chart, with price below the 200-day average, so a downtrend, shorts only. The stochastic climbs into overbought, the two lines cross back down, and the sell goes in near 1.0554. The ADX panel reads 33, a real downtrend behind the signal. Nine days later price has fallen to 1.0364 and the trade closes for +1.8% at a 1:2.5 reward, the same checklist as the long, pointed the other way.
One more variant, with a warning
There is a third read worth a mention, not a deep dive: the midline cross, buying when %K pushes up through the 50 line in an uptrend. On Bitcoin, 4-hour, it posted the highest raw profit factor of all, 2.23, but that number is carried by a few enormous trend rides and comes with a -28% drawdown. It is a volatile, low-win-rate momentum play for a patient trader in a trending market, not a steady earner. Stick with the trend-pullback and the bounce; treat the midline cross as an advanced option once those are second nature.
Slow versus fast: which settings hold up
“What settings should I use” is the most common stochastic question, so we tested it directly rather than guessing.
We used the slow 14/3/3 throughout, but it is worth seeing why. The slow stochastic is the platform default, with that extra smoothing step baked in. The fast stochastic drops it, so it reacts quicker and whips around more. The question is which one actually trades better.
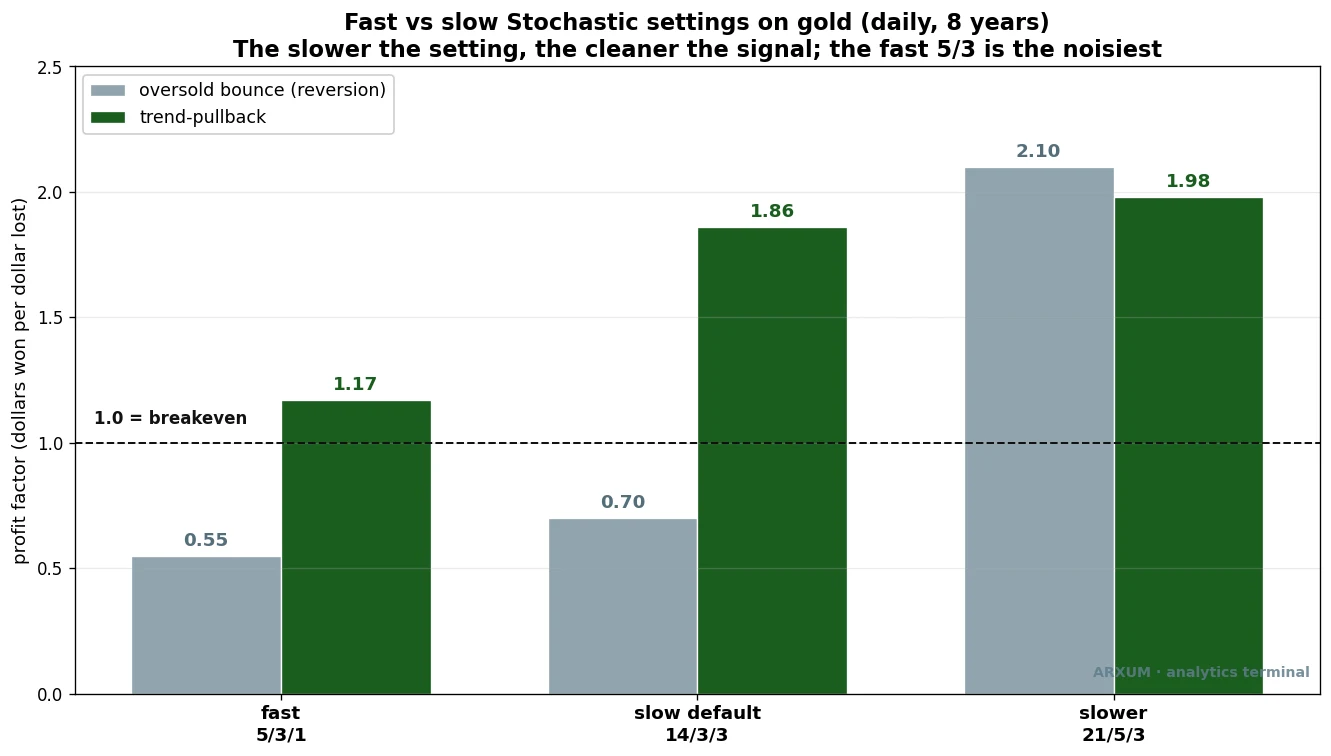
The chart tells the story without a wall of figures. The fast 5/3 setting is the noisiest, the worst performer on both plays. The slow default 14/3/3 is the clear improvement, and the slower 21/5/3 holds up too.
One bar can mislead, so read it carefully. The tallest bar is the oversold bounce on the slowest 21/5/3 setting, and it is not a green light. Slowing the stochastic that far leaves very few signals, on too small a sample to trust, and it does not change the core finding: the bounce is still the wrong play on a trending market. The trend-pullback bars are the ones to follow.
The rule of thumb: the faster the setting, the more false signals you take. For swing and position trades on the daily chart, the slow default 14/3/3 is the right starting point. Faster settings suit shorter charts but demand far tighter filtering, because most of what they flag is noise.
The stochastic indicator, explained next to its cousins
A common beginner question is how the stochastic indicator differs from the other momentum tools, since they all live in a panel under price and all flag overbought and oversold. The short version: they measure different things, and that changes when each one shines.
- The stochastic measures price position. Where did this close land inside the recent high-low range? It is fast and twitchy, which is why it suits pullback timing and ranges.
- The relative strength index, RSI, measures the size of recent gains against recent losses. It is smoother and slower to swing, so it reads cleaner during strong directional moves.
- MACD measures the gap between two moving averages. It is a trend-momentum tool, best when a market is clearly heading one way.
In practice they pair well rather than compete. A common combination is a slower tool like RSI or MACD for the trend direction, and the faster stochastic for the entry timing inside it. That is essentially what the trend-pullback does: the 200-day average sets the direction, the stochastic times the dip.
One myth worth killing here. People treat the stochastic as a reversal predictor, a tool that calls the exact top or bottom, and it is not. It is a timing tool inside a trend you have already identified, not a trend detector on its own. Used that way it earns its keep. Used as a crystal ball, it bleeds.
How to trade the pullback in five steps
Say you want to put the gold trend-pullback to work. Here is the full sequence, from chart to order ticket.
- Set the chart. Daily candles, the stochastic at 14, 3, 3, plus a 200-day moving average on price. Free charting on TradingView covers all of it.
- Check the regime. Price above a rising 200-day average means uptrend, longs only. Glance at the ADX panel; you want it above 22, a real trend.
- Wait for the dip and the cross. Let the stochastic fall under 20, then watch for %K to cross up through %D coming out of that zone.
- Place the order. Enter at the close of the cross candle. Put your stop just below the recent swing low. Set your take-profit to close when the stochastic reaches 80.
- Manage one position at a time. This setup is selective. On a single market you might see a handful of valid trades a year, so scan several markets to keep your sample up.
Now the sizing, worked in plain money and in the lots you actually click.
The standard risk rule is 2% of the account per trade. On a $1,000 account that is $20 of risk. Start with the gold example: entry near $4,372, stop near $4,274, a stop distance of about $98 per ounce.
- Risk budget: $1,000 × 2% = $20
- Risk per ounce: $4,372 − $4,274 = $98
- Size in ounces: $20 ÷ $98 = 0.20 ounces
Gold is sized in lots, where one micro lot is 1 ounce, so that 0.20 works out to a fifth of a micro lot, below even the smallest tradeable size. The honest read: on a $1,000 account, at proper risk, this exact gold trade is too small to place. You would need a broker offering fractional or cent-lot sizing.
This is exactly why the euro is the better market to start on, so here is that bounce sized in full. Forex is measured in pips, where a pip on EUR/USD is the fourth decimal, 0.0001, and one micro lot (1,000 units of the pair) is worth about $0.10 per pip. Take the bounce example: entry 1.1496, stop 1.1469. The stop distance is 0.0027, which is 27 pips.
- Risk budget: $1,000 × 2% = $20
- Risk per pip you can afford: $20 ÷ 27 pips = $0.74 per pip
- Size in micro lots: $0.74 ÷ $0.10 per pip = about 7 micro lots (0.07 of a standard lot)
That is a real, placeable trade on a $1,000 account, which the gold version was not. Seven micro lots, a 27-pip stop, $20 at risk. The euro lets the same 2% rule actually fit the order ticket, and that is the whole reason a beginner learns the mechanic there first.
That is not a flaw in the method. It is the reality of trading an expensive instrument on a small account, and it is better to know it before the trade than after.
When it fails, and how to stay sane
No edge wins every trade, and this one loses plenty. Here is a real loss, so the picture stays honest.
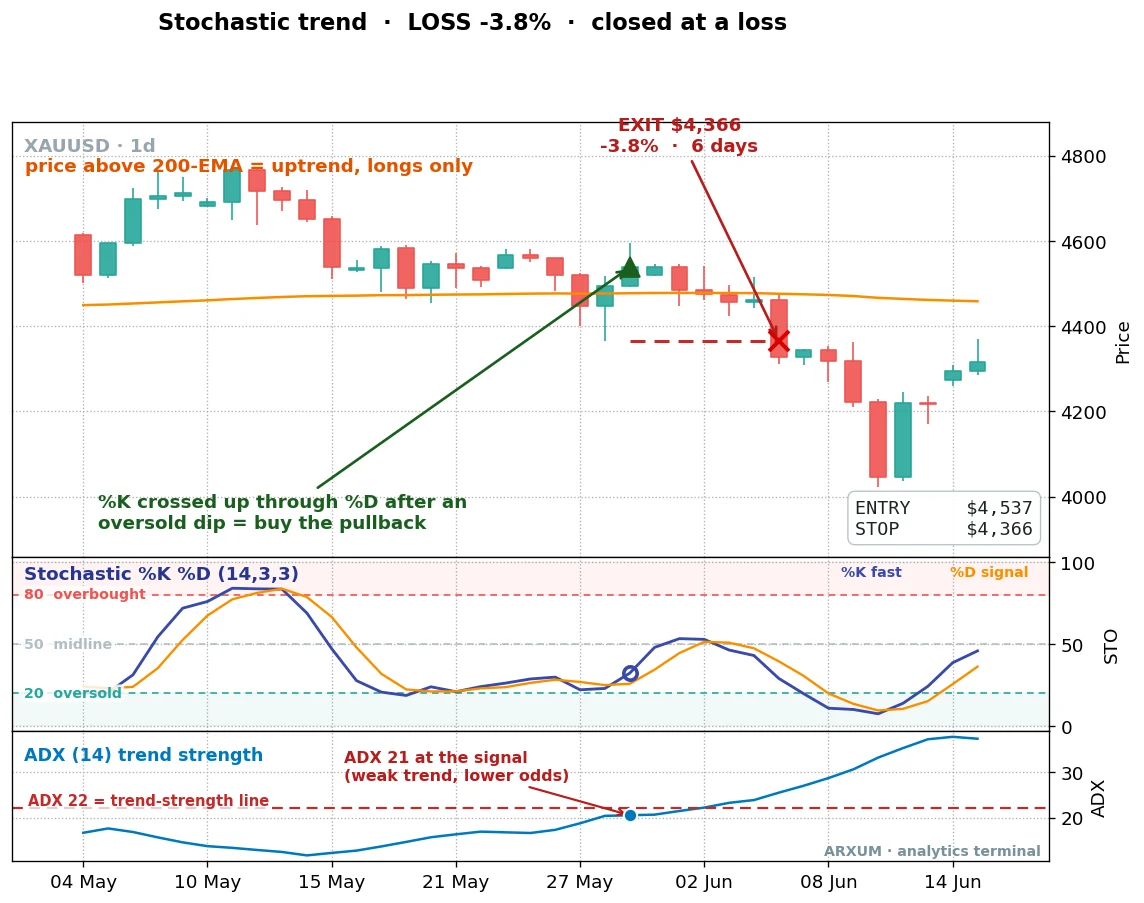
Same setup, same gold daily chart. The cross fired, the entry went in, but the ADX panel reads 21, just under the 22 line, a borderline-weak trend. Price stalled and rolled over, and the trade closed for -3.8%. The filter was telling the truth: a weak trend behind the pullback is a lower-odds bet, and this one did not pay.
A few things keep losses like that from doing real damage.
- Expect losing streaks. An edge wins over many trades, never every trade. A run of three or four red trades in a row is normal variance, not a broken system.
- Pause when the streak runs long. If you hit roughly six losses in a row, the market regime may have shifted. Step back for a week and check whether conditions still match the play.
- Do not chase or revenge-trade. A missed signal is gone; the next one will come. Skipping a setup costs nothing, while forcing a bad one costs real money.
- Watch live versus the test, calmly. If your real results run far worse than the backtest over a meaningful sample, the edge may be fading. One bad week is noise. A sustained gap is a reason to check conditions, not to panic-quit.
Risk only money you can afford to lose, keep the per-trade risk at 2%, and let the math work across the sample rather than betting the account on any single cross.
The honest scope
Worth stating plainly what this is and is not.
- The numbers are eight years of daily gold and the euro, plus six years of 4-hour Bitcoin, net of fees, both long and short.
- Gold and the euro use tick volume, a proxy, since Forex has no central exchange. Bitcoin uses real exchange volume.
- No mechanical edge is permanent. These survived an out-of-sample split, but markets change, and the tool is something you read for conditions, not a robot you set and forget.
The bottom line
Here is the whole thing on a matchbox.
- The popular oversold bounce loses on trending markets. Stop fading the bands by reflex.
- On a trending market, buy the %K/%D cross out of an oversold dip, with the 200-day trend, when ADX is above 22.
- On a ranging market, the bounce works, again best with ADX above 22.
- Use the slow default 14/3/3, not a fast setting, for swing trades.
The stochastic was never the problem. The way it is usually taught is.
If you trade the StochRSI variant, which runs the stochastic formula on top of RSI, see our Stochastic RSI guide.
FAQ
What is the stochastic oscillator?
How do you use the stochastic oscillator?
What are the best stochastic oscillator settings?
What is the difference between fast and slow stochastic?
Does the stochastic oscillator work in a trending market?
Why does the oversold bounce lose money?
What is the best filter for the stochastic oscillator?
What is ADX and why does it matter here?
What is the difference between profit factor and reward-to-risk?
How much money do I need to start?
Stochastic oscillator terms, in plain words
Real-time trade setups with entry, stop loss and take profit. Daily market analysis. No subscription, no complicated theory.
🌍 Our recommended brokers


Reader Reviews
Be the first to review this — tell other traders what actually helped, or where it fell short.
Leave a Review

Forex Analyst & Senior Trader
Former FX desk trader with 8 years in institutional forex. Works in multi-timeframe analysis and order flow, turning desk experience into systematic, testable rules across forex and metals.
