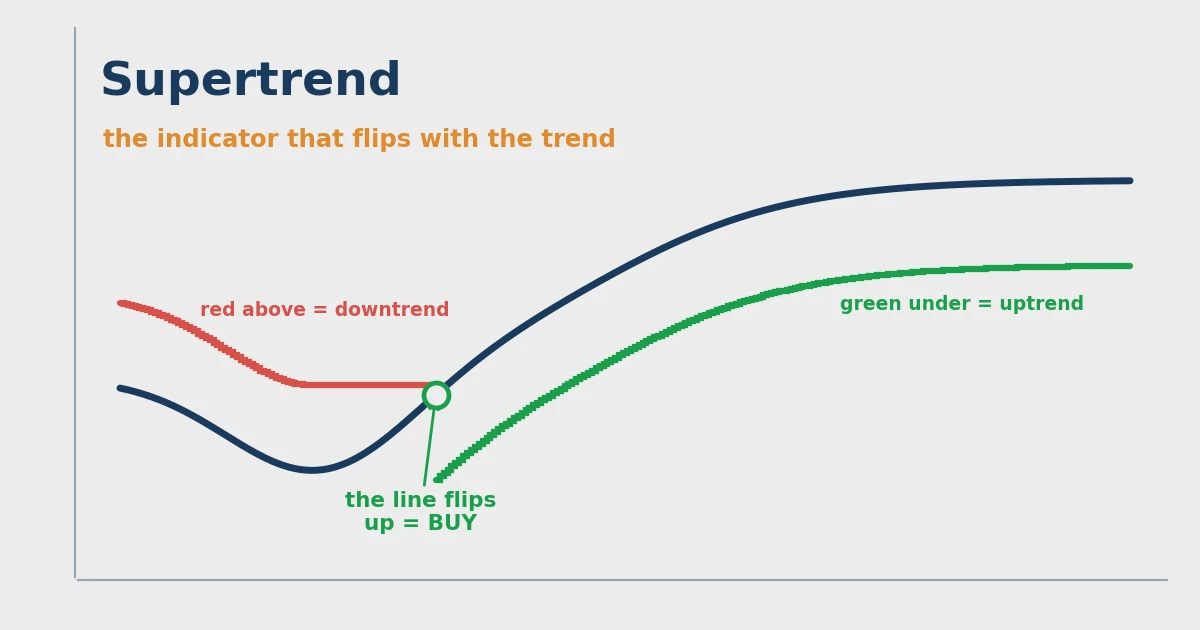
What the Supertrend indicator looks like
Before any results, here is the thing itself. One line, two colors, two signals.
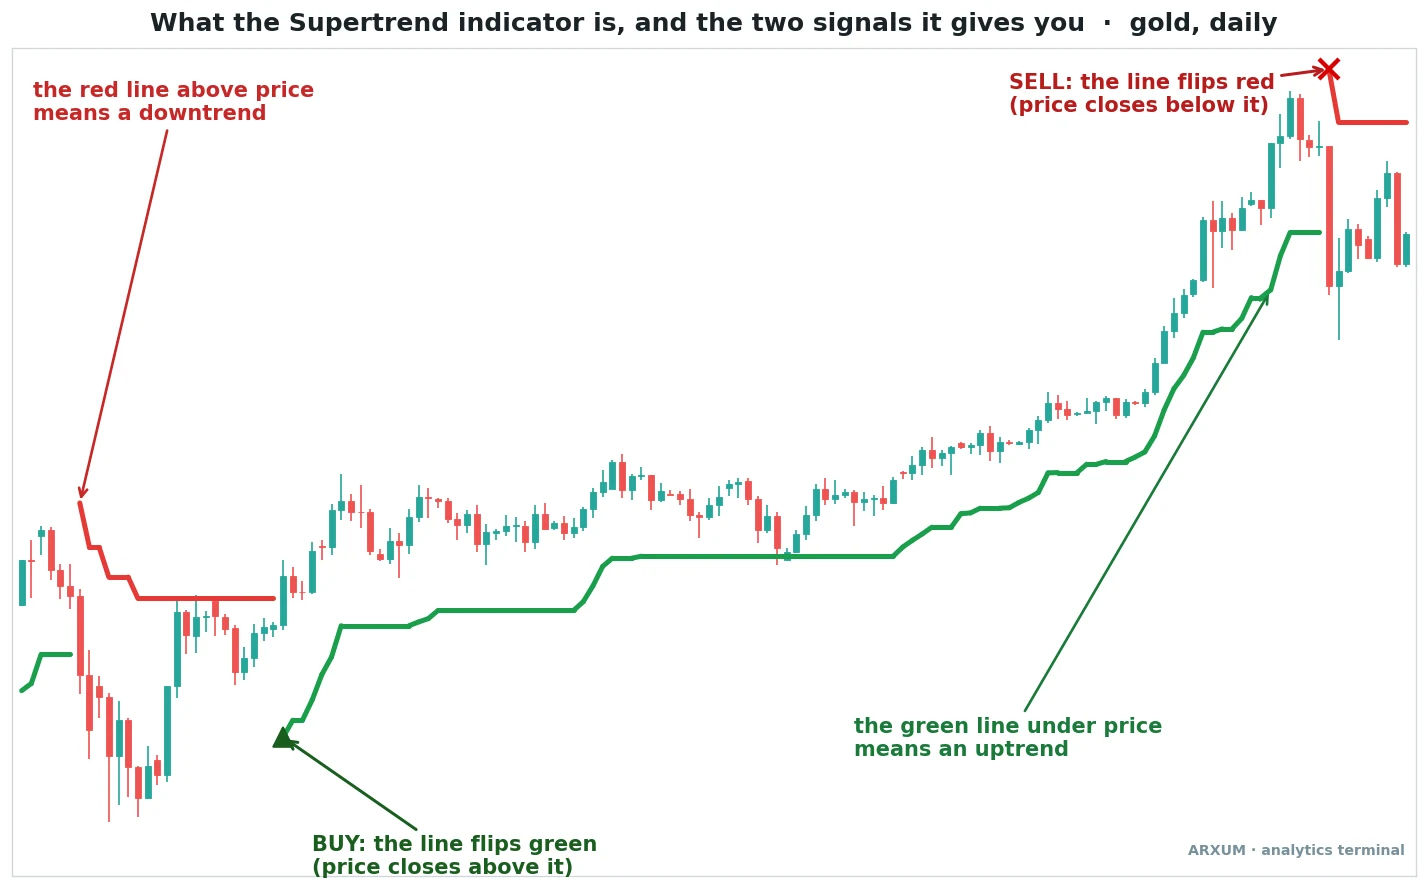
The line sits under price and turns green when the market is in an uptrend. It sits above price and turns red when the market is in a downtrend. That is the whole read. You do not need to interpret anything.
The two signals it gives you are just as plain:
- Buy when the line flips from red to green. Price has closed above the falling red band, so the trend is now up.
- Sell when the line flips from green to red. Price has closed below the rising green band, so the trend is now down.
That green line in an uptrend is also a stop you can lean on. It rises bar by bar and never falls, so it trails under a long position and locks in ground as price climbs. The red line does the mirror in a downtrend. So the Supertrend is two tools in one: a trend call and a trailing stop, drawn as the same line.
The default settings are an ATR length of 10 and a multiplier of 3. We will come back to those, because they matter less than you would think.
Where it actually pays
A trend-following flip can only earn its keep in a market that trends. So the first real question is not “how do I set it up,” it is “where does the standard flip make money and where does it bleed.”
We took the default Supertrend, period 10 and multiplier 3, and ran the plain flip across eight years of daily data on six markets, net of fees. Long on the green flip, with the mirror short tested too. No tuning, no cherry-picking the asset.
The split was clean.
| Market | Trades | Win rate | Profit factor |
|---|---|---|---|
| Silver (XAG/USD) | 28 | 57% | 2.87 |
| Gold (XAU/USD) | 32 | 50% | 2.05 |
| Bitcoin (BTC) | 26 | 42% | 1.34 |
| EUR/USD | 34 | 38% | 1.19 |
| GBP/USD | 32 | 41% | 0.81 |
| Oil (WTI) | 26 | 46% | 2.03 |
A quick word on the metric, so the numbers read right. Profit factor is every dollar the strategy won divided by every dollar it lost. Above 1.0 it makes money, below 1.0 it loses. A 2.0 means it won two dollars for every dollar given back. Read the table against that 1.0 line.
The metals lead. Silver at 2.87 and gold at 2.05 are strong, and both ran for years, not a lucky week. Bitcoin made money but with more chop. The currency pairs were thin to losing. Oil looks great here at 2.03, but oil is a trap we will deal with later.
The pattern is simple. Supertrend pays on markets that make long, sustained trends and struggles on markets that chop sideways. That is not a flaw. It is exactly what a trend-rider is supposed to do.
Lead with gold, because that is what is trending
Gold (XAU/USD) has been in a record bull run, so it is the cleanest place to see the indicator work. Here is one of those trades.
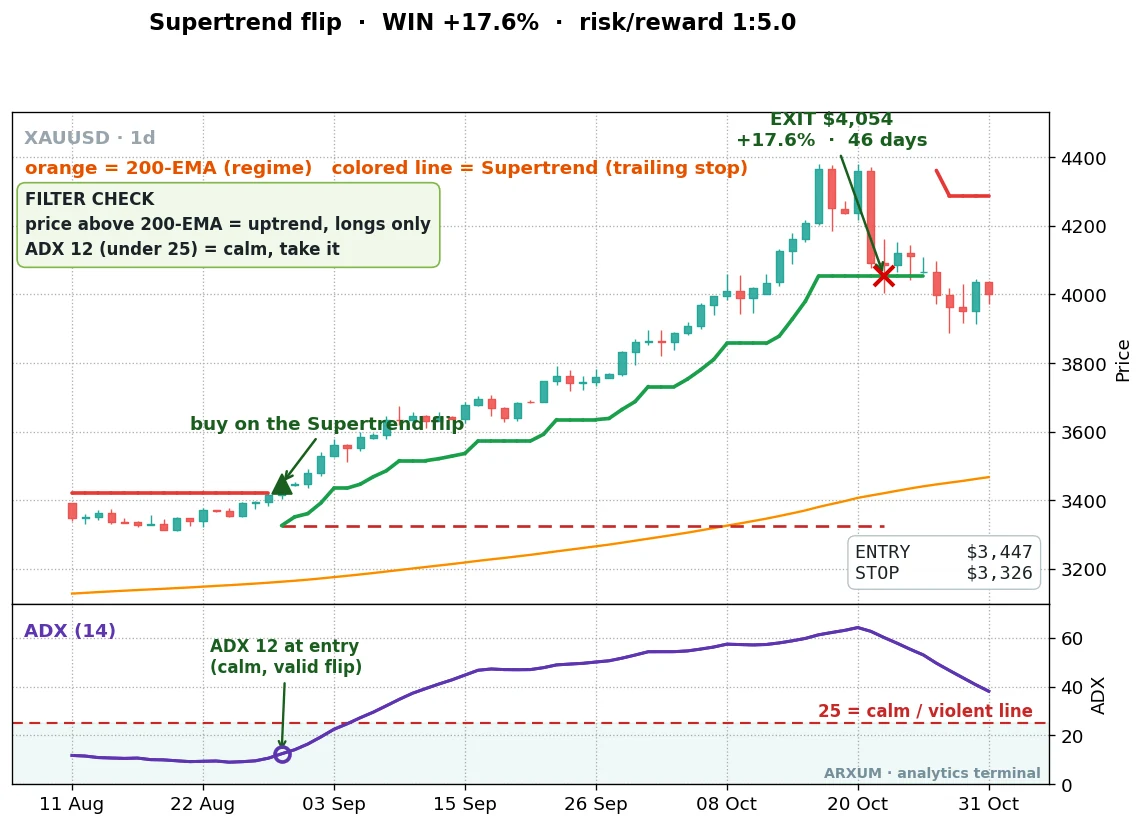
The setup is the whole point of the indicator, so trace it. The line flipped green, you bought the close. The green line then climbed under price for the entire run, trailing the stop higher without you touching it. When price finally rolled over and closed below the line, you exited. One signal in, one signal out, +17.6% over 46 days.
That reward-to-risk of 1:5 is worth defining, because it is the indicator’s calling card. Written 1:X, the 1 is your risk, the distance from entry down to the Supertrend line where your stop sits. The X is the reward, how many times that risk the trade made back. A 1:5 means the trade made five times what it put at risk. The risk-reward ratio guide walks through how to read that figure on any trade.
Trends produce a few of those big winners, and they carry the whole record. Gold gave another one in early 2024.
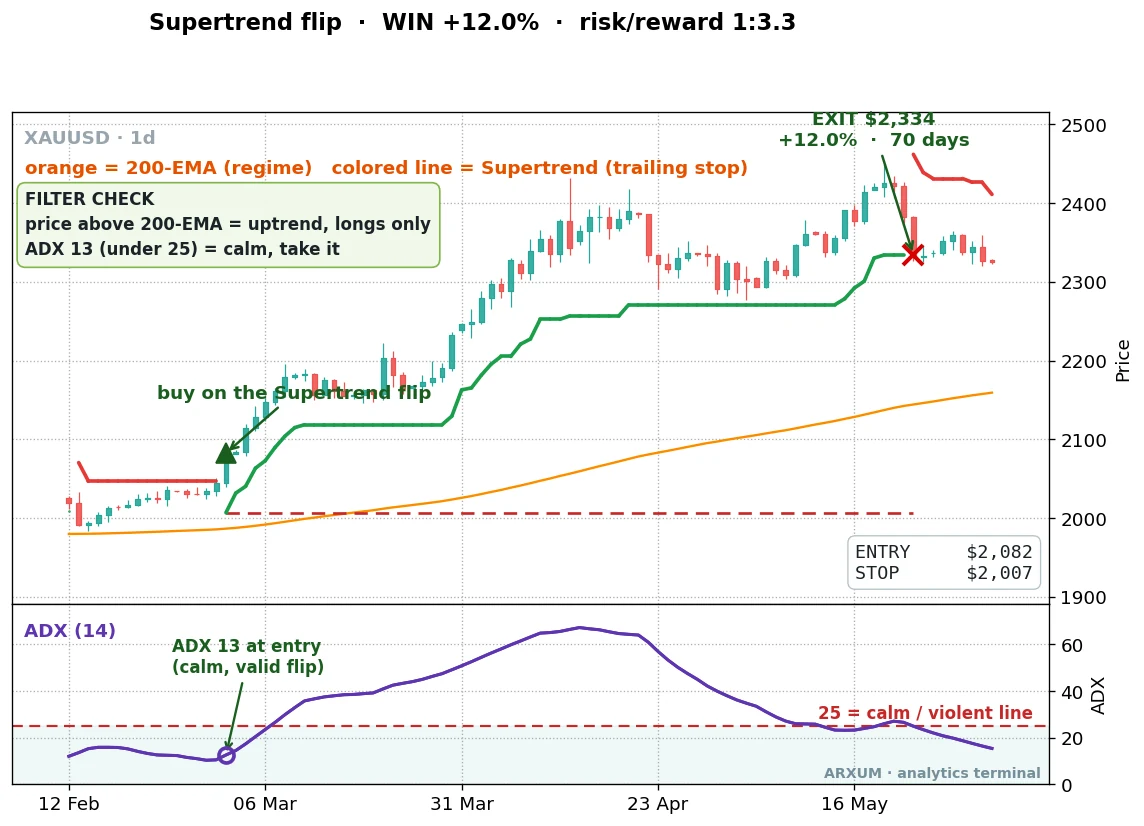
Same mechanics, slower trade. The line caught a March 2024 breakout and rode it for ten weeks. You did nothing but hold while the green line did the work. That is the appeal: the indicator manages the exit for you.
The proof over time, not just two trades
Two winners are anecdotes. A strategy has to prove it pays across its whole run, the losers included. Here is the full gold record, compounding a $1,000 account.
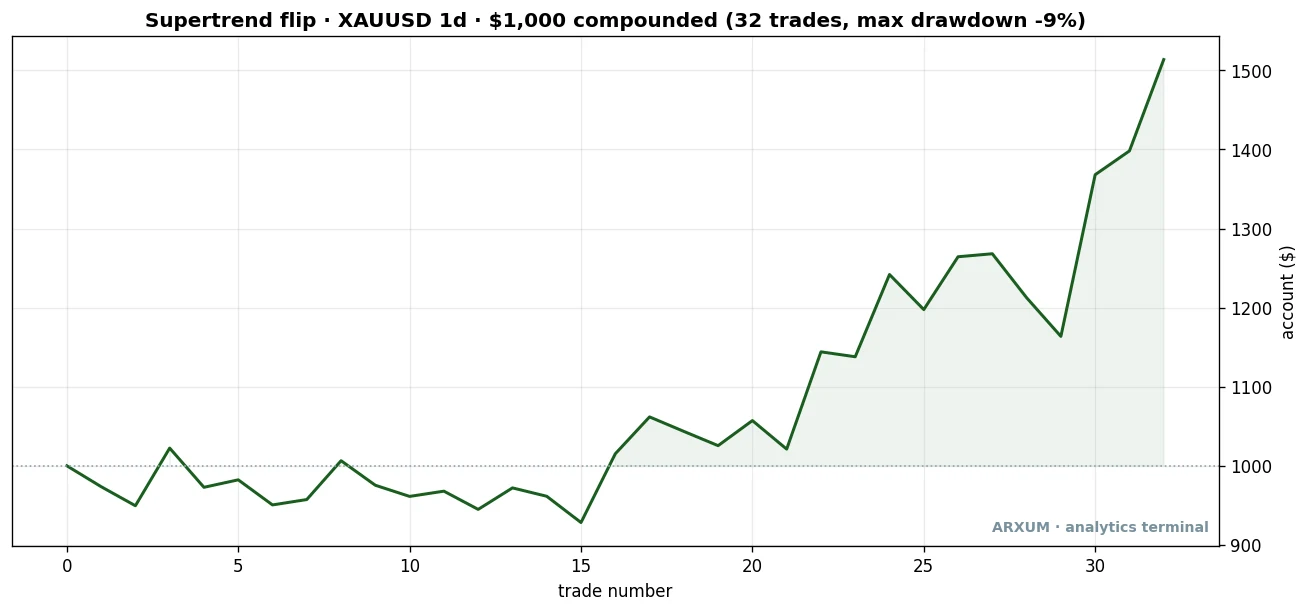
| Trades | 32 |
| Win rate | 50% |
| Reward-to-risk | 1:2.1 |
| Profit factor | 2.05 |
| Net return on $1,000 | +46% |
Look at the shape, not just the end point. The account is flat for the first fifteen trades, a long stretch of small wins and small losses cancelling out. Then the back half climbs. That is the honest face of a trend-rider: a 50% win rate, a lot of nothing, then a handful of runners that pay for everything. The max drawdown along the way was a mild 9%.
It also flags the catch, which we will be straight about in a moment: most of the gold edge sits in the recent years. The early stretch was a grind.
The setting nobody tells you about
Here is the finding that makes this worth reading, and it is counterintuitive.
Reach for a confirmation to filter Supertrend signals and you will reach for volume. Everybody does. A breakout on heavy volume feels more real than one on light volume. So we tried it: only take the flip when volume is at least 1.5 times its 20-day average.
It made the indicator worse on almost every market.
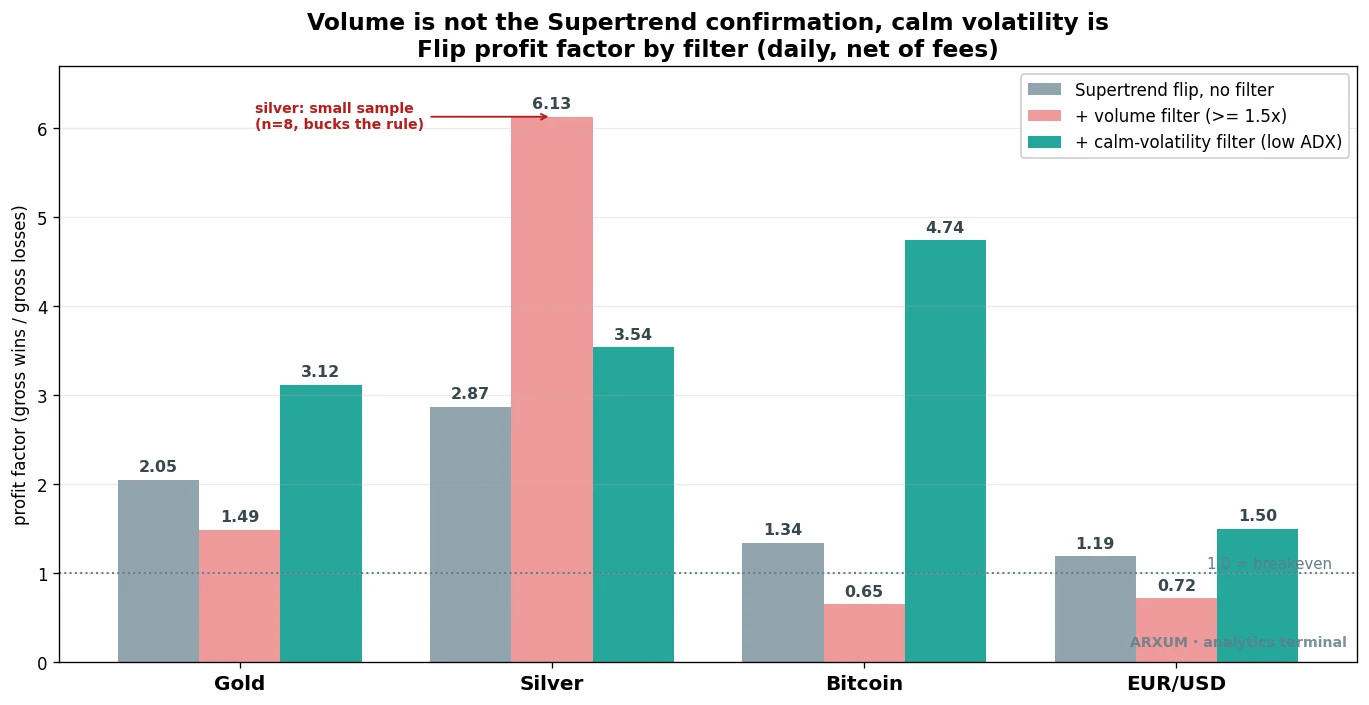
On gold the volume filter dropped the profit factor from 2.05 to 1.49. On Bitcoin it collapsed it from 1.34 to 0.65, turning a winner into a loser. Volume is the wrong tool here.
What worked was the opposite of loud. A calm market filter, taking the flip only when volatility was in the quieter half of its range, lifted every market it touched:
- Gold went from 2.05 to 3.12 when we screened for calm conditions.
- Bitcoin jumped from 1.34 to 4.74.
- Silver rose from 2.87 to 3.54.
The reason is mechanical, and it comes back to what the Supertrend line is. It is a trailing stop set a multiple of ATR away from price.
In a loud, high-volatility market, ATR is large, so the band sits far from price and lags. Price whipsaws across it, the line flips back and forth, and you get chopped. In a calm, coiled market the band hugs price, the trail is tight, and a genuine trend gets ridden cleanly.
So the rule is the reverse of the instinct. Take Supertrend flips when the market is quiet, not when it is exploding.
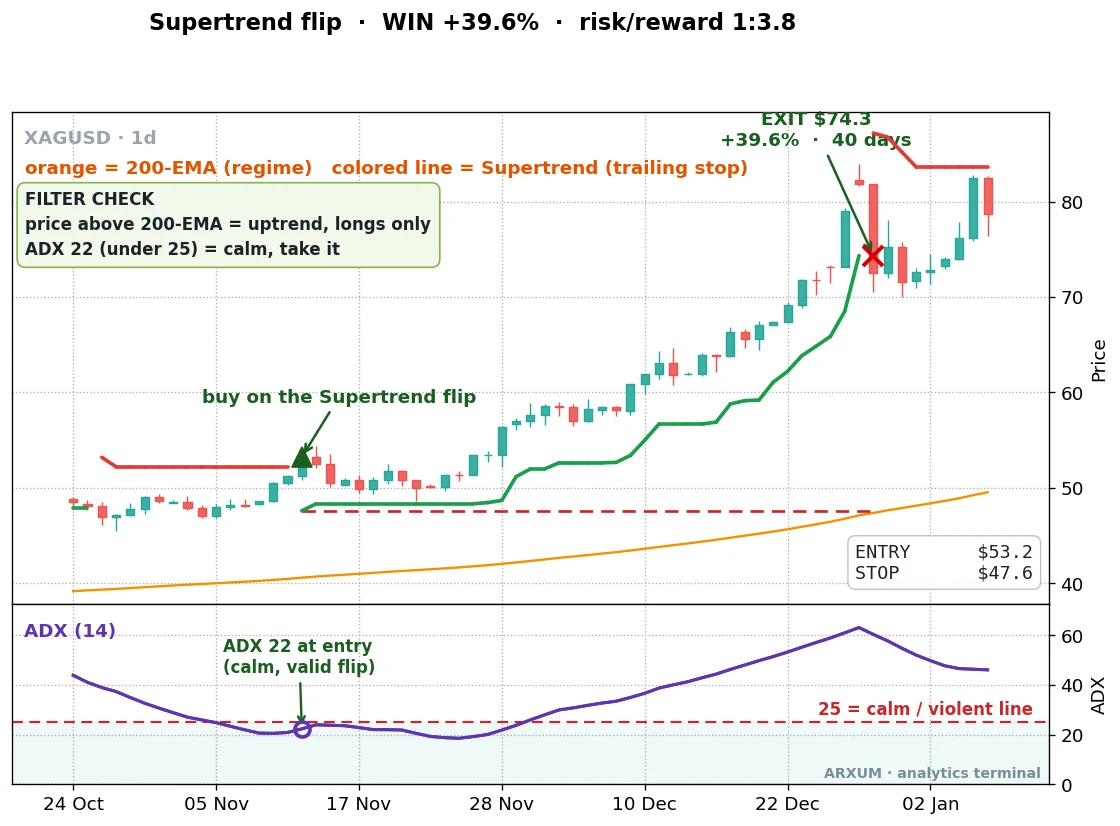
You can read calm two ways. By eye, the candles get smaller and the daily range tightens before the move. Or with one number: ADX, a standard trend-strength gauge.
On every trade chart in this piece the lower panel plots ADX with a line at 25. Below 25 is the calm zone, and that is where you want to enter. The free tier of TradingView has ADX built in.
One nuance for honesty. Silver bucked this on a small sample where heavy volume helped, but that was only nine trades. The calm rule held everywhere it had enough trades to mean something.
The strong-trend instinct fails the same way. We tested taking flips only when ADX, a trend-strength gauge, read above 25. Gold’s profit factor dropped to 0.76, a loser. The plainest read of ADX is this: high ADX means a violent, stretched move, which is precisely when a trailing stop gets whipsawed. The Parabolic SAR guide covers the same trap on its cousin indicator, another ATR-style trailing stop that bleeds in fast markets and shines in calm ones.
So the verdict is concrete: use the calm filter, skip the volume filter. Look back at the gold and Bitcoin trade charts above. The ADX panel under each one tells you the whole story at the entry bar:
- ADX below 25 at the flip means a calm market, so the flip is worth taking. You can see ADX sitting in the teens at the entry circle on those charts, then climbing above 25 as the trend runs. That dip below 25 at entry is the green light.
- Price above the 200-EMA means the trend is up, so you take longs only. That is the regime filter from the next section.
The small FILTER CHECK box on each chart sums up both reads in plain words. That is the whole confirmation routine, and it fits in one glance: a calm ADX plus the right side of the 200-EMA. You never look at volume at all.
Does the edge survive beyond gold?
A finding on one market is a coincidence. The reason to trust this one is that the same line, the same flip, and the same calm-market confirmation paid across very different markets.
Silver (XAG/USD) was the standout. It rides the same bull theme as gold but moves harder, so the runners are bigger.
| Trades | 28 |
| Win rate | 57% |
| Reward-to-risk | 1:2.2 |
| Profit factor | 2.87 |
| Net return on $1,000 | +138% |
And it was not one lucky trade. Here is the full silver record, the same $1,000 account compounded across every flip.

Silver held up the best of any market in the whole test. We will see why in the next section, when we split the years.
Bitcoin paid too, on the same logic. It needs the regime filter we will get to, but the trades look identical: the green line catches a trend and trails it.
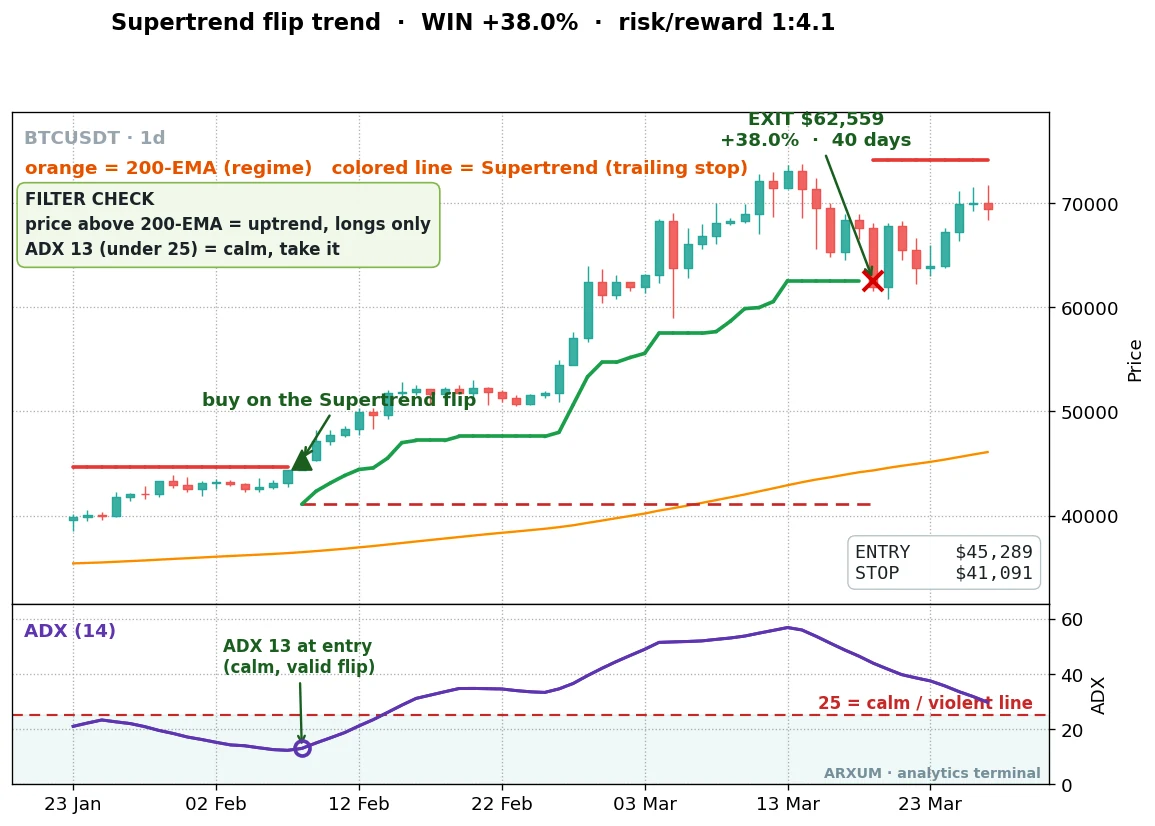
The Bitcoin balance tells the same grind-then-carry story, on the regime-filtered flip.
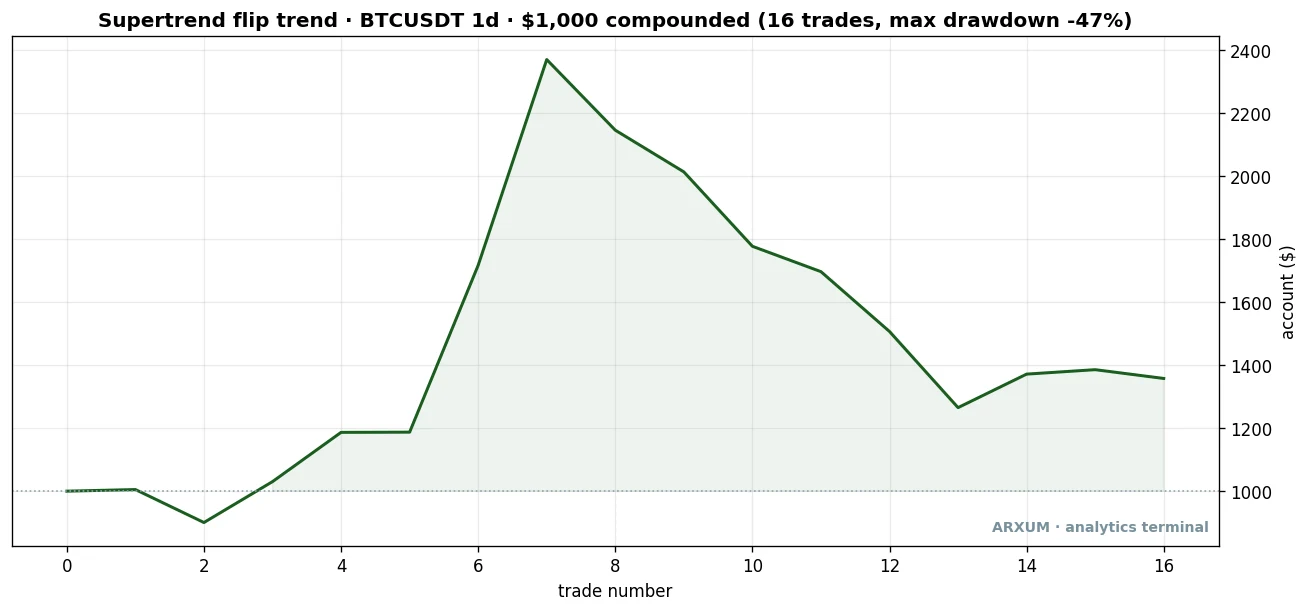
| Trades | 16 |
| Win rate | 50% |
| Reward-to-risk | 1:1.7 |
| Profit factor | 1.71 |
| Net return on $1,000 | +36% |
Three different markets, one mechanism. That cross-market agreement is the difference between an edge and a fluke.
Direction is a regime decision, not a default
There is a reason every chart so far has been a buy. The short side of Supertrend, taking the red flip to sell, was a disaster on every market.
On gold the short flip posted a 0.22 profit factor and lost 66% over the eight years. On silver it broke even. The reason is obvious once you say it out loud: these markets were in strong bull runs, and you cannot fade a bull run. Every red flip was a bet against a trend that kept going.
This is where the 200-day moving average earns its place. By “the trend” we mean the 200-EMA, a slow average of the last 200 days: price above a rising line is an uptrend, price below a falling one is a downtrend. The rule that fixes the short-side bleed is simple:
- Take long flips only while price is above the 200-EMA. You are buying dips in an uptrend.
- Take short flips only while price is below the 200-EMA. You are selling rallies in a downtrend.
That filter is what keeps you from shorting gold into a bull market. On Bitcoin it was the difference between a marginal 1.34 raw and a cleaner 1.71 with the regime filter on.
The Supertrend tells you that the trend turned; the 200-EMA tells you whether that turn is worth trading. Use both. If the bigger trend ever flips for real, the 200-EMA flips with it, and then the short side opens up. Match the tool to the market.
Where it breaks, and the trap in the table
Honesty about a trend indicator means showing where the trend does not arrive. Two places matter.
First, the whipsaw. Even in a good market, the line flips you in near a top and stops you out a few days later. Here is one on gold.
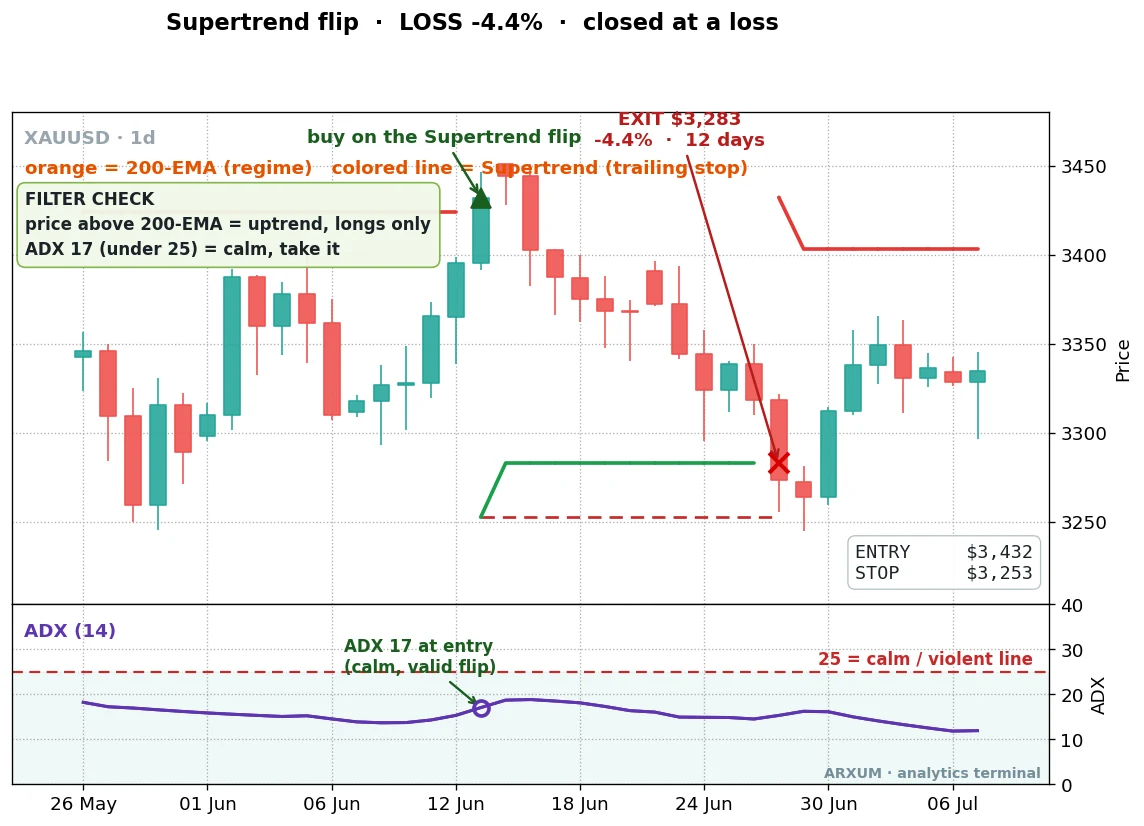
The line flipped green, you bought, and the move never came. Price stalled, rolled over, and closed back below the line within twelve days. You took a 4.4% loss and moved on.
There is no avoiding these. A trend-rider pays for its big winners with a steady drip of small losses like this one, and the only job is to keep each one small. The Supertrend line is the stop that does that for you.
Second, the trap in the results table: oil. Oil’s 2.03 profit factor looked as good as gold’s. It was not.
When we split the eight years in half and tested the later years the strategy had never seen, oil’s edge evaporated to a 0.24 profit factor. The whole oil number came from one early stretch of history. That is what a curve-fit looks like, and it is why a single backtest figure is never enough.
Does it hold up out of sample?
This is the test that separates a real edge from a number fitted to the past. We built nothing on the recent data; the flip is the standard indicator. But we can still split the eight years and check whether the later, unseen half paid like the earlier one.
| Market | Built on 2018–2022 | Tested on 2022–2026 |
|---|---|---|
| Silver | 2.62 | 3.07 |
| Gold | 0.90 | 3.01 |
| Bitcoin | 2.90 | 1.51 |
| EUR/USD | 16.0 | 0.23 |
| GBP/USD | 0.33 | 2.76 |
| Oil (WTI) | 7.55 | 0.24 |
An edge you can trust is one that survives data nobody tuned it to. Read the table that way.
Silver is the cleanest: it paid in both halves, 2.62 then 3.07. Bitcoin held too, 2.90 then 1.51. Those are real.
Gold tells the honest version of its own story. It was a coin-flip in 2018 to 2022 (0.90, a slight loser) and only caught fire in the 2022 to 2026 bull run (3.01). So gold’s edge is concentrated in a trending regime, and the recent metals bull is exactly that.
If gold spends a year going sideways, expect the indicator to grind, not gallop. That is not a reason to distrust it. It is a reason to know what condition it needs.
EUR/USD, GBP/USD and oil are the warnings, each in a different way:
- EUR/USD and oil posted big first-half numbers that fell apart on the unseen half. The euro does not trend hard enough; oil’s run was a one-off. Their early numbers were a mirage.
- GBP/USD is the opposite shape but just as untrustworthy: it lost in the first half (0.33) then looked good in the second (2.76). An edge that is absent, then appears, is not an edge, it is noise switching sign. You cannot lean on it.
The common thread: the currency majors do not make the long, clean trends Supertrend needs. Both EUR/USD and GBP/USD flip-flopped across the two halves. Trust the markets that paid in BOTH, not the ones that paid in one.
The lesson holds across the table: Supertrend is a trend-rider, and it pays in markets that trend, when you check it survives out of sample rather than trusting one figure.
How to use the Supertrend strategy in practice
If you want to put this to work, here is the whole method in concrete steps. We will size a gold trade so the numbers are real.
- Pick a trending market. Metals and Bitcoin on the daily chart are where the data says it pays. Skip the currency majors for this; they do not trend hard enough.
- Set the indicator. Add Supertrend with the default ATR period 10 and multiplier 3 on the daily chart. Add the 200-EMA for the regime read.
- Check the regime. Only take long flips while price is above the 200-EMA. The short side needs price below it, which on a bull-market chart means waiting.
- Wait for a calm flip. Take the green flip when the candles into it are small and the range is tight, not when the market is exploding. Calm is the confirmation.
- Place the order. Three fields on the ticket. A buy order at the flip close, a stop-loss at the Supertrend line just below price, and no fixed take-profit, because you exit on the opposite flip, not a target.
- Trail and exit. Move the stop up to the Supertrend line as it rises, or just let the line be your stop. Exit when the line flips red.
Now the sizing, worked from the account down, on a real gold trade. Say the entry is at $3,447 and the Supertrend line, your stop, is at $3,326. Risk 2% of a $1,000 account.
- Risk budget: 2% of $1,000 = $20.
- Risk per ounce: $3,447 entry minus $3,326 stop = $121 per ounce.
- Position size: $20 risk budget ÷ $121 per ounce = 0.165 ounces.
Gold is sized in lots, not loose ounces: a standard lot is 100 ounces, a mini is 10, a micro is 1. So 0.165 ounces is below even a single micro lot.
The honest read: on a $1,000 account at 2% risk, you cannot take this gold trade at all. The stop is too wide in dollar terms for that account. You would need a broker offering fractional or cent-lot sizing, or a larger account, before this is tradeable.
Never widen the stop to force the size, and never risk more than the 2% to make the lot fit. The size bends to the risk, not the other way around.
What this costs you, and the discipline that pays
The Supertrend earns its money the way every trend tool does: a low-ish win rate, a string of small losses, and a few large winners that carry the year. The gold record was a 50% win rate, and most of the profit came from the back third of the trades. You have to sit through the flat stretches to be there for the runners.
That shapes the discipline:
- Expect losing streaks. At a 50% win rate, three or four losses in a row is ordinary variance, not a broken strategy. Do not abandon the method after a couple of whipsaws like the gold loss above. That is the cost of admission.
- Six in a row is the warning. That is more than usual, and a signal to check whether the market has stopped trending and slipped into a chop. Chop is the one condition that switches this edge off.
- Watch the regime, not your emotions. The two things that wreck a trend trader are jumping in early out of impatience and bailing on a winner out of fear.
The Supertrend exists to remove both of those decisions. You enter on the flip, you exit on the flip, you trail in between. Let the line do its job.
Keep a calm eye on live results against this record. If your trading runs a little worse than these numbers over a handful of trades, that is normal variance, not a verdict.
If it runs much worse across a real sample, the market may have shifted out of the trending regime the indicator needs. Step back and check conditions before adding risk. Only ever trade money you can afford to lose. This is a tool that works in trends, not a machine that prints in all weather.
Where to go from here
The natural next steps are the tools this method leans on:
- The Average True Range guide explains the volatility measure that sets the Supertrend’s distance from price, and how to use ATR for stops on any trade.
- The Parabolic SAR guide covers the close cousin, another flipping trailing stop with the same calm-market lesson. Read the two side by side to sharpen when to trust either.
- Trendline trading is the manual version of what Supertrend automates, drawing the line of the trend by hand.
- Support and resistance gives you the levels to sanity-check a flip against before you act on it.
FAQ
What is the Supertrend indicator, in plain terms?
Does the Supertrend indicator actually work?
What are the best Supertrend settings?
What is the best confirmation to add?
Why does volume hurt the Supertrend?
Which markets and timeframes are best?
Can I trade the short side?
How is the Supertrend different from Parabolic SAR?
How much money do I need to start?
How do I place the trade?
How many losses in a row should I expect?
What do the key terms mean?
🌍 Our recommended brokers

Quant Researcher & Systems Builder
Quantitative researcher who builds the automated systems behind Arxum strategy testing. Works in Python and Pine Script, using AI alongside classic backtesting to validate strategies on years of real data.