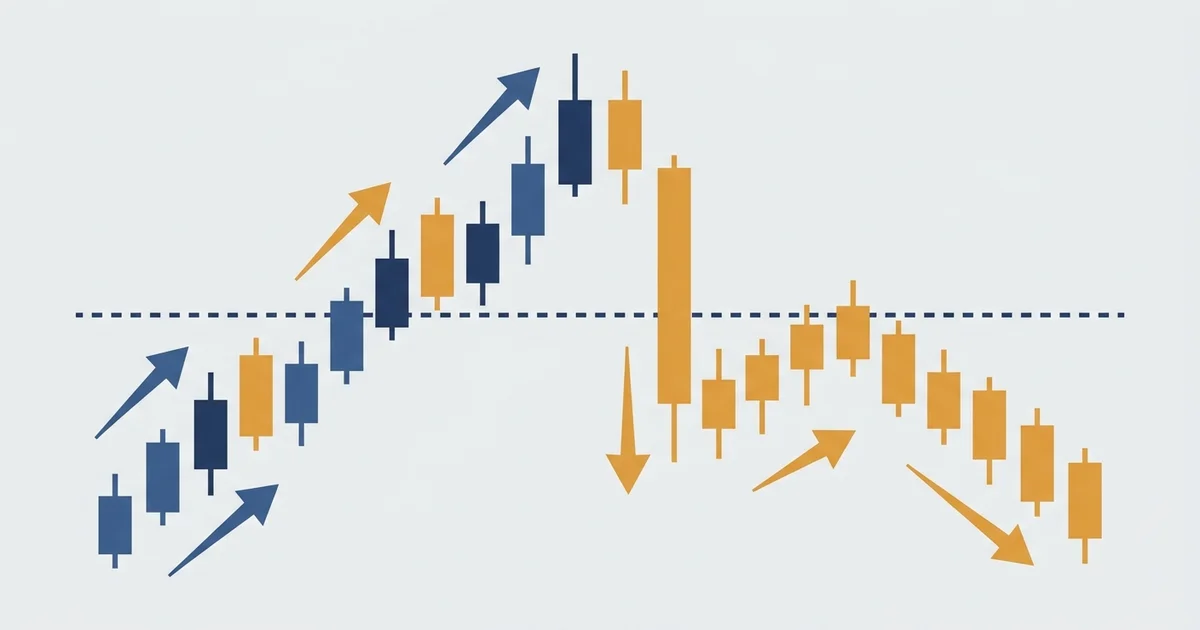

What market structure actually is
Every chart is a series of swing highs and swing lows. Market structure is just the order of those points, and that order tells you whether buyers or sellers are in control.
Here is the shape on a real chart before we name the parts.
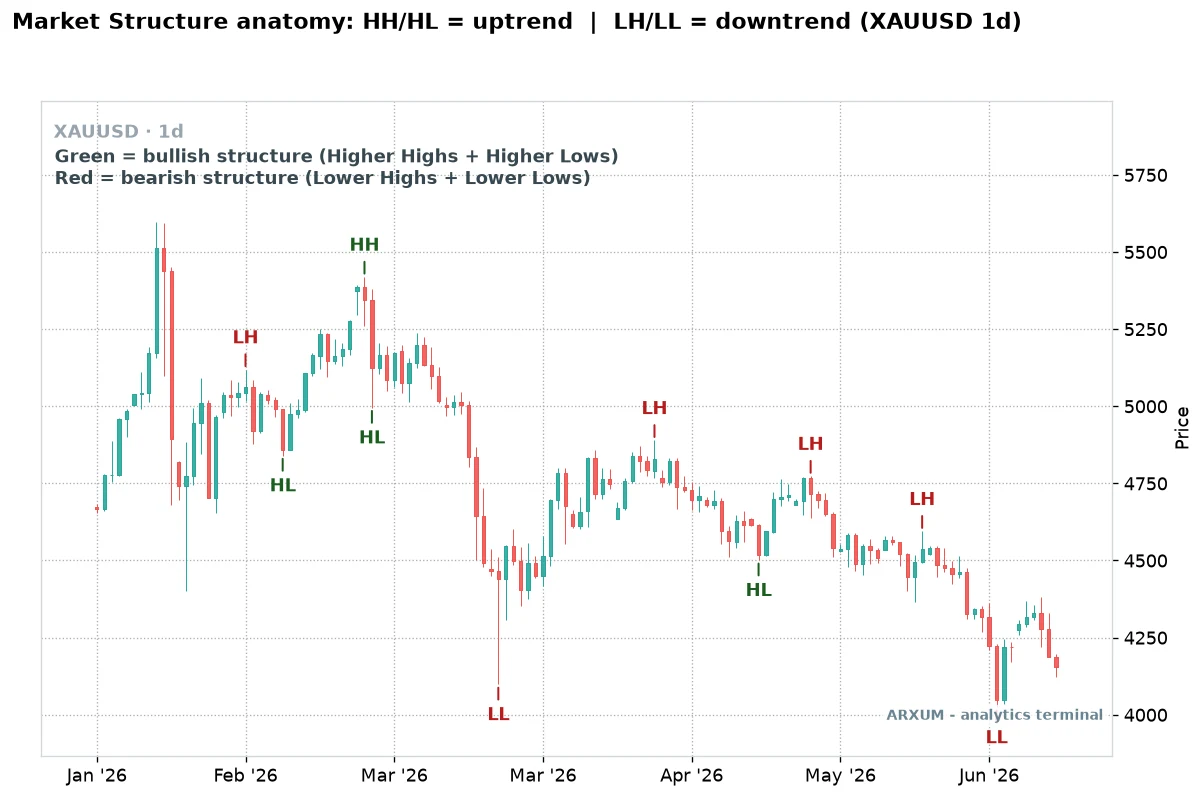
With the picture on screen, the four labels are easy to read.
- Higher high (HH): a swing high above the previous one. Buyers pushed further than last time.
- Higher low (HL): a swing low above the previous one. Sellers could not drag price as low.
- Lower high (LH): a swing high below the previous one. Buyers ran out of room earlier.
- Lower low (LL): a swing low below the previous one. Sellers pressed deeper.
Those four points sort every chart into one of three states.
- Uptrend: a chain of higher highs and higher lows, the green run on the left of the gold chart.
- Downtrend: a chain of lower highs and lower lows, the red run on the right.
- Range: highs and lows on roughly the same levels, no clear chain, indecision.
Reading trend as a chain of swings is the plain-English core of trend following. The moment the chain breaks, the trend is in question, and that break is the whole subject of this guide.
The four building blocks, and how to mark them
The swing points are the alphabet. Learn to spot them and the rest reads itself.
| Swing point | What it is | What it signals |
| Higher high (HH) | High above the last high | Uptrend intact |
| Higher low (HL) | Low above the last low | Buyers defending, trend up |
| Lower high (LH) | High below the last high | Sellers capping, trend down |
| Lower low (LL) | Low below the last low | Downtrend intact |
| Equal highs / lows | Highs or lows at one level | Range, no clear edge |
Marking swings is a skill, and a few rules keep it clean.
- Read the higher timeframe first. A swing on the daily matters more than a wiggle on the 5-minute.
- A swing high is a candle with lower highs on both sides; a swing low has higher lows on both sides.
- Count a level as broken only on a close beyond it, never a wick. A wick through is a test, a close through is a break.
- Keep it sparse. Two or three clean swings beat a chart buried under tiny labels.
Break of structure trading: the continuation signal
A break of structure is price closing through the last swing point in the direction it was already heading. It confirms the trend still has control.
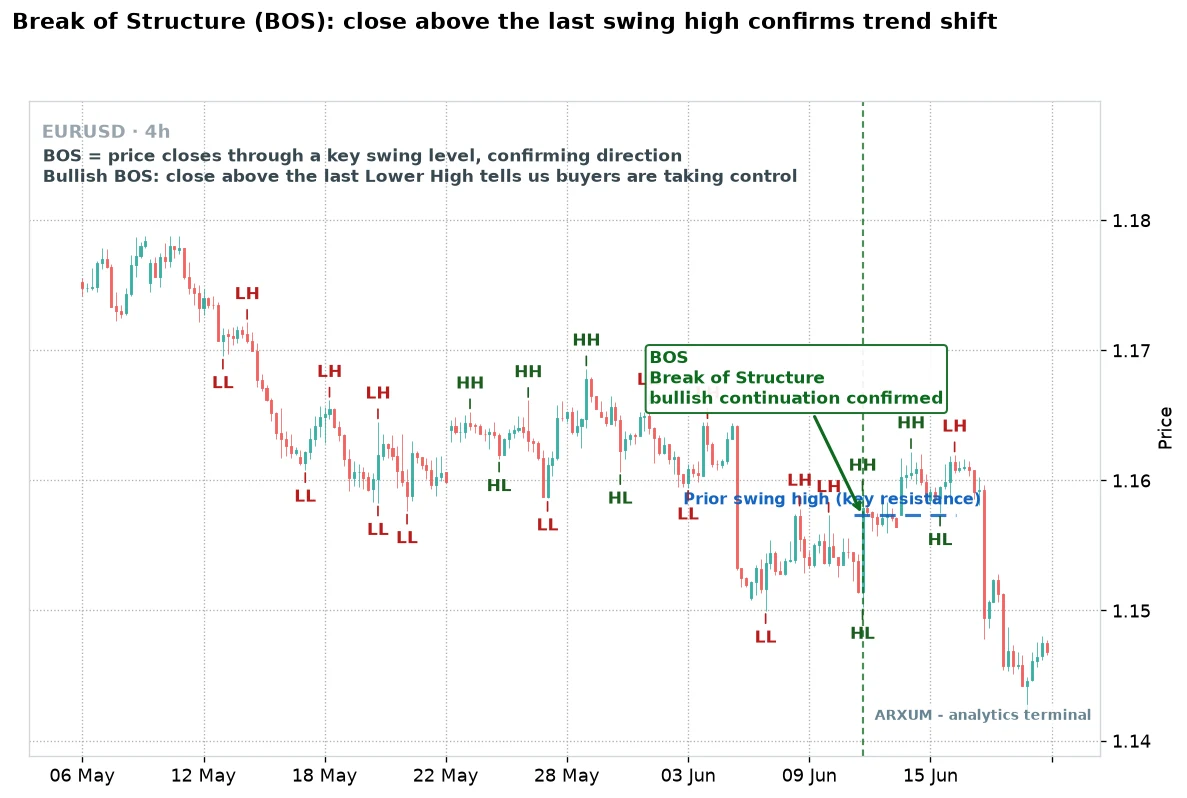
The labels map straight onto the plan.
- The blue dashed “prior swing high” is the level price has to close above, the key resistance from the last swing.
- The green “BOS” box marks the close through it, buyers taking control.
- The vertical line is the break bar, the exact candle that closed past the level.
Here is what a break of structure looks like as it forms.
- In an uptrend, price closes above the prior higher high. The trend just extended.
- In a downtrend, price closes below the prior lower low. Sellers pressed on.
- The break needs a full close beyond the level, not a wick poking through and pulling back.
- After a BOS, the level it broke often flips role and becomes support, a natural spot for the pullback entry.
That flip is why market structure sits so close to support and resistance trading, and why a BOS is really a breakout confirmed by structure rather than a lone line on the chart.
| Role | How you use it | Best read |
| Entry trigger | Enter on the close beyond the last swing | With the trend only |
| Trend read | BOS in the trend direction means continuation | Stack it with the higher timeframe |
| Confirmation | Wait for the candle to close, not the wick | H4 or D1 close |
| Filter | Skip a BOS against the higher-timeframe trend | The daily sets the bias |
| Exit | Trail behind each new HL (long) or LH (short) | Let structure carry the stop |
| Best timeframe | H4 and D1 for the cleanest breaks | gold, EUR/USD, BTC |
A BOS is a signal, not a promise. On that same EUR/USD chart, price later rolls back into fresh lower lows and the bullish break fails.
Structure tells you the odds. You still size for the trade that does not work.
Change of character trading: the first reversal signal
A change of character is the first break against the trend. It is the earliest sign the structure is flipping, well before a full reversal is confirmed.
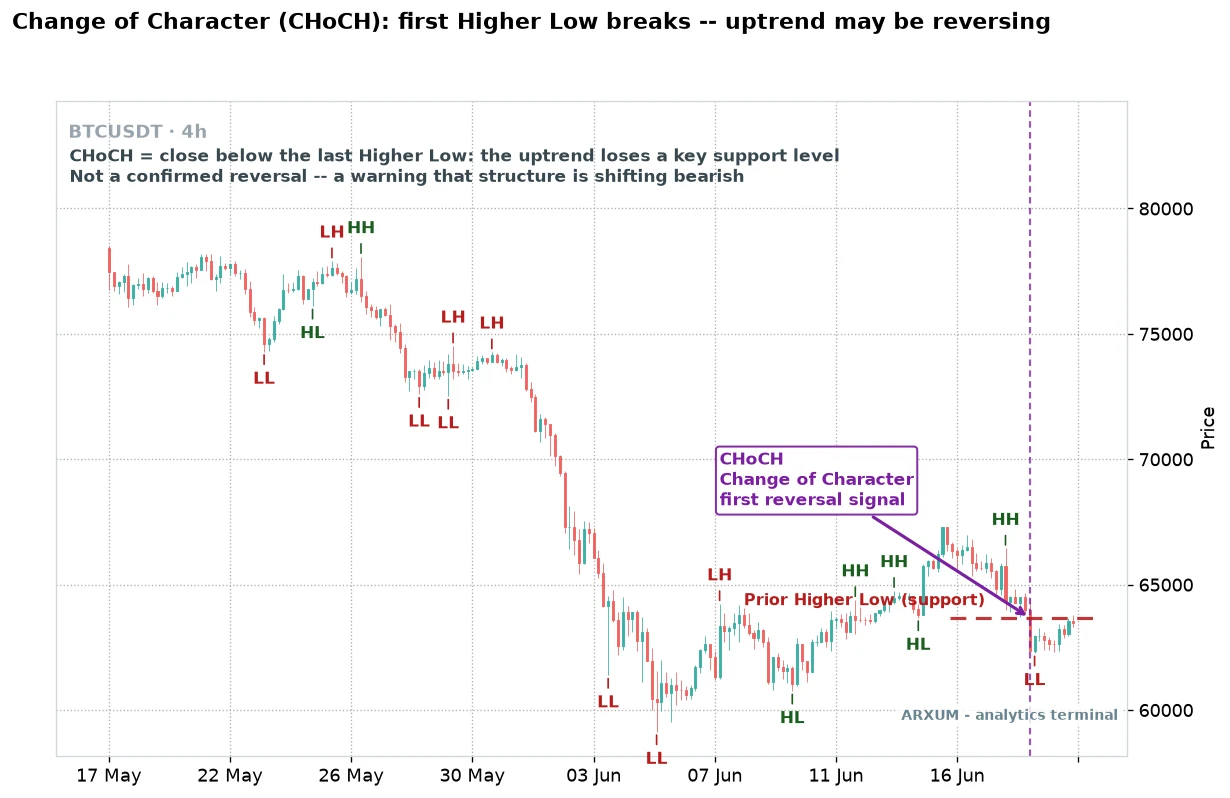
Read the CHoCH the same way you read a BOS, just mirrored.
- The rising chain makes a higher high and a higher low, then price closes below that last higher low.
- The red dashed line is the prior higher low, the support the trend needed to hold.
- The vertical line is the CHoCH bar, the first close against the trend, the first reversal signal.
Here is the shape of it.
- In an uptrend, the first close below the last higher low. The rising chain just cracked.
- In a downtrend, the first close above the last lower high. Sellers lost their grip.
- CHoCH comes before BOS in a reversal. It warns; then a fresh BOS in the new direction confirms.
- On its own it is early. Plenty of CHoCH signals fail and the old trend simply resumes.
| Role | How you use it | Best read |
| Entry trigger | Aggressive entry on the CHoCH close | Accept a higher failure rate |
| Trend read | Flags a possible turn, not a sure one | Confirm on the higher timeframe |
| Confirmation | Wait for a follow-up BOS the new way | Safer, later entry |
| Filter | Trust a CHoCH into a key level more | At an order block or S/R zone |
| Exit | Target the prior swing the new way | Scale out, structure is unproven |
| Best timeframe | H1-H4 for entries after a D1 signal | gold, EUR/USD, BTC |
BOS and CHoCH are the backbone of smart money concepts, where a CHoCH landing inside an order block is treated as a high-value reversal cue. The structure is the same idea, dressed in different names.
BOS vs CHoCH: the key difference
This is the one distinction people get wrong. Both are structure breaks, but they point in opposite directions.
| Feature | BOS | CHoCH |
| Direction | With the trend | Against the trend |
| Meaning | Trend continues | Trend may reverse |
| Timing | Confirms a move | Warns of a turn |
| In an uptrend | Close above the last HH | Close below the last HL |
| In a downtrend | Close below the last LL | Close above the last LH |
| Reliability | Higher, trend-following | Lower, an early signal |
The plain-language version is short.
- Simple rule: BOS agrees with the trend, CHoCH fights it.
- A reversal reads as a sequence: CHoCH first, the warning, then a BOS the new way, the confirmation.
- Trade a BOS for continuation. Treat a CHoCH as a heads-up to tighten stops or hunt a counter-trend entry.
Reading structure across markets and timeframes
Structure is the same shape on every market. What changes is the noise, and the timeframe where it reads cleanest.
| Market | How structure behaves | Best timeframe |
| gold (XAU/USD) | Clean, strong trends | D1 for bias, H4 for entries |
| EUR/USD, GBP/USD | Respects levels, more fakeouts | H4 primary, H1 confirmation |
| Bitcoin (BTC) | Big impulsive breaks, fast | H4 for swings, D1 for trend |
| Index CFDs | Trend well, gap at the open | D1 structure, mind the open |
For a Forex trader, market structure forex reading is the backbone of price action. The majors respect swing levels but throw more fakeouts than gold, so the close-through rule matters more there than anywhere.
Top-down is the whole method, and it runs in one direction.
- Read the highest timeframe first for the bias. The daily says which way the trend leans.
- Drop to the 4-hour to find the current swing and the level price is testing.
- Use the 1-hour for the entry, after the higher timeframe has given a BOS or CHoCH.
- Only trade with the daily. A 1-hour BOS against a daily downtrend is a bounce, not a turn.
That leaves one table to carry the read from structure to action.
| Current structure | What it tells you | What to do |
| HH + HL, price above | Uptrend, buyers in control | Buy pullbacks to the last HL |
| LH + LL, price below | Downtrend, sellers in control | Sell rallies to the last LH |
| CHoCH just printed | Trend may be turning | Wait, tighten, or scale out |
| BOS with the trend | Trend confirmed | Add or hold, trail the stop |
| Equal highs and lows | Range, no edge | Stand aside or fade the edges |
How to trade market structure, step by step
Structure needs no indicator. Just your eyes, the swing points, and one level marked.
- Mark the last three or four swing highs and lows on the daily, and name them HH, HL, LH, LL.
- Set the bias: a rising chain is long only, a falling chain is short only, a flat one waits.
- Drop to the 4-hour and find the nearest swing level, the one price is testing now.
- Wait for a close through it. A BOS with the trend, or a CHoCH against it, is your trigger.
- Enter on the 1-hour in that direction, once the candle has closed.
- Put the stop beyond the swing that would prove you wrong, and target the next structure level.
The tools are free, and you only need to mark levels.
- In TradingView, mark swings with the horizontal line tool, or add the “Zig Zag” indicator to auto-plot the swing points.
- In MT4 or MT5, use Insert then Line then Horizontal Line on each swing; ZigZag sits under Insert, Indicators, Custom.
- No paid tool is needed. Structure reads off any plain candlestick chart, which is why it pairs so well with price action trading.
Risk on structure trades is cleaner than most, because the level does the work.
- The stop goes beyond the swing that invalidates the read, not at a random distance. If that swing breaks, your reason for the trade is gone.
- Risk a small fixed slice per trade, about 2% of the account, so one failed break is a dent, not a disaster. The risk-reward ratio guide shows how to size it.
- Because the stop sits beyond a real level, structure trades often give a clean reward-to-risk, written 1:X, where the 1 is your risk and the X is the reward.
- Structure fails in a range. If you take three to six losing breaks in a row, the market has probably gone sideways, so stop trading breaks and wait for a trend.
A quick example keeps it concrete. Take a bullish BOS on EUR/USD, a market a small account can actually trade.
- The setup: price closes above a prior swing high at 1.0900, a bullish break of structure. The last higher low sits at 1.0850.
- Risk budget: 2% of a $1,000 account is $20, the most you plan to lose.
- Entry: buy at 1.0905 on the close through the level.
- Stop: 1.0845, just below the last higher low, the swing that would prove the break wrong. Entry to stop is 60 pips. A pip is the fourth decimal on a major pair.
- Position size: $20 risk divided by 60 pips is about $0.33 per pip. A micro lot is worth about $0.10 per pip, so $0.33 ÷ $0.10 is about 3 micro lots (0.03 lots).
- Target: the next structure high near 1.1025, about 120 pips of reward against 60 of risk, close to 1:2.
Holding 3 micro lots on a $1,000 account is tiny size. Broker leverage just gives the margin room to place the trade; the 2% risk is the real cap, not the leverage.
What works: the short version
Three ideas carry the whole method.
- Trend is a chain. Higher highs and higher lows mean up, lower highs and lower lows mean down. When the chain breaks, the trend is in question.
- BOS continues, CHoCH warns. A break with the trend says carry on. The first break against it says get ready, the character just changed.
- Top down, on a close. Set the bias on the daily, trade the 4-hour and 1-hour, and count a level broken only when a candle closes through it.
Market structure is the ground the rest of the smart-money toolkit stands on. If you want the full framework that grows out of these swings, the ICT trading guide is the natural next read.
Glossary
- Market structure: the pattern of swing highs and lows that shows the trend.
- Swing high / swing low: a turning point where price reverses, a local top or bottom.
- Higher high (HH) / higher low (HL): each new high or low above the last, the signature of an uptrend.
- Lower high (LH) / lower low (LL): each new high or low below the last, the signature of a downtrend.
- Break of structure (BOS): a close through the last swing level in the trend’s direction, confirming continuation.
- Change of character (CHoCH): the first close against the trend, the earliest warning of a reversal.
- Bias: the trend direction you take from the higher timeframe before hunting a trade.
- Top-down analysis: reading the daily first, then the 4-hour, then the 1-hour, and trading where they agree.
FAQ
What is market structure in trading, in plain terms?
Market structure is the order of the swing highs and lows on a chart, and it tells you what the trend is doing. An uptrend leaves a chain of higher highs and higher lows, because buyers keep pushing further and sellers cannot drag price as low. A downtrend leaves lower highs and lower lows. When highs and lows sit on the same level with no clear chain, the market is ranging. Reading market structure is simply reading that order and deciding whether buyers or sellers are in control before you look for a trade.
What is break of structure trading (BOS)?
A break of structure is price closing through the last swing point in the direction the trend was already going. In an uptrend it is a close above the prior higher high; in a downtrend it is a close below the prior lower low. Break of structure trading uses that close as a continuation signal: the trend just proved it still has control, so you trade with it. The key is that it needs a full candle close beyond the level, not just a wick poking through and pulling back.
What is the difference between BOS and CHoCH?
They are both structure breaks, but they point in opposite directions. A break of structure (BOS) is a close in the direction of the trend, so it confirms continuation. A change of character (CHoCH) is the first close against the trend, so it warns of a possible reversal. In a full reversal the two appear in order: CHoCH prints first as the early warning, then a fresh BOS in the new direction confirms the turn. Simple rule: BOS agrees with the trend, CHoCH fights it.
How do you identify market structure on a chart?
Start on the higher timeframe, usually the daily, and mark the last three or four swing highs and lows. A swing high is a candle with lower highs on both sides; a swing low has higher lows on both sides. Label each one higher high, higher low, lower high, or lower low. If the highs and lows are rising, the structure is up; if they are falling, it is down; if they sit level, it is a range. Keep it sparse: two or three clean swings read better than a chart buried in labels.
What is a change of character (CHoCH)?
A change of character is the first break against the prevailing trend, the earliest sign the structure may be flipping. In an uptrend it is the first close below the last higher low; in a downtrend it is the first close above the last lower high. It is a warning, not a confirmed reversal, so many CHoCH signals fail and the old trend resumes. It carries more weight when it lands into a key level such as an order block or a support or resistance zone, and it is safest when a follow-up break of structure confirms the new direction.
Does market structure trading work on Forex and crypto?
Yes. Structure is the same shape on every market because it is just the map of swing highs and lows. On gold the trends are clean and the daily structure is strong. On Forex majors like EUR/USD and GBP/USD the levels are respected but there are more fakeouts, so the close-through rule matters more. On Bitcoin the breaks are big and fast, so the 4-hour and daily read cleaner than the lower timeframes. The method ports across all of them; only the noise and the best timeframe change.
What timeframe is best for trading market structure?
Read it top down rather than picking one timeframe. Use the daily to set the bias and see the main trend, drop to the 4-hour to find the current swing and the level price is testing, and use the 1-hour for the entry once the higher timeframe has given a break of structure or a change of character. The daily and 4-hour give the cleanest structure; the 1-hour is for timing the entry, not for setting the trend. Only trade in the direction the daily supports.
How much money do you need to trade market structure?
You can start small if you pick the right market. A Forex pair like EUR/USD sizes cleanly on a $1,000 account: risking 2%, or $20, over a 60-pip stop below the last higher low works out to about three micro lots. Gold is harder to size on a small account because a sensible structure stop can push the position below the one-ounce micro-lot minimum. Whatever the market, put the stop beyond the swing that invalidates the trade, risk a small fixed slice, and only use money you can afford to lose.
Real-time trade setups with entry, stop loss and take profit. Daily market analysis. No subscription, no complicated theory.
🌍 Our recommended brokers


Reader Reviews
Be the first to review this — tell other traders what actually helped, or where it fell short.
Leave a Review

Forex Analyst & Senior Trader
Former FX desk trader with 8 years in institutional forex. Works in multi-timeframe analysis and order flow, turning desk experience into systematic, testable rules across forex and metals.
