
What trend following actually is
Trend following is a way of trading, not a single indicator. The bet is that a market already moving in one direction tends to keep going a while longer.
Here is the whole idea on one chart.
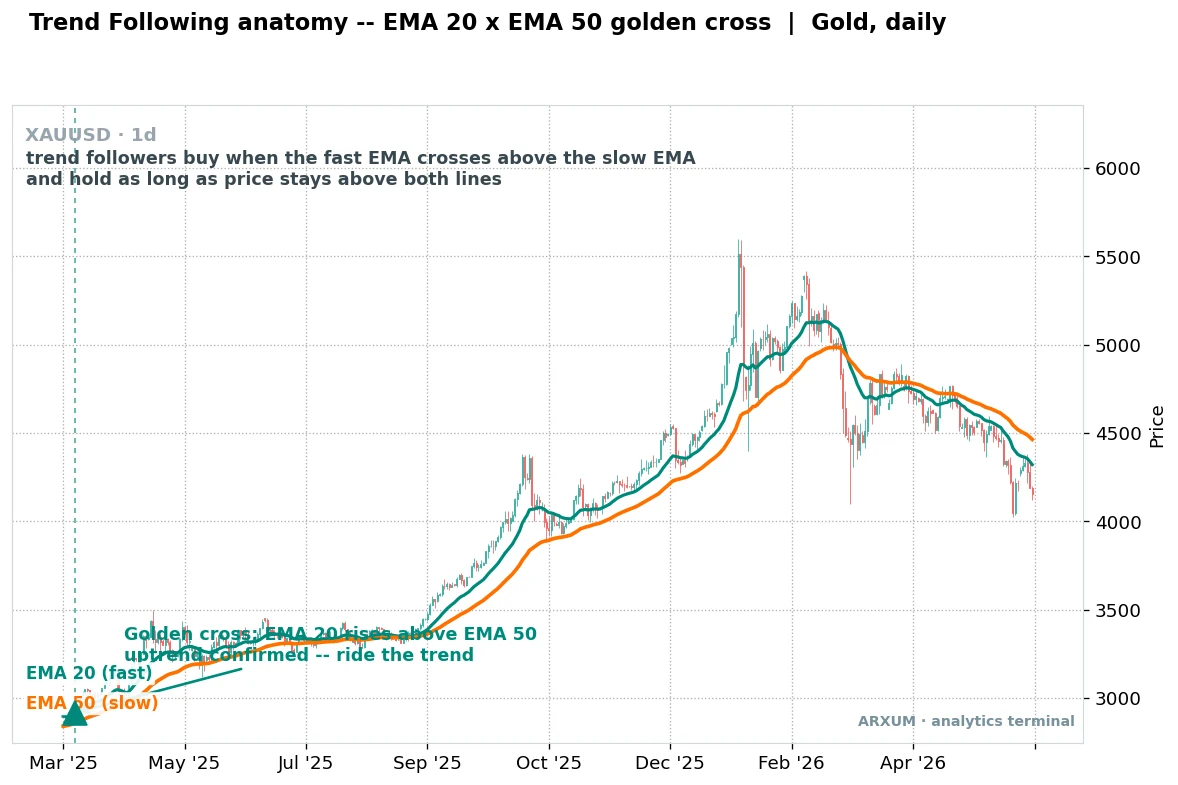
The two moving lines are EMAs. An EMA, or exponential moving average, is just the average price over a set number of bars, weighted so it reacts faster to recent moves.
The green line above averages the last 20 days, the orange line the last 50. When the fast line pushes above the slow line, the recent trend is stronger than the older one, and that is your buy signal.
You can read the full mechanics in our exponential moving average guide.
The core beliefs behind every trend system are short and stubborn:
- The trend is your friend. Trade in the direction the market is already going, not against it.
- Cut losers fast. A wrong trade is closed at a fixed stop, small and quick, no arguing with it.
- Let winners run. The whole method depends on a few big trends paying for many small losses.
- Don’t predict, react. You do not guess the top. You follow price until it clearly rolls over.
- Direction is the regime. Long when price is above the trend line, flat or short when it is below.
That last point matters. Trend following is not “always be buying.”
When gold rolls over at the right of the chart above and the fast EMA drops back under the slow one, the system is telling you the up move is done. You are out, and if you trade the short side, that flip is where you flip.
The three systems that ride a trend
Every trend-following method is a mix of three jobs: read the trend, enter the move, and filter out the chop. The three charts below are the classic tool for each job.
Learn one from each column and you have a working system.
System one: the moving average crossover
The moving average crossover is the trend read shown in the anatomy chart above. Two EMAs, one fast and one slow, and the cross between them is the trigger.
How it looks:
- Two lines track price, a fast one (20) and a slow one (50).
- Fast crosses above slow, a golden cross, and the trend is up. You buy or hold long.
- Fast crosses below slow, a death cross, and the trend is down. You exit or go short.
- While price stays above both lines and they point up, the trend is intact and you hold.
The value here is that it keeps you on the right side of a big move without any prediction. The gold run in the chart above is one long hold from the cross near the start to the flip at the end.
One trade, most of the move.
| Role | How you use it | Best read |
|---|---|---|
| Trend read | Fast EMA above slow EMA equals uptrend, below equals downtrend | Daily, gold and indices |
| Entry trigger | Buy on the close after the fast line crosses above the slow line | Daily / H4, trending markets |
| Exit cue | Close the trade when the lines cross back the other way | Same timeframe as entry |
| Regime filter | Only take longs while price sits above both lines | Daily, any liquid market |
Rule of thumb: the crossover is late by design. It never catches the exact bottom, and it gives back a piece at the top.
In exchange it keeps you in the meat of a long trend and out of most fake starts.
System two: the channel breakout
The second system enters on a breakout instead of a cross. It draws a channel around the last N days of price and buys when price closes outside it.
The classic version is the Donchian channel, the same tool the original Turtle traders used.
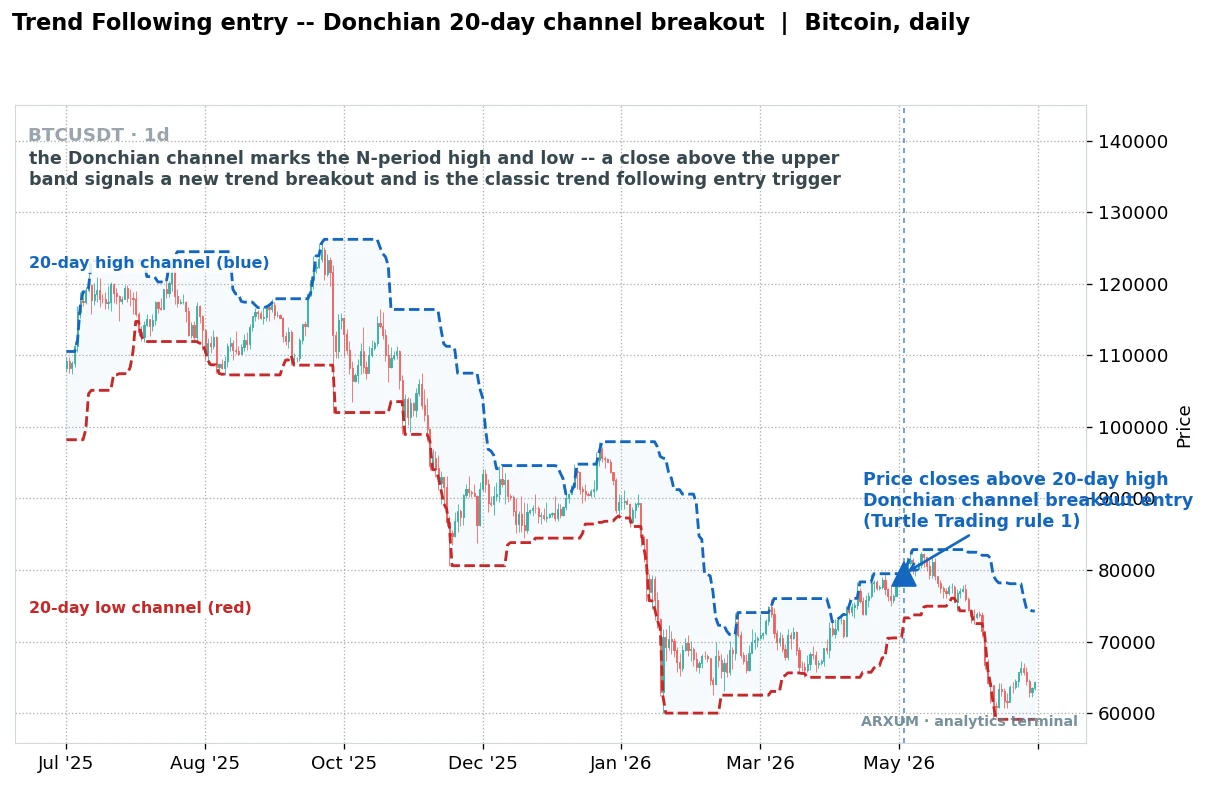
A Donchian channel is simple to read. The upper band is the highest high of the last N days, here 20, and the lower band the lowest low.
When today closes above that 20-day high, price has done something it has not done in a month, and that is your breakout. The band trails price, so in a downtrend the recent 20-day high sits well below the old highs, which is why a breakout can fire mid-decline and fail.
You can go deeper in the Donchian channel guide.
How it looks:
- A blue line marks the highest high of the lookback window, a red line the lowest low.
- Price closing above the upper band is a long breakout entry.
- Price closing below the lower band is a short breakout, or an exit for longs.
- The bands widen in a fast market and squeeze when price goes quiet.
| Role | How you use it | Best read |
|---|---|---|
| Entry trigger | Buy the close above the 20-day high, sell the close below the 20-day low | Daily, crypto and commodities |
| Trend read | Rising bands with price hugging the top equals a strong uptrend | Daily, trending markets |
| Exit cue | Exit a long on a close below a shorter channel, often the 10-day low | Daily, same market |
| Slow variant | Use a 55-day channel for major, longer trends and fewer signals | Weekly / daily, position trades |
Now the honest part. Look again at the Bitcoin chart, where that breakout fires in the middle of a broad downtrend and the market keeps chopping after it.
This is the breakout system’s weakness. In a range it hands you one false start after another, each a small loss, which is exactly why the third tool exists.
System three: the ADX filter
The ADX, or Average Directional Index, does not tell you which way to trade. It tells you whether a trend is strong enough to bother trading at all.
It reads 0 to 100, and the common line in the sand is 25.
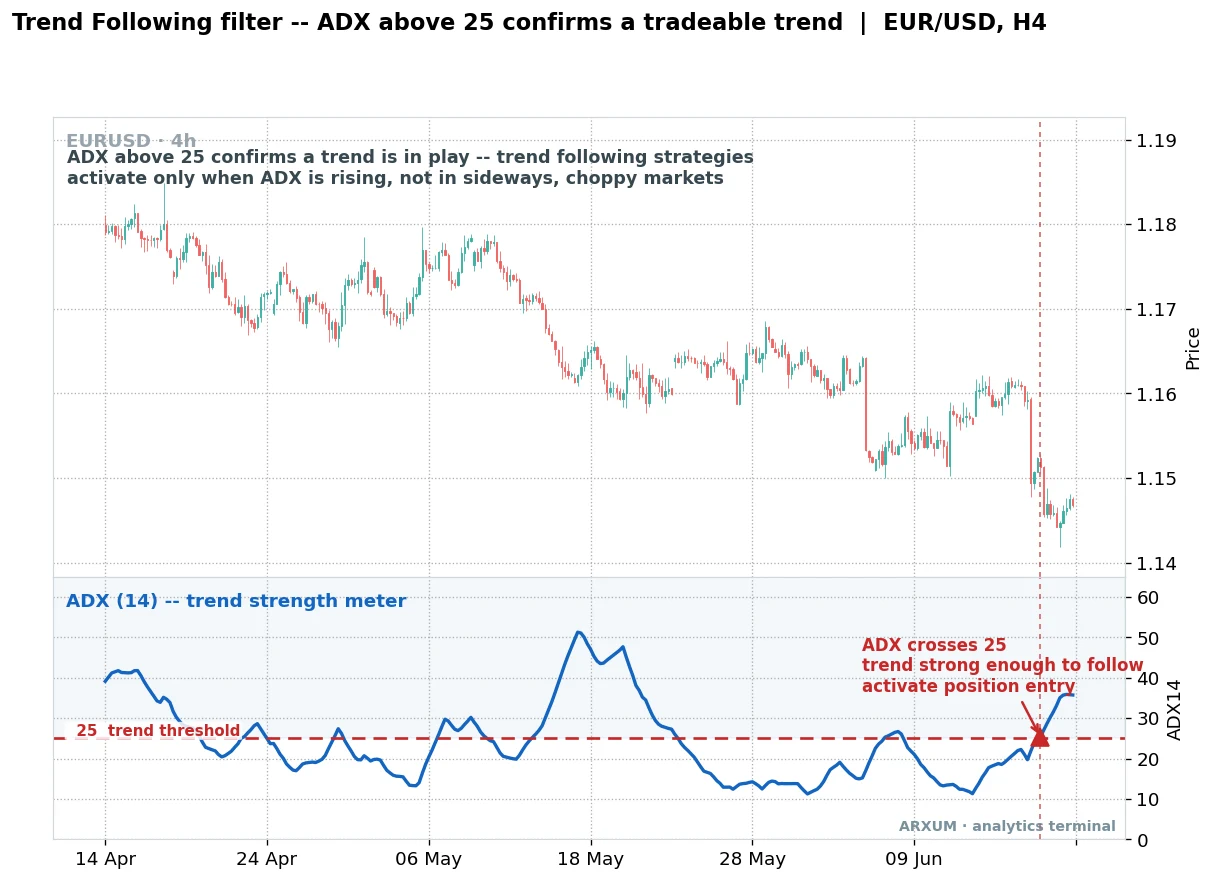
You add the ADX from your platform as its own panel under the price. On TradingView it is the built-in “Average Directional Index (ADX)” with a length of 14. Read it like a speedometer for the trend, not the direction:
How it looks:
- One line in a panel below price, moving between 0 and 100.
- Below 25: weak or no trend. The market is chopping. Trend trades get whipsawed here.
- Rising through 25: a real trend is building. This is the green light to act on your entry signal.
- Above 40 and falling: the trend is strong but may be running out of steam.
| Role | How you use it | Best read |
|---|---|---|
| Regime filter | Only take trend signals when ADX is above 25 and rising | H4 / daily, forex and metals |
| Chop avoidance | Stand aside while ADX is under 20, the market is ranging | Any timeframe, majors |
| Confirming gauge | A rising ADX backs up a fresh crossover or breakout entry | H4 / daily, trending markets |
| Warning cue | ADX peaking and turning down hints the trend is tiring | Daily, all markets |
In the EUR/USD chart the ADX spends most of the window under 25. A trend follower using this filter simply does nothing there.
The ADX only measures strength, not direction. In this window price is falling, so the cross above 25 would green-light a short, not a long.
That is the filter’s whole job: keep you out of the chop that quietly drains a trend account. Read the full mechanics in the ADX indicator guide.
Which tool to reach for
You do not use all three the same way on every market. The read, the entry and the filter fit different conditions.
This table maps them.
| Tool | Best when | Weak when | Typical timeframe |
|---|---|---|---|
| EMA crossover | Long, steady trends | Sharp reversals | Daily |
| Donchian breakout | Fresh momentum, new highs | Tight ranges | Daily / weekly |
| ADX filter | Deciding whether to trade | Never, always useful | H4 / daily |
| Trailing stop | Letting a winner run | Whippy, gappy markets | Any |
The strongest setups stack them. You wait for the ADX to rise through 25, take the crossover or the breakout in that direction, then ride it with a trailing stop until price closes back through your line.
The filter cuts the false starts, the entry gets you in, and the trail lets the trend pay.
Trend following versus mean reversion
Trend following has an opposite, and knowing the difference tells you which one to run in a given market. Mean reversion bets that price snaps back to an average.
Trend following bets that price keeps going.
| Question | Trend following | Mean reversion |
|---|---|---|
| Core bet | The move continues | Price returns to average |
| Buys | Strength, new highs | Weakness, oversold dips |
| Best market | Strong trends | Quiet ranges |
| Win rate | Often low, big winners | Often high, small winners |
| Worst enemy | Sideways chop | A runaway trend |
Neither is better in the abstract. They suit different regimes, which is why the ADX filter matters so much.
A high, rising ADX says trend follow. A flat, low ADX says the range traders are winning, so a mean reversion or range approach fits better.
The trend-following indicator menu
The three systems above are the classics, but plenty of indicators do a version of the same three jobs. If you want to test a few, here is the short menu.
Every one is a read, an entry or a filter, so slot it into the framework you already have.
| Indicator | What it does | Use it as |
|---|---|---|
| EMA / SMA | Smooths price into a trend line | Trend read |
| ADX | Measures trend strength | Regime filter |
| Donchian channel | Marks the N-day high and low | Breakout entry |
| ATR | Measures volatility | Stop and size |
| Parabolic SAR | Trails a dot behind the trend | Trailing exit |
| Supertrend | Flips a line to call the trend | Trend read and stop |
| Ichimoku cloud | Shows trend, support and momentum at once | All-in-one read |
| Momentum | How fast price is moving | Confirming gauge |
Rule of thumb: more indicators do not make a better system. Pick one from each job, learn how it behaves in a real trend and a real range, and stop there.
The ATR is the quiet workhorse of the group, because it sets both your stop distance and your position size from the market’s own volatility.
Where trend following breaks
No method wins everywhere, and a trend system fails in ways you can see coming. Knowing them is half the edge.
- Ranges eat it alive. In a sideways market, every breakout is a fake and every cross reverses. This is the number one killer.
- Whipsaws. A whipsaw is a signal that reverses right after you act on it, handing you a quick loss. Fast settings on a quiet market produce a string of them.
- The give-back at the top. Trend exits are always late, so you hand back a chunk of the move when the trend finally turns.
- Low win rate. Most trend trades lose. The method only works if you actually let the few winners run, which is harder than it sounds.
- Gaps and news. A shock move can jump your stop, so the loss is larger than planned. Check the calendar before major events.
The honest summary: trend following pays in the minority of the time when markets truly trend, and it slowly bleeds the rest of the time. Your job is to trade small in the chop and hold big in the trend, not the other way around.
Trading it with a plan
Trend following is only as good as the risk rules around it. The system finds the move.
Discipline is what keeps a losing streak from ending your account.
- Risk a small fixed slice per trade. A common rule is no more than 2% of the account on any one trade, so a run of losers is survivable. See position sizing for the math.
- Set the stop before you enter. Place it where the trend idea is proven wrong, often below the recent swing low, the last dip before the move, for a long. Size the trade so that distance equals your fixed risk.
- Let the reward outrun the risk. Trend trades work because the winners are multiples of the losers. If a setup can only pay 1:1, skip it.
- Trail, do not target. Instead of a fixed take-profit, use a trailing stop so a strong trend can run far past any level you would have guessed.
- Expect the streak. A low win rate means four or five losses in a row is normal, not a signal to quit. If that becomes six or more, step back and check whether the regime has changed.
That fixed slice is easy to turn into a real position size. Here is the arithmetic on a small account.
A quick sizing example, $500 account:
- Risk per trade: 2% of $500 = $10.
- Stop distance: say 50 pips on EUR/USD, where a micro lot is worth about $0.10 per pip.
- Risk per micro lot: 50 × $0.10 = $5.
- Position size: $10 ÷ $5 = 2 micro lots, the size that makes a stop-out cost exactly your $10.
The numbers change with the market and the stop, but the steps never do: fixed dollar risk, divided by the risk per unit, gives the size to trade. Nothing here is guessed.
You also want an execution venue that quotes the markets you trend cleanly. Tight spreads on gold, the majors and crypto CFDs matter more over a long trend hold than most beginners think.
None of this is a promise of profit. Trend following is a durable idea with a long history behind it, but it demands patience through the losing stretches and the discipline to hold when a trade is finally working.
Trade only money you can afford to lose, and treat the first months as learning, not earning.
What works, in three lines
- Read the trend with a moving average crossover, and stay on the side price is already moving.
- Enter the move on a Donchian breakout, and only when the ADX is above 25 so you skip the chop.
- Ride it with a trailing stop, cutting losers fast and letting the rare big winner pay for the rest.
Glossary
- EMA (exponential moving average): an average of recent prices, weighted to react faster to the latest bars. A trend read.
- ADX (Average Directional Index): a 0 to 100 gauge of trend strength. Above 25 means a trend worth trading.
- Donchian channel: the highest high and lowest low over the last N days, used to spot breakouts.
- Golden cross: a fast moving average crossing above a slow one, a bullish trend signal.
- Breakout: price closing beyond a recent range, often the start of a new trend.
- Whipsaw: a signal that reverses right after you act on it, giving a fast loss.
- Trailing stop: a stop that follows price at a set distance, locking in gains as a trend runs.
- Reward-to-risk (1:X): how many times your risk a trade can make back. The 1 is the risk, the X is the reward.
FAQ
What is trend following, in plain terms?
It is trading in the direction a market is already moving. You wait for a clear trend, join it, and hold until it ends, instead of trying to pick tops and bottoms. The two rules that make it work are simple: cut a losing trade quickly, and let a winning trade run as long as the trend lasts.
How does trend following work?
You spot a trend with a tool like a moving average crossover or a channel breakout, enter in that direction, and set a stop where the idea is proven wrong. Then you hold, often with a trailing stop, until price clearly turns. Most trades are small losses, and a few big winners in strong trends pay for all of them, so the discipline to hold the winners is where the money is made.
What are the best trend following indicators?
There is no single best one. A moving average crossover reads the trend, a Donchian channel catches the breakout, and the ADX filters out the chop. Beyond those, Supertrend, Parabolic SAR and the Ichimoku cloud all do a version of the same jobs. The ATR is the quiet workhorse, because it sets both your stop distance and your position size. Pick one tool for each job and stop there, rather than stacking a dozen.
What is the best timeframe for trend following?
The daily chart is the classic home for trend following, because trends there are cleaner and you get fewer false signals than on fast charts. The H4 works well for forex when paired with an ADX filter. Anything below the 1-hour chart tends to be mostly noise for a trend system, since the small moves reverse before a real trend can build.
Does trend following work in crypto?
Yes, and crypto is one of its better homes because Bitcoin and the majors move in long, strong trends. The Donchian breakout in the chart above is a crypto example. The catch is that crypto also chops hard between trends, and its volatility is larger, so stops need more room and position sizes need to be smaller. The ADX filter earns its keep here by keeping you out of the sideways stretches.
Is trend following actually profitable?
It has one of the longest track records of any style, and whole managed-futures funds run on it. That does not make it easy. The win rate is usually low, most trades lose a little, and the profit comes from a handful of big trends. It only works if you follow the rules through the losing streaks and actually let winners run, which is where most people fail. It pays in trending markets and slowly bleeds in ranges.
How much money do I need to start?
Enough to risk a small fixed slice per trade and still place a sensible stop. On a small account, trading micro lots on the majors or a fraction of a crypto CFD keeps the risk per trade near 2% of the balance. The bigger point is that a starting balance is for learning the method, not for turning into income in the first months. Trade only money you can afford to lose.
Trend following or mean reversion, which is better?
Neither wins everywhere. They suit opposite conditions. Trend following pays when a market is moving strongly in one direction, and mean reversion pays when a market is quiet and stuck in a range. This is why the ADX filter is so useful: a high, rising ADX favors trend following, while a flat, low ADX favors a range or mean reversion approach. Many traders run both and let the market's condition decide which one is switched on.
🌍 Our recommended brokers


Reader Reviews
Be the first to review this — tell other traders what actually helped, or where it fell short.
Leave a Review

Forex Analyst & Senior Trader
Former FX desk trader with 8 years in institutional forex. Works in multi-timeframe analysis and order flow, turning desk experience into systematic, testable rules across forex and metals.