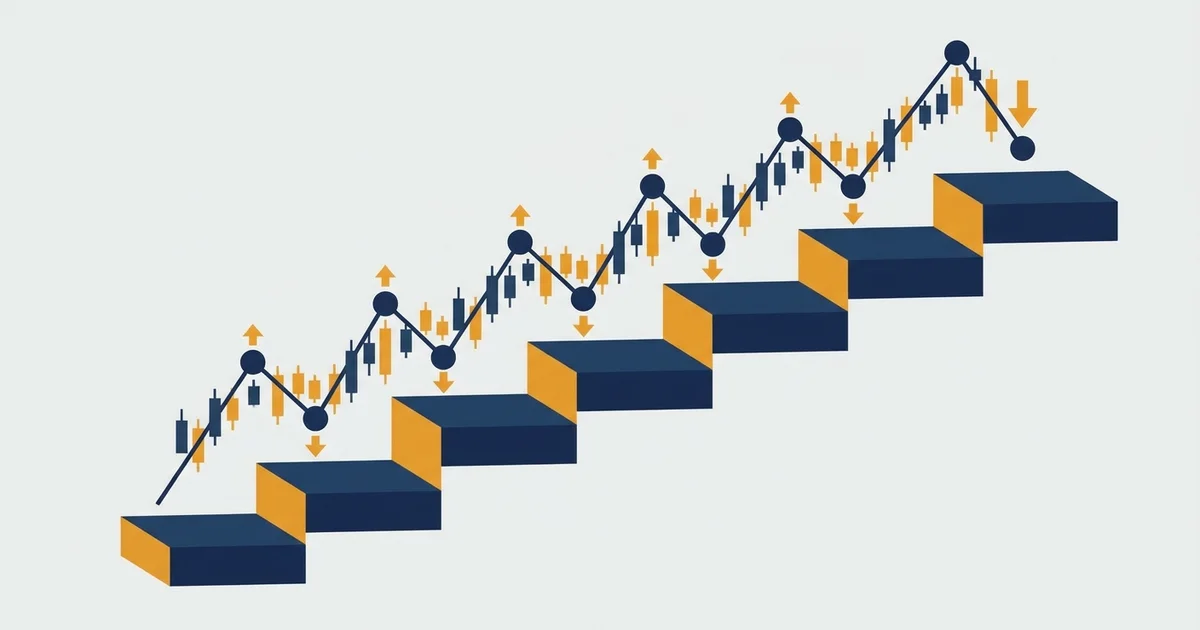

What Dow theory actually is
Dow theory, sometimes called Dow theory technical analysis, is the grandparent of every trend tool you use. Charles Dow never wrote it down as one system.
Editors built the six tenets from his editorials after he died, and almost all of modern charting sits on top of them.
Here is the whole idea on one chart before we break it into parts.
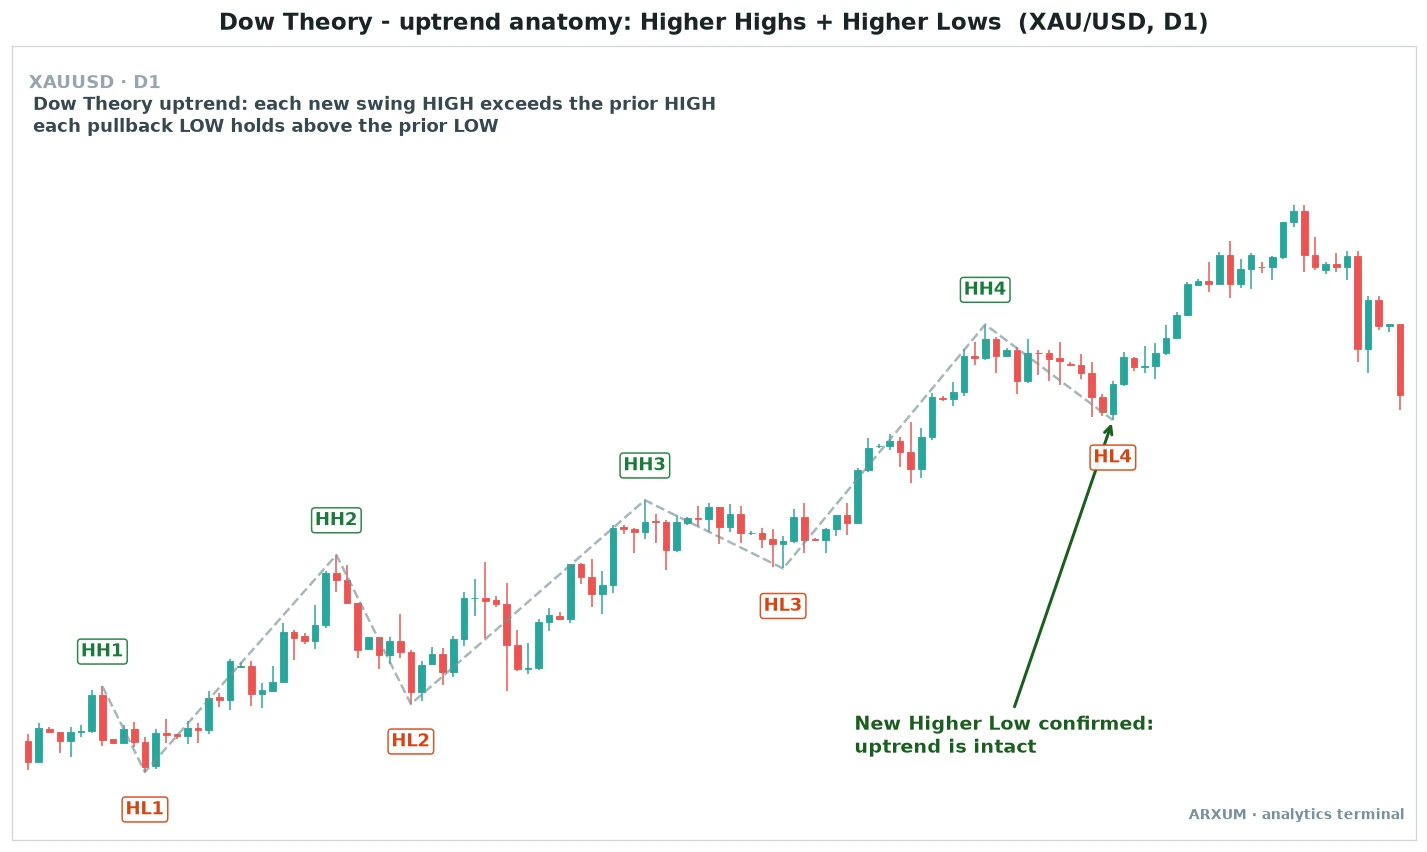
Read the picture as a staircase, not a line:
- A swing high is a peak where price turned back down. A swing low is a trough where it turned back up.
- An uptrend is a run of higher highs (each peak taller than the last) and higher lows (each dip shallower than the last).
- A downtrend is the mirror: lower highs and lower lows, a staircase heading down.
- The trend is alive while the staircase holds. It is in question the moment a step fails to clear the one before it.
That single read, higher highs and higher lows for up, lower highs and lower lows for down, is the beating heart of Dow theory. Everything below is detail hung on that frame.
The six tenets of Dow theory
Editors distilled them from Charles Dow’s scattered editorials, and they work less like a checklist than like six lenses on the same market.
| Tenet | What it says | Why it matters |
| 1. The averages discount everything | Price already reflects all known news | You read price, not headlines |
| 2. Three trends run at once | Primary, secondary and minor | Trade the tide, not the ripples |
| 3. Primary trends have three phases | Accumulation, participation, distribution | Tells you how mature a move is |
| 4. The averages must confirm | Two related markets should agree | A lone move is suspect |
| 5. Volume confirms the trend | Volume expands in the trend's direction | Thin moves lack conviction |
| 6. A trend runs until it clearly reverses | Assume continuation until proven wrong | Stops you calling tops early |
Two of these do most of the day-to-day work:
- Tenet 2 keeps you honest about which move you are trading. Most losing trades come from fighting the primary trend on a secondary wiggle.
- Tenet 6 is the discipline. It says the burden of proof is on the reversal, so you stay with a trend until price gives you a concrete reason to quit, not a feeling.
The three types of trend
The second tenet is the one you use every session, so it earns its own table. All three trends are running inside each other at the same time.
| Trend | Typical length | What it is | How to treat it |
| Primary | Months to years | The main tide | Trade in its direction |
| Secondary | Days to weeks | A counter-trend correction | Entry chances, not reversals |
| Minor | Hours to days | Daily noise and chop | Mostly ignore it |
The classic Dow image is the sea:
- The primary trend is the tide, the direction the water is really going.
- The secondary trend is a wave rolling against the tide, big enough to soak you if you mistake it for the tide turning.
- The minor trend is the ripple on the wave, too small to trade and too easy to overreact to.
Rule of thumb: find the primary trend first, then use secondary corrections to join it at a better price. A higher low forming after a pullback is the classic spot, and it pairs naturally with plain support and resistance, since that higher low usually sits on an old level.
The three phases of a primary trend
Here Dow theory stops being geometry and starts being about crowd behaviour. Accumulation, participation and distribution each carry a different mix of players and mood.
| Phase | Who is acting | What price does | Crowd mood |
| Accumulation | Informed money buys quietly | Quiet basing, low interest | Fear, boredom |
| Public participation | Trend followers pile in | The big, obvious trending leg | Growing confidence |
| Distribution | Informed money sells out | Choppy topping, churn | Euphoria, greed |
The phases explain why the news feels backwards at turns:
- Accumulation happens when the story is still ugly. The base builds while most traders have given up, which is exactly the accumulation stage smart money likes.
- Public participation is the easy middle. The trend is obvious, the moves are clean, and this is where trend following actually pays.
- Distribution is the trap. Price churns near the highs while the crowd is most bullish, and it is where a bull market quietly hands off to a bear market.
Volume confirms the trend
The fifth tenet says price and volume should agree. In a real trend, volume grows when price moves with the trend and dries up when price pulls back against it.
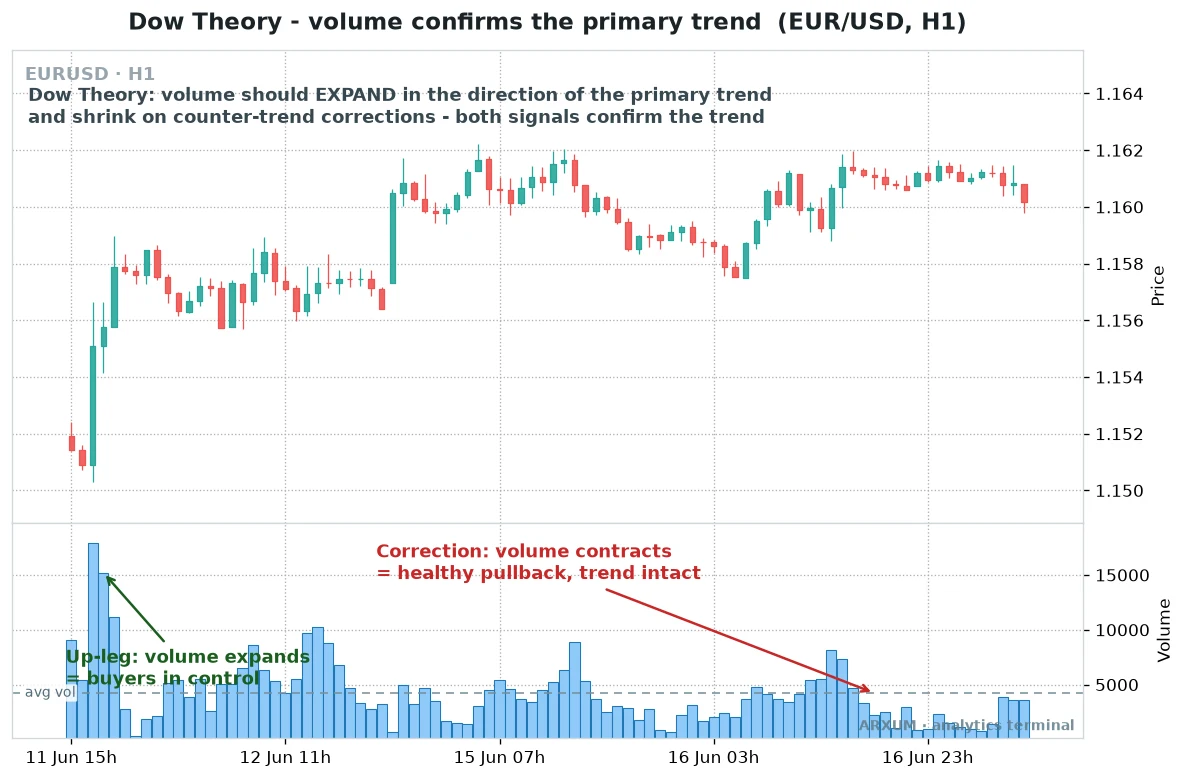
What good and bad volume look like:
- Healthy trend: heavy volume on moves in the trend’s direction, light volume on the pullbacks. Buyers show up to push, and there is little supply to pull it back.
- Warning sign: a new price high on shrinking volume. Fewer traders are chasing the move, so conviction is fading even if price still ticks up.
- Correction, not reversal: a pullback on light volume is usually just profit-taking, the secondary trend at work, not the primary turning.
| Volume reads | What it says | Take |
| Rising with the trend | Real conviction | Trend is confirmed |
| Falling on a pullback | Just profit-taking | Correction, stay with the trend |
| Falling on a new high | Fading interest | Warning, tighten up |
| Rising on a reversal break | Sellers taking over | Reversal gains weight |
One honest note for forex traders. Spot forex has no central exchange, so the volume you see is your broker’s tick volume, a count of price changes rather than true contracts.
It still tracks activity well enough to read the trend, but treat it as a proxy, not a precise figure.
The averages must confirm each other
The fourth tenet is the one people forget. Dow watched two indexes, the Industrials and the Railroads, and refused to trust a trend unless both made new extremes together.
If one raced ahead while the other lagged, he called the move unconfirmed and suspect.
| Dow's original read | Modern equivalent | The signal |
| Industrials make a new high | One market breaks out | Half a signal only |
| Rails confirm the new high | Its related market breaks too | Confirmed, trust the trend |
| Rails fail to confirm | The related market lags | Divergence, stay cautious |
You can borrow the same habit without the stock indexes:
- Pair related markets. Gold and silver, the S&P and the Nasdaq, Bitcoin and the wider crypto market. If gold breaks to a new high, a real move usually drags silver up too.
- A break in one market that its cousin refuses to confirm is a weak break. That disagreement is a form of divergence, and it is a reason to wait.
- Confirmation is not a timing tool. It is a conviction filter that tells you whether a breakout has the whole market behind it or just one instrument running alone.
When a trend reverses: the failure swing
Tenet six says a trend runs until it clearly reverses, so the obvious question is what counts as clear. Dow theory has a precise answer, and it is pure structure.
An uptrend reverses when price makes a lower high and then breaks below the last higher low.
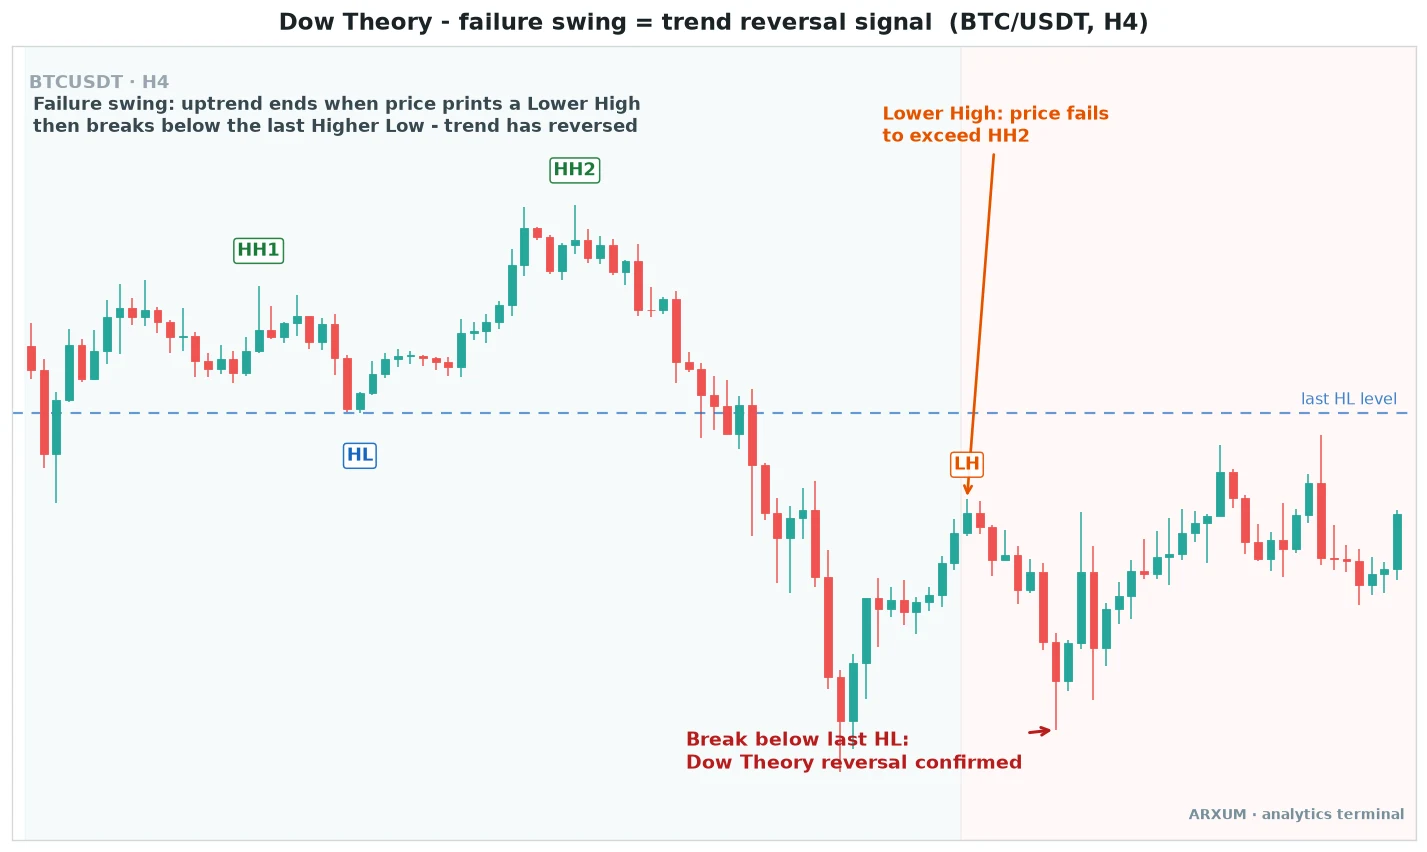
The reversal has two parts, and you need both:
- The lower high. Price rallies but stops short of the prior peak. On its own this is only a warning, since trends can pause and still resume.
- The broken higher low. When price then closes below the most recent higher low, the sequence of higher highs and higher lows is dead. That break is the confirmation.
- A downtrend reverses the same way in reverse: a higher low, then a close above the last lower high.
| Signal | Uptrend reversing | Downtrend reversing |
| First warning | A lower high forms | A higher low forms |
| Confirmation | Close below last higher low | Close above last lower high |
| Volume tell | Volume expands on the break | Volume expands on the break |
Takeaway: one lower high is a caution, not a sell. Wait for the broken swing before you accept the trend has turned.
This is also why a breakout below an old higher low carries more weight than a random line break: the level meant something to the trend.
Dow theory across markets and timeframes
The best thing about Dow theory is that it does not care what you trade. Any market with a real two-sided flow prints the same higher-high, higher-low structure, and the same reversal rule holds.
Only the speed changes.
| Market / timeframe | How the structure reads | Note |
| Gold (XAU/USD), D1 | Clean, wide HH and HL swings | Primary trend is easy to map |
| EUR/USD, H1 | Volume confirms intraday legs | Session moves are the secondary trend |
| Bitcoin (BTC/USDT), H4 | Sharp swings, fast reversals | Failure swings come quickly |
| Stock indices, D1 | Where Dow first read it | The two-average confirmation still fits |
A couple of points travel with the theory whatever the chart:
- The timeframe sets the trend size. A daily higher-high sequence is the primary trend for a swing trader, but only the minor trend for someone holding for months. Pick the timeframe that matches your holding period.
- Higher timeframes reverse less often and mean more. A broken higher low on the daily is a bigger event than the same break on the 5-minute, where noise fakes it constantly.
- The read is fractal. The same staircase shows up on a monthly chart and a 1-minute chart, which is why price action traders lean on it so heavily.
Dow theory vs Elliott Wave and market structure
Dow theory gets compared to a few frameworks that grew out of it. They overlap because they are all describing the same swings.
| Framework | What it focuses on | Relation to Dow theory |
| Dow theory | Trend direction via HH and HL | The foundation |
| Elliott Wave | Counting waves inside the trend | Adds structure to Dow's phases |
| Market structure | The same HH and HL swings | Dow theory in modern words |
| Trend following | Riding the primary trend | Dow theory turned into a tactic |
The short way to hold them apart:
- Elliott Wave takes Dow’s three phases and counts them out as five waves up and three back. It is Dow theory with a finer ruler, and the Elliott Wave guide covers the counts.
- “Market structure,” the term you see all over social media, is largely Dow theory rebranded. Break of structure and change of character are the failure swing under new names.
- Trend following is Dow theory as a plan: find the primary trend, join it on secondary pullbacks, exit when the structure breaks.
How to use Dow theory: a simple routine
You need no special tool, just a clean chart and the patience to mark swings. A free chart on TradingView with the candles and a volume panel is enough.
A repeatable read, top to bottom:
- Pick your timeframe to match how long you hold. That chart’s swings are your primary trend.
- Mark the recent swing highs and lows. Higher highs and higher lows mean up, lower highs and lower lows mean down, sideways means no trend.
- Trade with the primary trend, and use a secondary pullback to a higher low as your entry area, not a reason to flip.
- Check volume. It should expand with the trend and fade on the pullback. A new high on thin volume is a yellow flag.
- Ask for confirmation from a related market before you trust a fresh breakout. A move its cousin refuses to follow is a weak move.
- Hold the trend until the structure breaks: a lower high and then a close below the last higher low. Size the trade against that swing, and check the reward against the risk before you click.
Two habits keep the routine honest:
- Do not anticipate the reversal. One lower high is not a top. Waiting for the broken swing costs you a few points and saves you from calling tops that never come.
- Let the higher timeframe lead. If the daily is a clean uptrend, treat H1 downswings as corrections to buy, not trends to short. Mixing timeframes without ranking them is the fastest way to trade against the tide.
What actually works with Dow theory
The short version to remember:
- Structure is the signal. Higher highs and higher lows is an uptrend, lower highs and lower lows is a downtrend, and everything else is detail.
- The primary trend rules. Trade with the tide, use secondary pullbacks to join it, and ignore minor noise.
- Reversals need proof. A lower high warns, but only a close through the last higher low confirms the turn.
The risk, kept honest
Dow theory is a way to read the trend, not a promise about the next candle:
- It is built for the primary trend, so it lags at turns on purpose. You will always give back part of a move waiting for the structure to break, and that is the price of not calling false tops.
- Whipsaws are real on fast, low timeframes. On a 5-minute chart, minor noise fakes higher lows and broken swings constantly, which is why the theory shines on daily and 4-hour charts and struggles on the very short ones.
- A range has no trend. When price is churning sideways with no clean higher highs or lower lows, Dow theory gives you nothing, and forcing a trend read onto chop is how the losses start.
- It reads structure, so pair it with volume and a confirming market rather than trading a single swing in isolation.
Key terms
- Dow theory: the six-tenet framework for reading market trends through swing structure, volume and confirmation.
- Primary, secondary and minor trends: the three trend sizes running at once, from the multi-month tide down to daily noise.
- Higher high and higher low (HH, HL): the rising peaks and troughs that define an uptrend.
- Lower high and lower low (LH, LL): the falling peaks and troughs that define a downtrend.
- Failure swing: the reversal signal, a lower high followed by a close below the last higher low (or the mirror in a downtrend).
- Confirmation: two related markets making the same move, and volume expanding with the trend, both used to trust a signal.
FAQ
What is Dow theory, in plain terms?
Dow theory is the original set of rules for reading market trends, drawn from the writing of Charles Dow. Its core idea is simple: an uptrend keeps making higher highs and higher lows, and a downtrend keeps making lower highs and lower lows. The trend is assumed to continue until price breaks that structure, and volume plus related markets are used to confirm the move.
What are the six tenets of Dow theory?
They are: the averages discount everything, the market has three trends running at once, primary trends move through three phases, the averages must confirm each other, volume confirms the trend, and a trend continues until it clearly reverses. Together they tell you to read price, follow the primary trend, and wait for a structure break before you accept a reversal.
What are the three types of trend in Dow theory?
The primary trend is the main direction, lasting months to years. The secondary trend is a counter-move against it, lasting days to weeks, which often gives you a better entry price. The minor trend is short-term noise, lasting hours to days, and it is mostly ignored. Dow pictured them as the tide, the waves, and the ripples.
What are the three phases of a primary trend?
Accumulation, public participation, and distribution. In accumulation, informed buyers step in quietly while the crowd is still fearful. In public participation, trend followers pile in and price makes its big, obvious move. In distribution, informed money sells into the euphoria near the top while the public is most bullish. The same three phases run in reverse for a downtrend.
How do you confirm a trend with Dow theory?
Two ways. First, volume should expand when price moves with the trend and shrink on counter-trend pullbacks, which shows real conviction. Second, a related market should make the same move: if gold breaks to a new high, silver usually follows. A breakout that its cousin refuses to confirm, or one on fading volume, is treated as weak and suspect.
What is a Dow theory trend reversal?
It is a failure swing. An uptrend reverses when price first makes a lower high, failing to exceed the prior peak, and then closes below the most recent higher low. That break ends the sequence of higher highs and higher lows. A downtrend reverses the same way in reverse: a higher low, followed by a close above the last lower high. One lower high alone is only a warning.
Does Dow theory still work today?
Yes, because it describes something markets still do: trend in swings. Almost all modern charting, from trend following to the "market structure" language on social media, is built on its higher-high, higher-low read. It works best on daily and 4-hour charts, where structure is clean, and struggles on very fast timeframes and in sideways ranges, where noise fakes the signals.
What is the difference between Dow theory and Elliott Wave?
Dow theory gives you the big picture: trend direction, phases, and confirmation. Elliott Wave takes those phases and counts them in detail as five waves in the trend's direction and three against it. Elliott Wave is essentially Dow theory measured with a finer ruler, so many traders use Dow theory for the direction and Elliott Wave for the internal structure.
🌍 Our recommended brokers


Reader Reviews
Be the first to review this — tell other traders what actually helped, or where it fell short.
Leave a Review

Momentum Trader & Technical Analyst
Trades momentum across crypto and forex since 2019, built around RSI, MACD, and volume. Turns discretionary setups into rule-based, systematic entries and validates them on data before they go live.