
What a bear market actually is
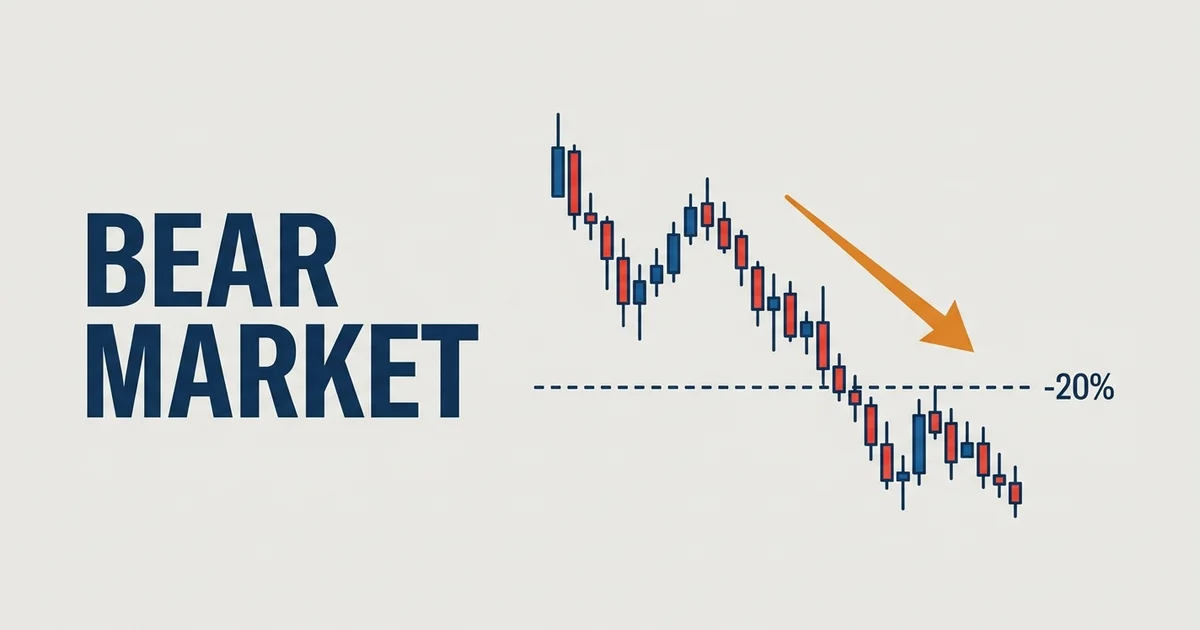
A bear market is a market in a lasting decline, not a bad day or a quick dip. The clean, widely quoted definition is a drop of 20% or more from a recent high that sticks.
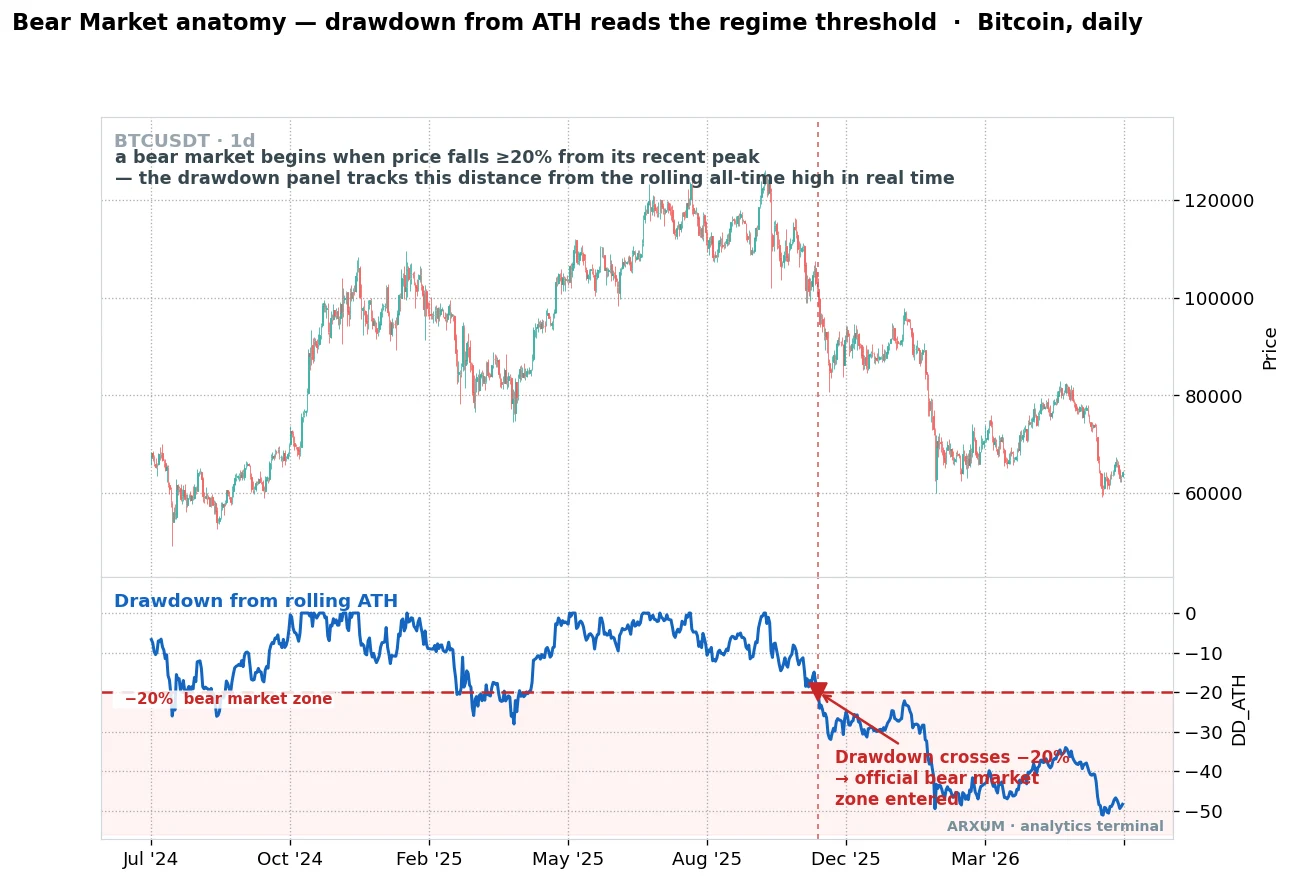
The plainest way to see it is the distance between price and its own peak, drawn under the chart.
What the chart is showing:
- The top panel is price. The bottom panel is the drawdown, how far price has fallen from its highest point so far, in percent.
- The shaded band under the minus 20% line is the bear market zone. Above it and shallow is a healthy pullback, below it and holding is a bear market.
- The dashed vertical line marks the moment the drawdown crosses minus 20%. That crossing is the trigger the whole market watches.
- The read: a 10% dip is a correction and normal. A 20% drop that will not recover is a change of regime, and it usually keeps going before it stops.
The thresholds most desks use are simple and worth memorising:
| Fall from the high | Name | What it usually means |
|---|---|---|
| Under 10% | Pullback | Noise inside a trend |
| 10% to 20% | Correction | A warning, often recovers |
| 20% or more, holding | Bear market | Regime change, trend is down |
| 50%+ (common in crypto) | Deep bear | Full cycle unwind |
The 20% figure is a convention, not a law of physics. It matters because it is the number the whole market agrees to watch, so it moves behaviour once it breaks.
Bear market vs bull market
The two regimes are opposites in structure, not just direction. Knowing which one you are in decides whether you should be buying dips or selling rallies.
| Feature | Bull market | Bear market |
|---|---|---|
| Trend | Higher highs, higher lows | Lower highs, lower lows |
| Price vs 200-day | Above and rising | Below and falling |
| Dips | Get bought | Get sold |
| Momentum (RSI) | Holds above 50 | Stalls under 50 |
| Crowd mood | Greed, FOMO | Fear, denial |
| What works | Buy and hold, breakouts | Short rallies, cash, defence |
The single most useful line to carry:
- In a bull market you buy weakness. Dips are discounts because the trend keeps rescuing them.
- In a bear market you sell strength. Rallies are exits because the trend keeps swallowing them.
- The regime, not the setup, decides. The same breakout that pays in a bull fails in a bear. Read the regime first, then pick the trade.
The phases a bear market moves through
A bear market is a sequence, not a single drop. It tends to move through the same four stages, and knowing the stage tells you what to expect next.
| Phase | What happens | The tell |
|---|---|---|
| Distribution | Smart money sells the top to eager dip-buyers | New highs fail, breadth thins |
| Breakdown | Support gives way, the 20% line breaks | Death cross forms, RSI under 50 |
| Capitulation | Panic selling, everyone gives up at once | Volume spike, deep oversold, long wicks |
| Basing | Selling exhausts, price grinds sideways | Higher lows, RSI reclaims 50 |
How to think about each stage:
- Distribution looks like a top that will not quite break out. The Wyckoff idea of quiet selling into strength lives here.
- Breakdown is where most of the technical damage happens fast. This is the stage the three reads below are built to catch.
- Capitulation feels like the end of the world and is often near the low, but catching it live is where most traders get hurt.
- Basing is dull on purpose. The bottom is a process of exhaustion, not a single V-shaped candle.
Three reads that confirm a bear market
You do not need a headline to tell you the regime turned. Three chart reads, stacked from slow to fast, do the job: the drawdown you already saw, the death cross, and momentum stuck under its midline.
One alone can fool you, so the value is in agreement.
The death cross: the long averages roll over
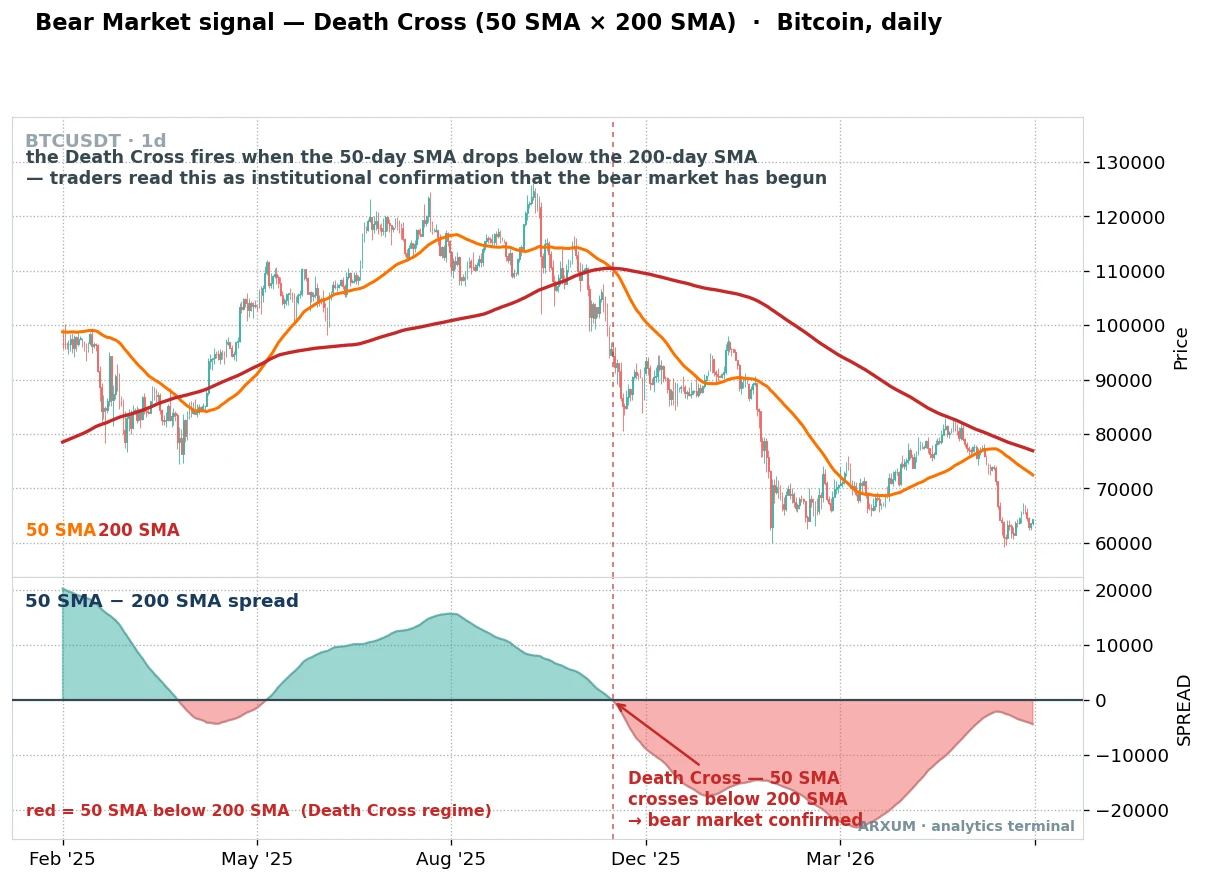
The most watched structural signal is the death cross, when the 50-day moving average drops below the 200-day. A moving average is just the average price over a window, so the 50-day tracks the medium trend and the 200-day tracks the long one.
What the labels mean:
- The orange line is the 50-day average, the medium trend. The dark red line is the 200-day, the long trend.
- The lower panel is the gap between them. Green above zero means the 50-day is on top and the trend is up. Red below zero is the death cross regime.
- The dashed vertical line marks the cross itself. Once the spread goes red and stays red, the long trend is down.
- The read: the death cross is slow and lags the top, so it will not call the exact high. What it does well is confirm a downtrend is real rather than a scare, which is exactly what you want before you trade the short side. Full mechanics live in the death cross guide.
| Role | How you use it | Best read |
|---|---|---|
| Regime read | 50-day below 200-day = bear structure | Daily, any market |
| Trend filter | Only take shorts while the spread is red | Daily, all instruments |
| Confirmation | Backs up a drawdown already past 20% | Daily, stocks and crypto |
| Weakness | Lags the top, whipsaws in a range | Avoid in choppy markets |
Rule of thumb: the death cross confirms a bear, it does not predict one. Treat it as proof the trend is down, not as your entry timer.
RSI stuck below 50: momentum stays bearish
The fast read is momentum. RSI is a gauge that runs from 0 to 100 and measures how strong recent moves are.
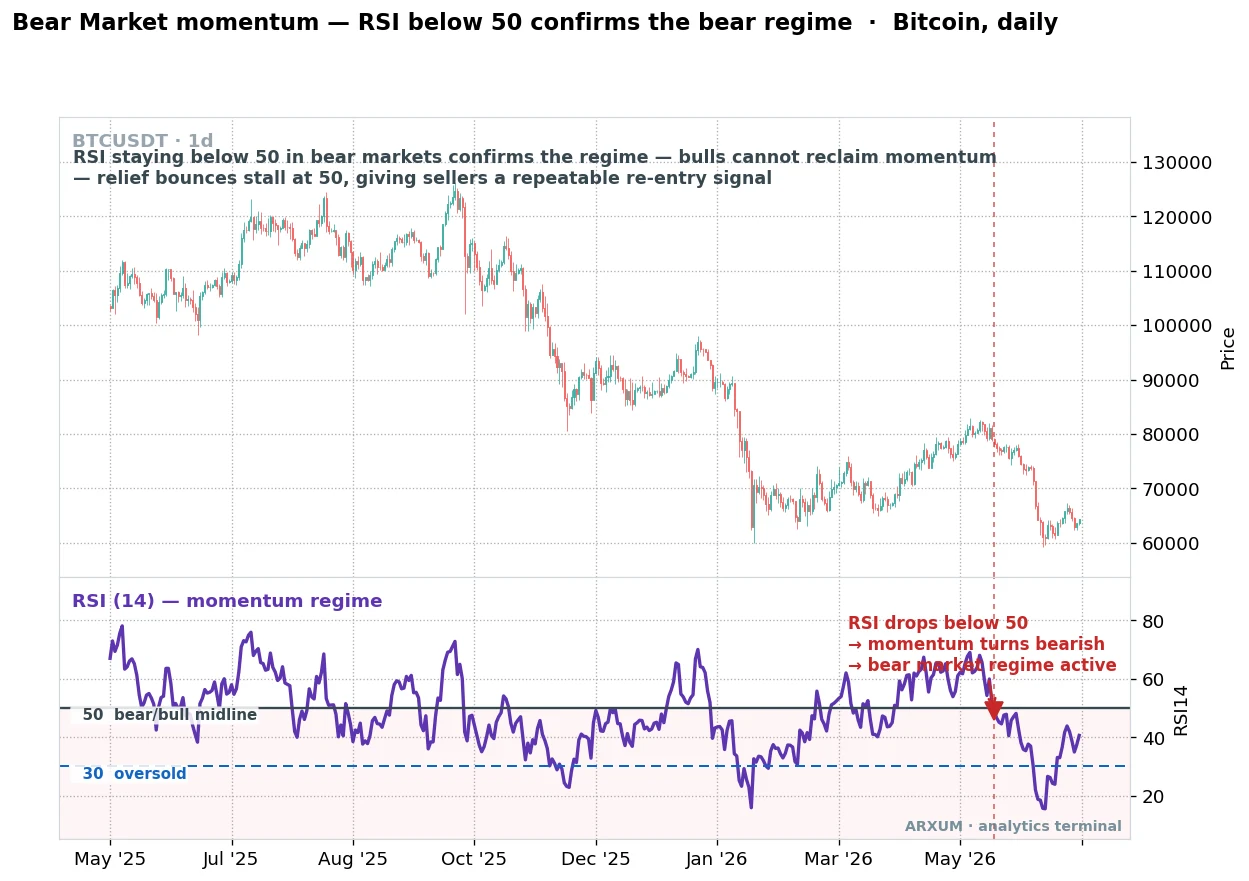
Above 50 is bullish momentum, below 50 is bearish, and in a bear market RSI keeps failing at that midline.
What the labels mean:
- The purple line in the lower panel is RSI. It rises when buyers are strong and falls when sellers take over.
- The 50 line is the neutral middle. In a bear market, rallies push RSI up toward 50 and then stall, instead of pushing through it.
- The 30 line is the oversold mark. In a downtrend price can sit oversold for a long time, so 30 is not a buy button.
- The read: the tell is not one dip under 50, it is the failure to reclaim it. Each rejection at 50 is a place sellers step back in. See the RSI guide for the full picture.
| Role | How you use it | Best read |
|---|---|---|
| Momentum read | RSI capped under 50 = bears in control | Daily, any market |
| Re-entry cue | A bounce rejecting at 50 = sell the rally | Daily and 4-hour |
| Trap warning | Oversold under 30 can stay there for weeks | Do not buy on 30 alone |
| Turn hint | RSI finally reclaiming 50 = momentum shifting | Early basing signal |
Rule of thumb: in a bear market the 50 line is the ceiling, not the floor. Bounces that die there are the trade, not the recovery.
The three reads, stacked
| Question | Read | Bear looks like |
|---|---|---|
| How deep is the fall? | Drawdown from the high | Down 20% or more, holding |
| Is the long trend down? | 50/200 death cross | 50-day below 200-day, spread red |
| Is momentum bearish? | RSI midline | RSI stalling under 50 |
How to weigh them:
- All three agree: the cleanest bear signal. Deep drawdown, death cross confirmed, RSI capped under 50. Trade the short side and treat rallies as exits.
- Drawdown only: a fast 20% drop with no death cross yet. Could be a violent correction that snaps back. Stay cautious, not committed.
- Death cross without capitulation: the trend is down but the crowd is calm. Often more downside to come as fear catches up.
- RSI reclaiming 50: the first crack in the bear case. One read turning is not the all-clear, but it is where you start watching for a base.
How a bear market looks across the markets
A bear market is not only a crypto or stock event, but it wears a different face in each market. The 20% rule fits assets with a clear all-time high.
Forex and gold are read through trend and risk appetite instead.
| Market | Bear trigger | How it behaves | Where money hides |
|---|---|---|---|
| Stocks, indices | Down 20% from the high | Slow grind, lower highs | Cash, defensives, bonds |
| Crypto | 20% is a formality | Violent, 50 to 80% drops | Stablecoins, cash |
| Gold (XAU/USD) | No fixed line, safe-haven | Often rises when stocks fall | It is the hiding place |
| Forex majors | Risk-off, not a 20% rule | USD and yen strengthen | Long USD, long JPY |
The differences that matter:
- Crypto bears are deeper and faster. A stock bear of 20 to 30% is a bad year, while Bitcoin routinely gives back half or more, and altcoins drop harder still. More on that in the altcoin cycle guide.
- Gold is a safe haven, not a risk asset. In an equity bear, gold often climbs as money looks for shelter, so a falling stock market and a rising gold price fit together. If you trade the metal, the gold trading guide covers the setups.
- Forex has no all-time high to fall from. You read a Forex bear as risk-off flow, where the dollar and the Japanese yen strengthen because traders park in the safest currencies.
- Bonds and cash are positions. In a stock or crypto bear, being flat is not sitting on your hands, it is choosing the asset that is not falling.
What past bear markets looked like
Every bear market has its own trigger, but they rhyme. Naming them by what happened rather than by date makes the shared pattern clear.
| Bear market | What triggered it | How it felt |
|---|---|---|
| The dot-com bust | Tech bubble burst | Slow, grinding, years long |
| The financial crisis | Banking and credit collapse | Fast, deep, systemic fear |
| The covid crash | Global shutdown shock | Brutal drop, sharp recovery |
| The crypto winter | Leverage and blow-ups unwinding | Down 70%+, long and cold |
The lessons that repeat across all of them:
- The bottom is a process, not a day. Almost none of them ended on a single V-candle. Price ground sideways for a while before turning.
- The sharpest rallies came inside the bear. Bear market rallies of 20% or more are common and feel like the all-clear, then roll over. They trap more traders than the lows do.
- Fast crashes recover faster than slow grinds. A shock like the covid crash snapped back, while a slow structural bear like the dot-com bust dragged for years.
- Leverage decides the damage. The deepest unwinds, especially in crypto, were leverage coming undone. When borrowed money is forced to sell, it overshoots.
What actually works in a downtrend
You do not have to sit out a bear market, but you do have to trade it differently. The whole game shifts from buying dips to respecting a downtrend.
| Approach | How it works | Main risk |
|---|---|---|
| Short the rallies | Sell bounces that stall under resistance or 50 | Vicious bear-market rallies |
| Cash is a position | Step aside, protect capital | Missing the eventual bottom |
| Defensive rotation | Move to gold, USD, yen or cash | Whipsaw, late timing |
| Dollar-cost averaging | Long-term holders buy fixed amounts down | Needs patience, no leverage |
| Mean-reversion bounce | Fade deep oversold for a quick counter-move | Fighting the main trend |
How to run each one:
- Short the rallies, do not chase the lows. The cleanest bear trade is selling a bounce that rejects at the 50 line or a broken support, with a stop above the swing high. A trailing stop lets a winner ride as the trend continues.
- Treat cash as a real holding. Preserving capital in a downtrend is an active choice. The money you do not lose is the money that buys the base.
- Rotate to what holds up. Safe havens and cash are where value goes to hide. You are not calling the bottom, you are lowering your exposure to the thing that is falling.
- Average in only if you can hold. Dollar-cost averaging works for long-term investors with no leverage and a long horizon. It is not a trading strategy, and it fails anyone who needs the money soon.
- Fade oversold with tight risk. A deeply oversold mean-reversion bounce can pay, but you are trading against the trend, so keep the stop tight and the target modest.
Rule of thumb: in a bull you can be sloppy and the trend saves you. In a bear the trend punishes you, so tight risk and patience are the whole edge.
Common mistakes
- Catching the falling knife. Buying only because price looks cheap. Cheap in a bear market usually gets cheaper.
- Trusting the bounce. Treating a 20% bear-market rally, a classic dead cat bounce, as the recovery. Most of them fail right at the old support or the 50 line.
- Holding losers with no stop. Hoping a broken position comes back. In a downtrend, hope is not a plan and the drawdown compounds.
- Over-leveraging the short side. Even a correct short can get stopped out by a violent counter-rally. Leverage turns a right call into a wipeout.
- Calling the bottom on one green day. A single strong candle is not a base. Wait for higher lows and RSI reclaiming 50.
- Trading it like a bull. Buying breakouts and dips as if the regime never changed. Read the regime first, then choose the setup.
Trading a bear market without getting hurt
A downtrend is volatile in both directions, so discipline matters more here than anywhere.
- Size for the swings, not the conviction. Bear rallies can run 20% against a short in days. Risk a small, fixed slice of the account per trade so one snapback cannot hurt you.
- Plan the exit before the entry. Know your stop and target up front, and check the reward-to-risk ratio is worth it before you click.
- Respect the rally. Counter-trend bounces in a bear are sharp and fast. A stop that would be fine in calm conditions gets run, so give it room or trade smaller.
- Mind the psychology. Fear, revenge trading and calling every dip the bottom are what bear markets feed on. The trading psychology side is half the battle.
- Only risk what you can lose. No read is a guarantee, and the market can stay irrational longer than most accounts can stay solvent.
A bear market is not a disaster to survive, it is just a regime to trade on its own terms. The reads tell you which regime you are in, and the discipline keeps you in the game long enough for the next bull to arrive.
Glossary
- Bear market: a sustained downtrend, usually a fall of 20% or more from a recent high that holds.
- Bull market: the opposite, a lasting uptrend of higher highs and higher lows.
- Drawdown: how far price has fallen from its highest point, in percent.
- All-time high (ATH): the highest price an asset has ever reached.
- Correction: a smaller drop of 10 to 20% that often recovers.
- Death cross: when the 50-day moving average drops below the 200-day, a bearish trend signal.
- RSI: a momentum gauge from 0 to 100. Above 50 is bullish, below 50 is bearish, under 30 is oversold.
- Capitulation: the panic-selling stage where the crowd gives up all at once, often near the low.
- Bear market rally: a sharp bounce inside a downtrend that fails before making a new high.
- Safe haven: an asset like gold, the US dollar or the yen that money moves into when risk assets fall.
FAQ
What is a bear market, in plain terms?
It is a market in a lasting downtrend. The common line is a fall of 20% or more from a recent high that sticks rather than bouncing straight back. Prices make lower highs and lower lows, and rallies get sold instead of bought.
How much does a market have to fall to be a bear market?
The widely used threshold is 20% below the recent high. A drop of 10 to 20% is called a correction, which often recovers. Once the fall passes 20% and holds, it is treated as a bear market and a change of regime.
What is the difference between a bear market and a bull market?
Direction and control. A bull market makes higher highs with buyers in charge, so dips get bought. A bear market makes lower highs with sellers in charge, so rallies get sold. Price above a rising 200-day average is bull structure, below a falling one is bear structure.
How do you spot a bear market early?
Stack three reads. Watch the drawdown cross 20% below the high, the 50-day average drop below the 200-day (the death cross), and RSI keep stalling under the 50 midline. One alone can mislead, but when all three agree the downtrend is real.
How long does a bear market last?
There is no fixed length. Shock-driven crashes can bottom in weeks, while slow structural bears can grind for a year or more. The one habit that repeats is that the bottom is a sideways process, not a single sharp low.
How do you trade a bear market?
You flip from buying dips to selling strength. The main options are shorting rallies that stall under resistance or the 50 line, holding cash, rotating to safe havens like gold or the dollar, and for long-term holders, dollar-cost averaging without leverage. Keep risk small, because counter-trend bounces are sharp.
Are bear markets worse in crypto?
They are deeper and faster. A stock bear of 20 to 30% is a bad year, but Bitcoin routinely gives back half or more, and altcoins fall harder still. The 20% rule is a formality in crypto, where a real bear market, sometimes called a crypto winter, can run down 70% or more.
Can you make money in a bear market?
Yes, but differently. Traders short rallies, fade deeply oversold bounces, and rotate into assets that hold up like gold or the dollar. Long-term investors use the low prices to average in. The one thing that does not work is trading it like a bull market and buying every dip.
What is a bear market rally?
A sharp bounce inside a downtrend that feels like the recovery, then fails before making a new high. They often run 20% or more and stall right at broken support or the RSI 50 line. They trap more traders than the actual lows do, which is why rallies are treated as exits, not entries.
Does a death cross always mean a bear market?
No. The death cross is a lagging confirmation, not a prediction, and it can whipsaw in a sideways market. It is most trustworthy when it lines up with a drawdown already past 20% and RSI capped under 50. On its own it can fire late or give a false alarm in a choppy range.
Real-time trade setups with entry, stop loss and take profit. Daily market analysis. No subscription, no complicated theory.
🌍 Our recommended brokers


Reader Reviews
Be the first to review this — tell other traders what actually helped, or where it fell short.
Leave a Review

Forex Analyst & Senior Trader
Former FX desk trader with 8 years in institutional forex. Works in multi-timeframe analysis and order flow, turning desk experience into systematic, testable rules across forex and metals.
