
What market breadth actually measures
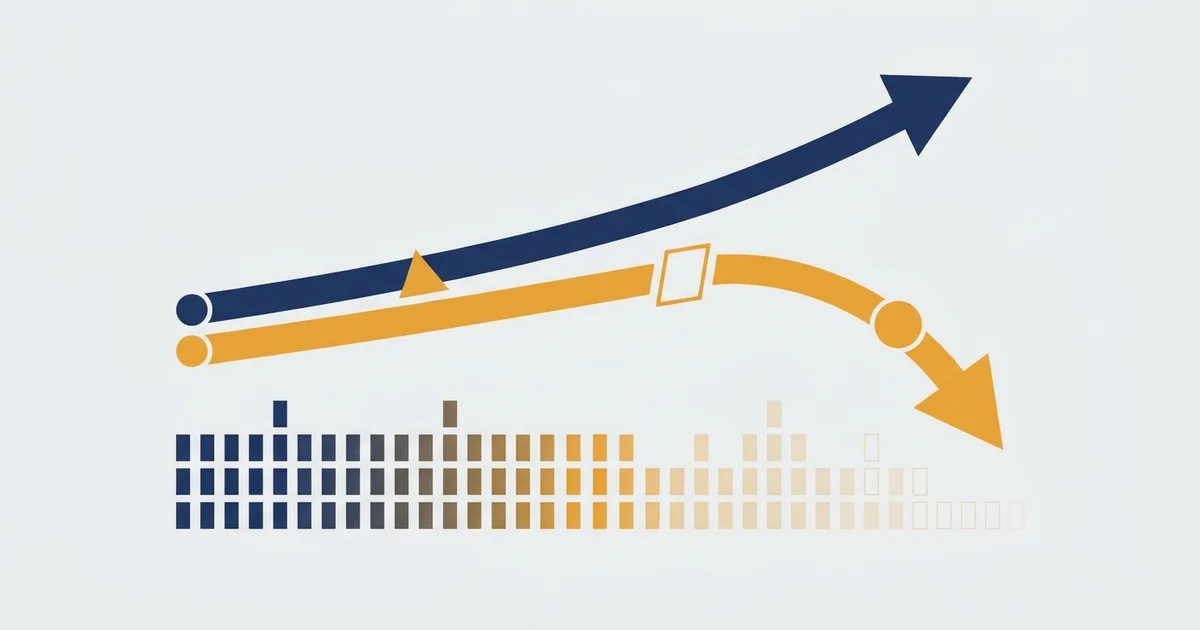
Price tells you where the index went. Market breadth tells you how many names carried it there.
The cleanest picture is the advance-decline line: a running total that rises when more assets go up than down, and falls when more go down than up.
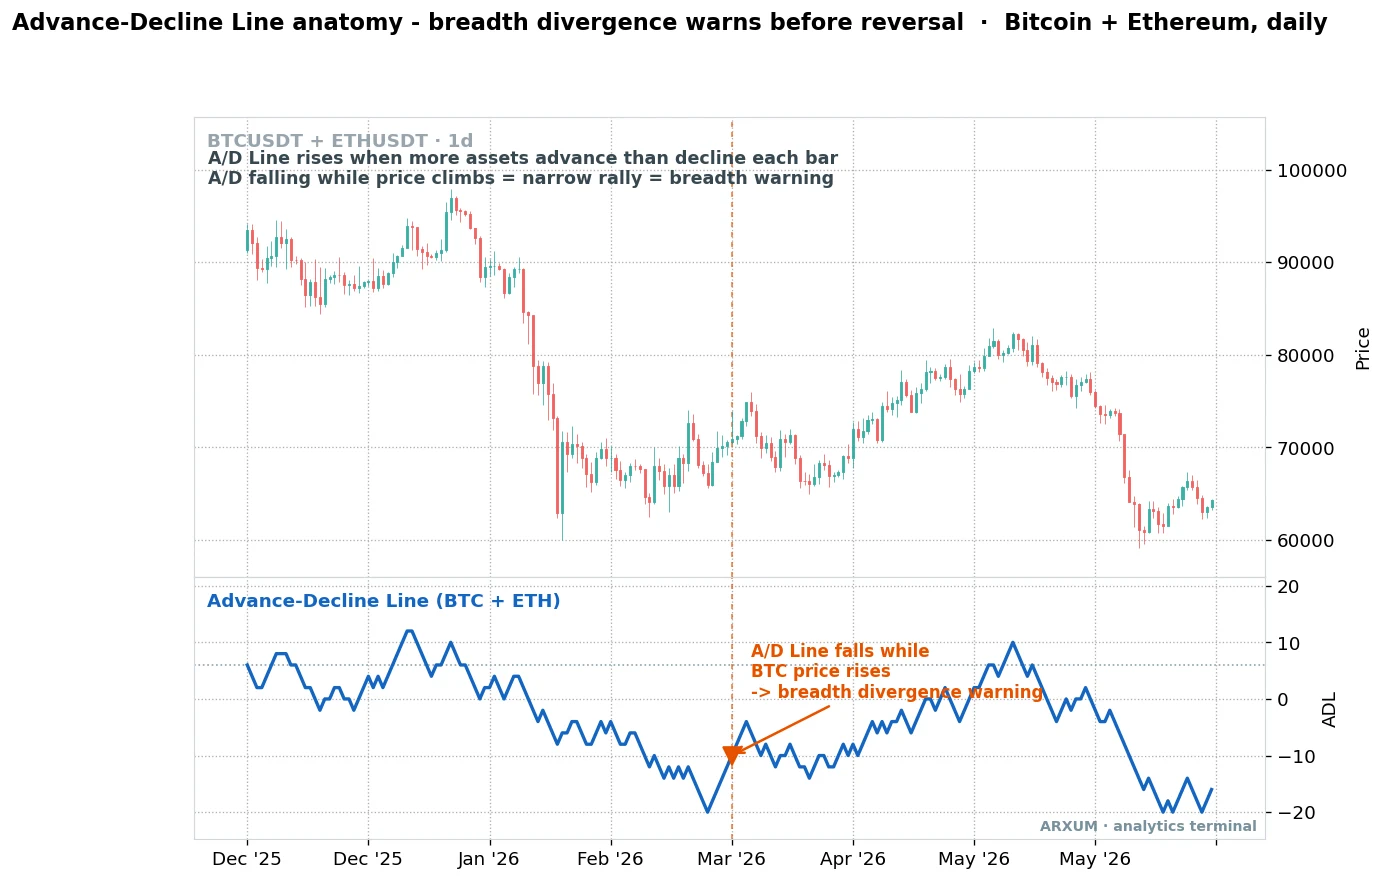
What the chart is showing:
- The top panel is price. The lower panel, the advance-decline line, adds up net advances each day, so it climbs when participation is broad and drops when it is thin.
- The dashed vertical line marks a spot where price is grinding higher while the advance-decline line rolls over. Fewer names are joining the move.
- The orange arrow flags that gap: price up, breadth down. That mismatch is a warning, not a sell button, but it says the rally is running on narrow shoulders.
- The read: a move backed by most of the market is durable. A move backed by a few names is living on borrowed time.
One honesty note up front. A real stock-index breadth reading counts hundreds of members.
The chart above runs the same math on a small crypto basket to show the shape clearly, so treat it as the anatomy lesson, not a full-market gauge.
The market breadth toolkit at a glance
Breadth is not one indicator, it is a family of market internals that all ask the same question a different way. Here is the whole set, plainly.
| Indicator | What it counts | Healthy-market signal |
|---|---|---|
| Advance-decline line | Running total of advancers minus decliners | Rising with price |
| Advance-decline ratio | Advancers divided by decliners each day | Above 1 |
| New highs vs new lows | Members at 52-week highs vs lows | Highs outnumber lows |
| McClellan Oscillator | Momentum of net advances | Above zero |
| Arms Index (TRIN) | Breadth weighted by volume | Below 1 |
| Breadth thrust | How fast breadth swings weak to strong | A rare, sharp surge |
| Percent above 200-day MA | Share of members above their long trend | Above 50% |
They split into three jobs:
- Direction gauges (advance-decline line, advance-decline ratio) tell you whether participation is broadening or thinning right now.
- Momentum gauges (McClellan Oscillator, breadth thrust) tell you how fast breadth is turning, which leads price at inflection points.
- Health gauges (new highs vs lows, percent above the 200-day line, TRIN) tell you the underlying condition of the whole list, not just today’s tape.
You do not need all seven. Two or three that disagree with price are enough to make you cautious.
Breadth also feeds broader sentiment tools: it is one of the components inside the fear and greed index.
The advance-decline line, the one to learn first
The advance-decline line is the backbone of breadth, and the one worth mastering before the rest. It is simple: each day, take the number of assets that rose minus the number that fell, and keep a running total.
Because it is cumulative, its slope matters more than its level. A rising line means broad buying, a falling line means broad selling, whatever the index is doing.
Where it earns its keep is divergence. When it splits from price, believe the line.
| Role | How you use it | Best read |
|---|---|---|
| Trend confirm | Line rising with price = the move is broad and real | Daily, whole market |
| Early warning | Price new high, line lower high = narrow rally | Daily / weekly |
| Bottom tell | Price new low, line higher low = selling drying up | Daily, at extremes |
| Regime filter | Only trust index breakouts when the line breaks out too | Daily, as a filter |
| Second gauge | Pair a diverging line with new highs vs lows to confirm | Daily, market internals |
Two things beginners miss:
- Read the slope, not the number. The absolute value of a cumulative line is meaningless. All that matters is whether it is heading up or down and whether it agrees with price.
- Divergence is a warning, not a trigger. A narrow rally can grind higher for weeks. The line tells you the odds have shifted, so tighten stops and stop chasing, it does not tell you to short on the spot.
The McClellan Oscillator, breadth with a stopwatch
The advance-decline line shows the trend of participation. The McClellan Oscillator shows its momentum, which is what turns first at a top or bottom.
It is the difference between a fast and a slow average of net advances, specifically a 19-day and a 39-day EMA. An EMA is just a moving average that weights recent days more heavily.
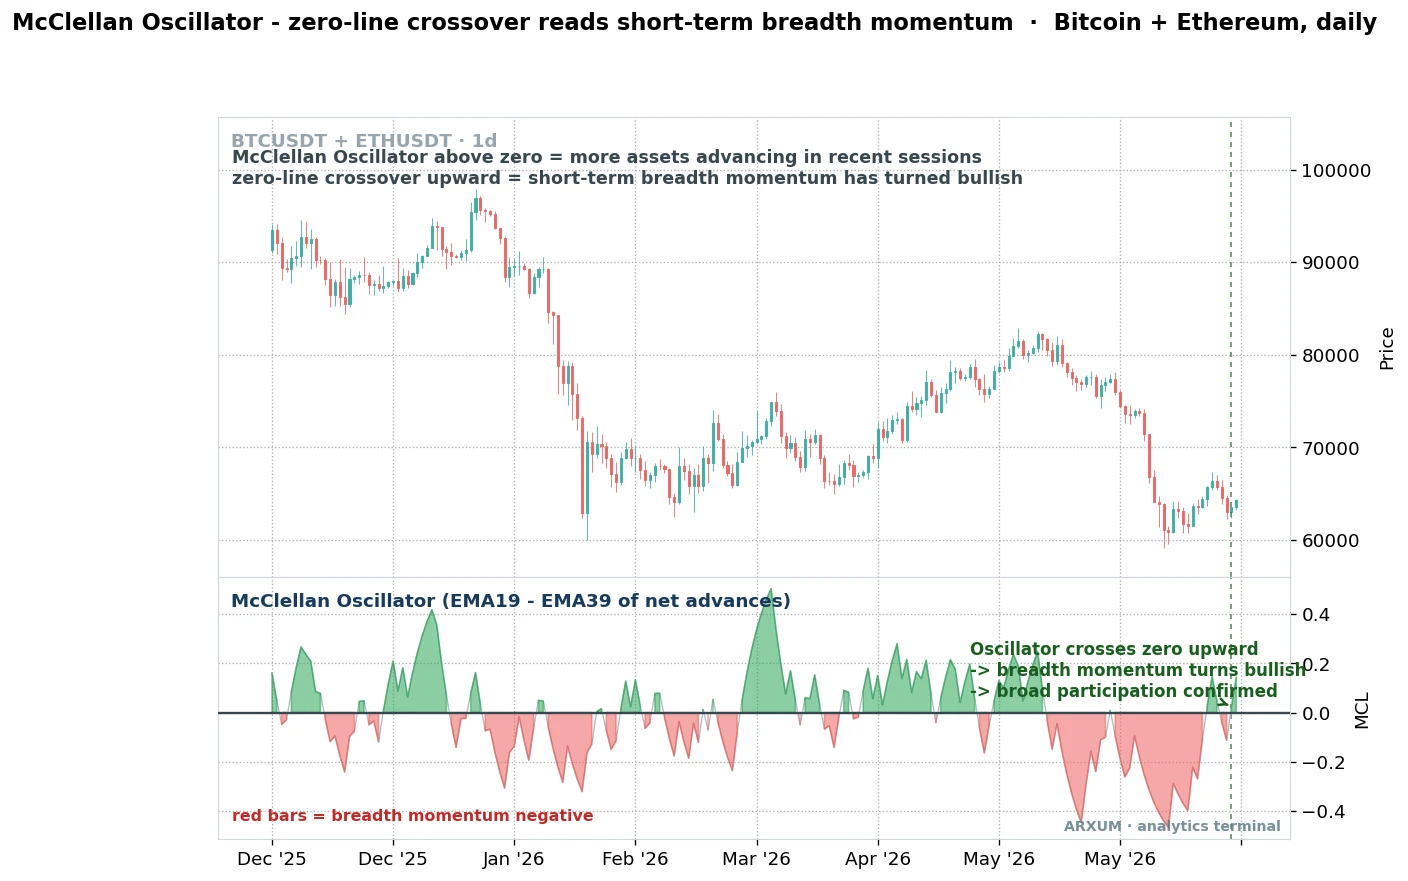
What the labels mean:
- The lower panel is the oscillator itself, the gap between a 19-day and a 39-day EMA of net advances. It swings above and below a zero line.
- Green bars above zero mean more assets have been advancing lately, so breadth momentum is positive. Red bars below zero mean the opposite.
- The zero-line crossover is the signal traders watch. Crossing up from red to green says short-term participation has flipped bullish, crossing down says it is fading.
- The read: the oscillator turns before the trend does. A cross up while price is still soft often front-runs a broad rally, and a cross down during a rally warns momentum under the surface is draining.
| Role | How you use it | Best read |
|---|---|---|
| Momentum flip | Zero-line cross up = breadth momentum turning bullish | Daily, whole market |
| Warning | Zero-line cross down during a rally = participation fading | Daily, whole market |
| Extremes | Deeply negative then curling up = washed-out, snap-back odds rise | Daily, at capitulation |
| Second gauge | Confirm an advance-decline line divergence with a matching cross | Daily, market internals |
| Overheat cue | Stretched far above zero = breadth stretched, chase less | Daily, late in a run |
Rule of thumb: the advance-decline line is your compass, the McClellan is your stopwatch. Use the line for direction and the oscillator for timing.
Reading breadth in crypto
Crypto has no exchange-wide advance-decline feed the way stock indexes do, so you read breadth through native gauges instead. They answer the same question: is the whole market moving, or just Bitcoin?
The most useful single read is the ETH/BTC ratio, Ethereum priced in Bitcoin. When it rises, capital is spreading past Bitcoin into the rest of the market.
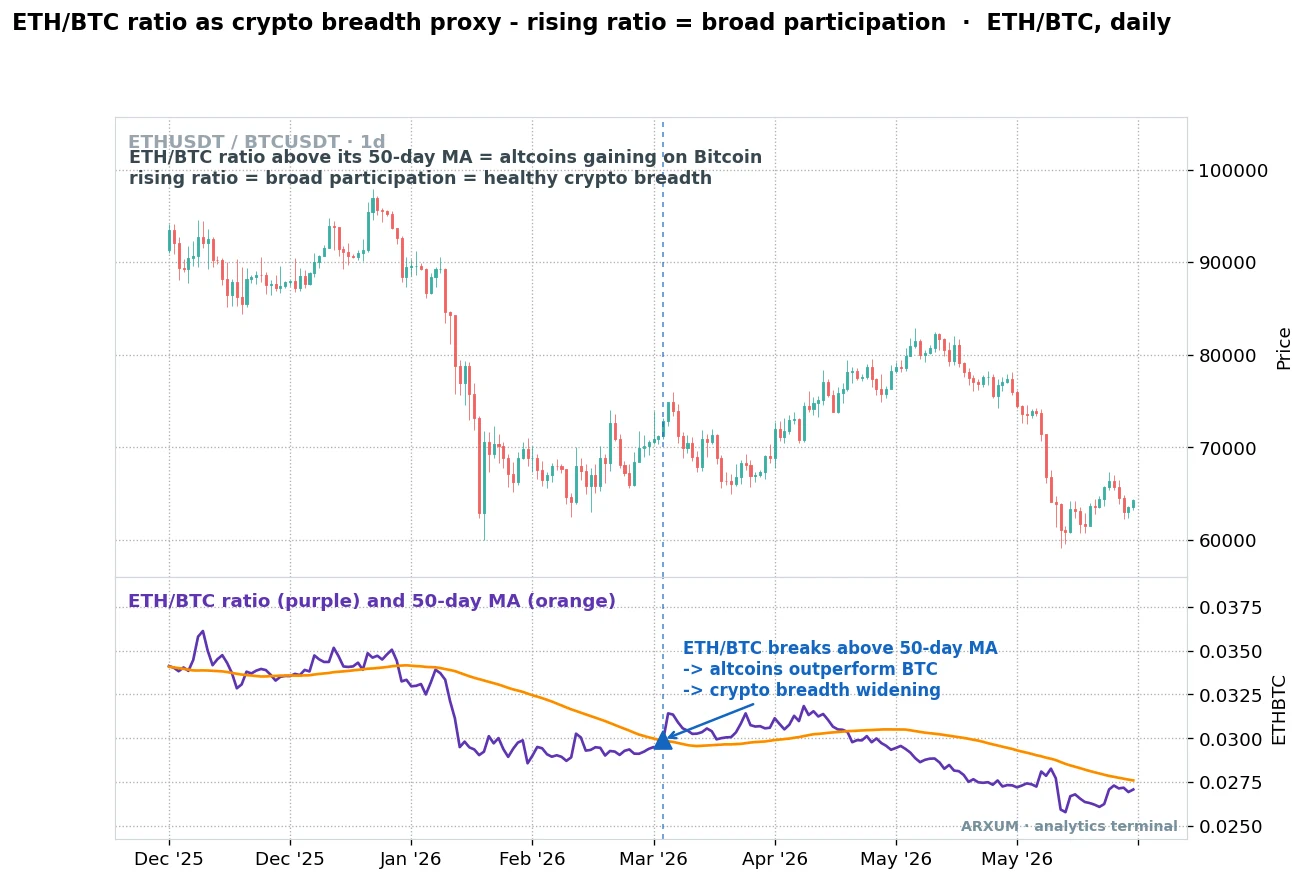
What the labels mean:
- The lower panel is the ETH/BTC ratio in purple with its 50-day moving average in orange. The moving average is just the average ratio over the last 50 days, a slow reference line.
- When the purple line sits above the orange line, Ethereum and by extension the broader alt market are gaining on Bitcoin. That is participation widening.
- The blue arrow marks the ratio breaking up through its 50-day average, the moment the handoff from Bitcoin to the rest of the market usually begins.
- The read: a crypto rally led only by Bitcoin is narrow. Once ETH/BTC turns up and money spreads down the size ladder, breadth is genuinely broad, which is what a healthy altcoin season looks like.
The crypto-native breadth panel:
| Gauge | Broadening signal | What it tells you |
|---|---|---|
| ETH/BTC ratio | Rising above its 50-day MA | Large-cap alts leading, breadth widening |
| Bitcoin dominance (BTC.D) | Falling | Money leaving Bitcoin for the rest |
| TOTAL2 market cap | Rising while Bitcoin is flat | Alt capital expanding, not just rotating |
| Percent of top coins above 200-day MA | Above 50% | Most of the market in real uptrends |
| Altcoin season index | Climbing past 75 | Most top coins beating Bitcoin |
How to weigh them:
- Start with ETH/BTC and dominance together. A rising ratio and a falling dominance reading are the same broadening from two angles. When they agree, the move is broad.
- Use TOTAL2 to separate rotation from expansion. If alt market cap is climbing while Bitcoin is flat, fresh money is arriving, not just shuffling out of Bitcoin.
- Treat the percent-above-200-day read as the health check. It is the crypto cousin of the stock-market breadth-health gauge, and it cuts through short-term noise.
Which breadth read to use when
The gauges are not rivals, they stack. Pick by the question you are actually asking.
| Question | Gauge to use | Broad answer looks like |
|---|---|---|
| Is this rally broad or narrow? | Advance-decline line | Line rising with price |
| Is breadth momentum turning? | McClellan Oscillator | Zero-line cross |
| Is the whole list healthy? | New highs vs lows, percent above 200-day MA | Highs lead, over half above trend |
| Is a top near? | Breadth divergence at a price high | Price new high, breadth lower high |
| Is crypto broadening? | ETH/BTC, dominance, TOTAL2 | Ratio up, dominance down, TOTAL2 up |
The one habit that ties it together: never read breadth in isolation from price. Breadth is a filter on the price move, it is the second opinion that tells you whether to trust what the chart is doing.
Reading breadth across timeframes
Breadth is mostly a slow read. It defines the backdrop you trade inside, and it gets noisier the faster you look.
| Timeframe | What breadth tells you | Best use |
|---|---|---|
| Weekly | The structural health of the whole market | Decide the regime, risk-on or risk-off |
| Daily | Whether the current move is broad or narrow | Confirm or fade the trend, spot divergence |
| 4-hour and below | Mostly noise, the count swings hard | Rarely useful, do not force it |
- Set the regime on the weekly. New highs versus lows and the percent-above-200-day read are weekly calls. They change slowly and they matter most.
- Work the daily for signals. The advance-decline line divergence and the McClellan cross are daily reads. This is where breadth earns a trade.
- Skip the fast charts. Breadth is a participation count, and on a 15-minute view that count is mostly random. Do not build entries on it.
Pull the gauges up yourself
You can chart all of these for free. The exact names matter, since most tools carry look-alike variants.
- For the advance-decline line and internals: on TradingView, add the Advance/Decline Line indicator, and for US market internals load the symbols ADD (net advances) and pull up new highs / new lows counts. Add the McClellan Oscillator indicator for the momentum read.
- For crypto breadth: chart ETHBTC directly and drop a Moving Average Simple, length 50, on it to reproduce the ratio chart above. Use CRYPTOCAP:BTC.D for Bitcoin dominance and CRYPTOCAP:TOTAL2 for alt market cap. No indicator needed, the tickers do the work.
- On MT4 or MT5: market-internals feeds are limited, so breadth is a TradingView job. What ports over is the moving average, under Insert -> Indicators -> Trend -> Moving Average, length 50, for the ETH/BTC ratio read.
Rule of thumb: match the settings exactly. A default McClellan length or the wrong moving-average window draws a different line and gives you a different call.
What actually works
The short version you can carry:
- 1. Trust breadth over price at extremes. When price makes a new high but the advance-decline line does not, the rally is narrow. Stop chasing and protect gains.
- 2. Use the line for direction, the McClellan for timing. The cumulative line says whether participation is broad, the oscillator says when momentum flips. Read them together.
- 3. In crypto, watch ETH/BTC and dominance. A rising ratio and falling dominance mean money is spreading past Bitcoin, which is breadth widening.
- 4. Confirm, do not stack noise. Two gauges that agree beat five that half-agree. Direction plus health is plenty.
- 5. Keep it slow. Breadth is a weekly and daily read. On fast charts the count is just noise.
Common mistakes
- Reading breadth without price. Breadth is a second opinion, not a standalone system. It confirms or questions the price move, it does not replace it.
- Trading divergence as a trigger. A narrow rally can run for weeks. Divergence shifts the odds, it does not mark the exact top, so it manages risk, it does not time entries alone.
- Chasing the absolute number. A cumulative line has no meaningful level, only a slope. Watching for a magic value wastes the tool.
- Forcing breadth onto the 15-minute. The count whips around on fast charts. Set the regime slow and let breadth stay slow.
- Ignoring volume. Two rising assets on thin volume are weaker than one on heavy volume. That is why the volume-weighted TRIN exists as a cross-check.
- Treating the crypto proxy as a full breadth feed. ETH/BTC is a strong shortcut, but it is two assets standing in for the market. Back it with dominance and TOTAL2.
Using breadth without getting hurt
Breadth improves your odds, it does not remove the risk. It is a context tool, so it belongs upstream of your entries, not in place of a plan.
- Let breadth size your conviction, not your stop. A broad backdrop lets you trade the trend with confidence, a narrow one says trade smaller and quicker. Your stop still comes from the price chart.
- Plan the exit before the entry. Know your stop and target up front. The reward-to-risk ratio should justify the trade before you click, whatever breadth says.
- A divergence is a caution, not a promise. Narrow rallies can stretch on. Use the warning to tighten risk, not to fight the tape with a fresh short.
- Only commit money you can afford to lose. No internal gauge is a guarantee. Treat every read as odds in your favour, not a certainty.
Breadth is one of the few tools that shows you the market under the surface. It works best as the backdrop check that keeps you from trusting a move the rest of the market is quietly abandoning.
Glossary
- Market breadth: a measure of how many individual assets are participating in a market move, not just the index.
- Advance-decline line: a running total of advancers minus decliners. Rising means broad buying, falling means broad selling.
- Advance-decline ratio: advancers divided by decliners on the day. Above 1 means more rose than fell.
- New highs vs new lows: the count of members at 52-week highs against those at 52-week lows.
- McClellan Oscillator: the difference between a 19-day and a 39-day EMA of net advances, a breadth momentum gauge.
- TRIN (Arms Index): breadth weighted by volume. Below 1 means the volume is in the rising assets.
- Breadth thrust: a rare, fast swing from weak breadth to strong, historically a powerful bull signal.
- Bitcoin dominance (BTC.D): Bitcoin’s share of the total crypto market cap. Falling dominance means money is spreading into the rest.
- ETH/BTC ratio: Ethereum priced in Bitcoin. Rising means the broader market is gaining on Bitcoin.
- TOTAL2: the total crypto market cap excluding Bitcoin. Rising means alt capital is expanding.
FAQ
What is market breadth, in plain terms?
It is a count of how many assets are joining a market move. If most names are rising together, breadth is broad and the move is healthy. If only a few big names are pulling the index while the rest lag, breadth is narrow and the move is fragile.
How do you use the advance-decline line?
Watch its slope against price. When the line rises with price, the trend is broad and trustworthy. When price makes a new high but the line makes a lower high, the rally is narrow, which is an early warning to tighten risk rather than chase.
What is a good market breadth indicator to start with?
The advance-decline line. It is simple, it captures the core idea of participation, and its divergences from price are among the most reliable warnings in market internals. Add the McClellan Oscillator once you want a momentum read on top of it.
What does the McClellan Oscillator measure?
Short-term breadth momentum. It takes the difference between a 19-day and a 39-day average of net advances, so it swings above and below zero. Above zero means more assets have been advancing lately, and a zero-line crossover flags a shift in participation before price fully turns.
What do new highs versus new lows tell you?
They read the health of the whole list. When far more members are hitting 52-week highs than lows, the market is broadly strong. When new lows start to outnumber new highs even as the index holds up, the foundation is weakening under the surface.
How do you measure breadth in crypto?
With native gauges instead of an exchange advance-decline feed. The ETH/BTC ratio, Bitcoin dominance and TOTAL2 market cap together show whether money is spreading past Bitcoin into the rest of the market. A rising ratio, falling dominance and expanding TOTAL2 all mean crypto breadth is widening.
Does market breadth predict tops and bottoms?
It warns, it does not time. A breadth divergence at a price high says the move is narrow and the odds of a turn are rising, but a narrow rally can run for weeks. Use it to manage risk, not to pick the exact top or bottom on its own.
Which timeframe is best for reading breadth?
Weekly for the regime and daily for signals. Breadth is a slow participation count, so it is most reliable on higher timeframes. On the 4-hour and below the count whips around and gives false reads, so it is best left alone there.
Is market breadth the same as volume?
No, but they are related. Volume measures how much is trading, breadth measures how many names are moving in the same direction. The Arms Index (TRIN) blends the two, weighting breadth by volume, which is why it is a useful cross-check on a plain advance-decline read.
Can I trade off market breadth alone?
No. Breadth is a context tool that confirms or questions a price move, not a standalone entry system. Use it to decide how much to trust a trend and how large to size, then take the actual entry and stop from the price chart itself.
🌍 Our recommended brokers


Reader Reviews
Be the first to review this — tell other traders what actually helped, or where it fell short.
Leave a Review

Forex Analyst & Senior Trader
Former FX desk trader with 8 years in institutional forex. Works in multi-timeframe analysis and order flow, turning desk experience into systematic, testable rules across forex and metals.