
What the Fear and Greed Index actually is
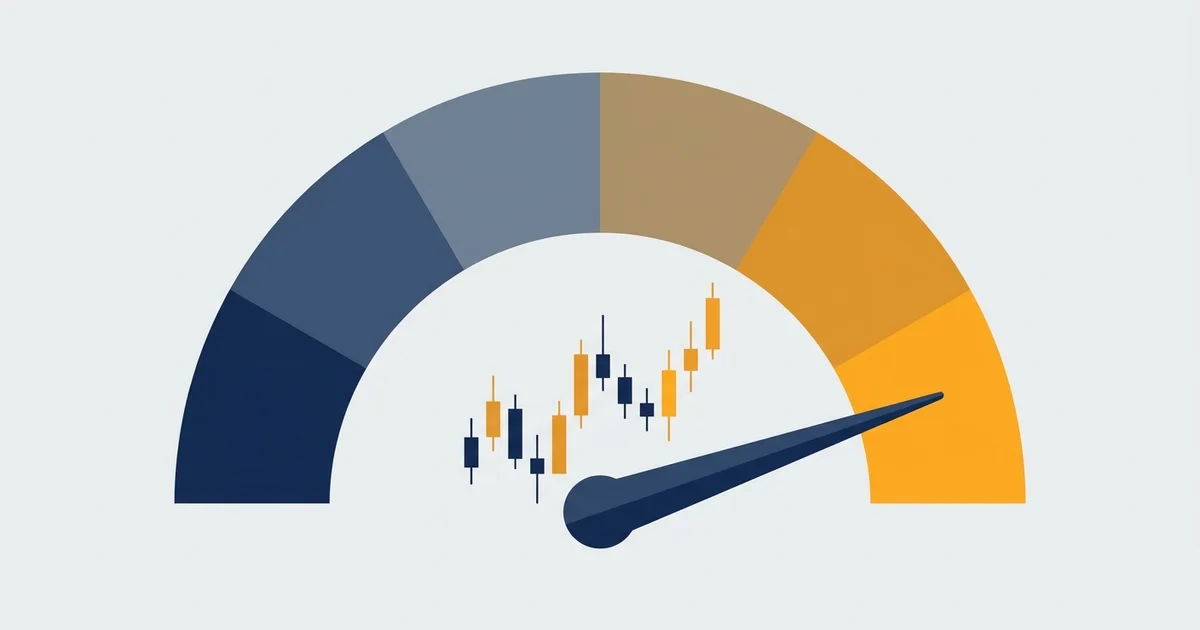
The Fear and Greed Index takes the mood of a market and turns it into one number. Read it left to right and it runs from extreme fear at the floor to extreme greed at the ceiling.
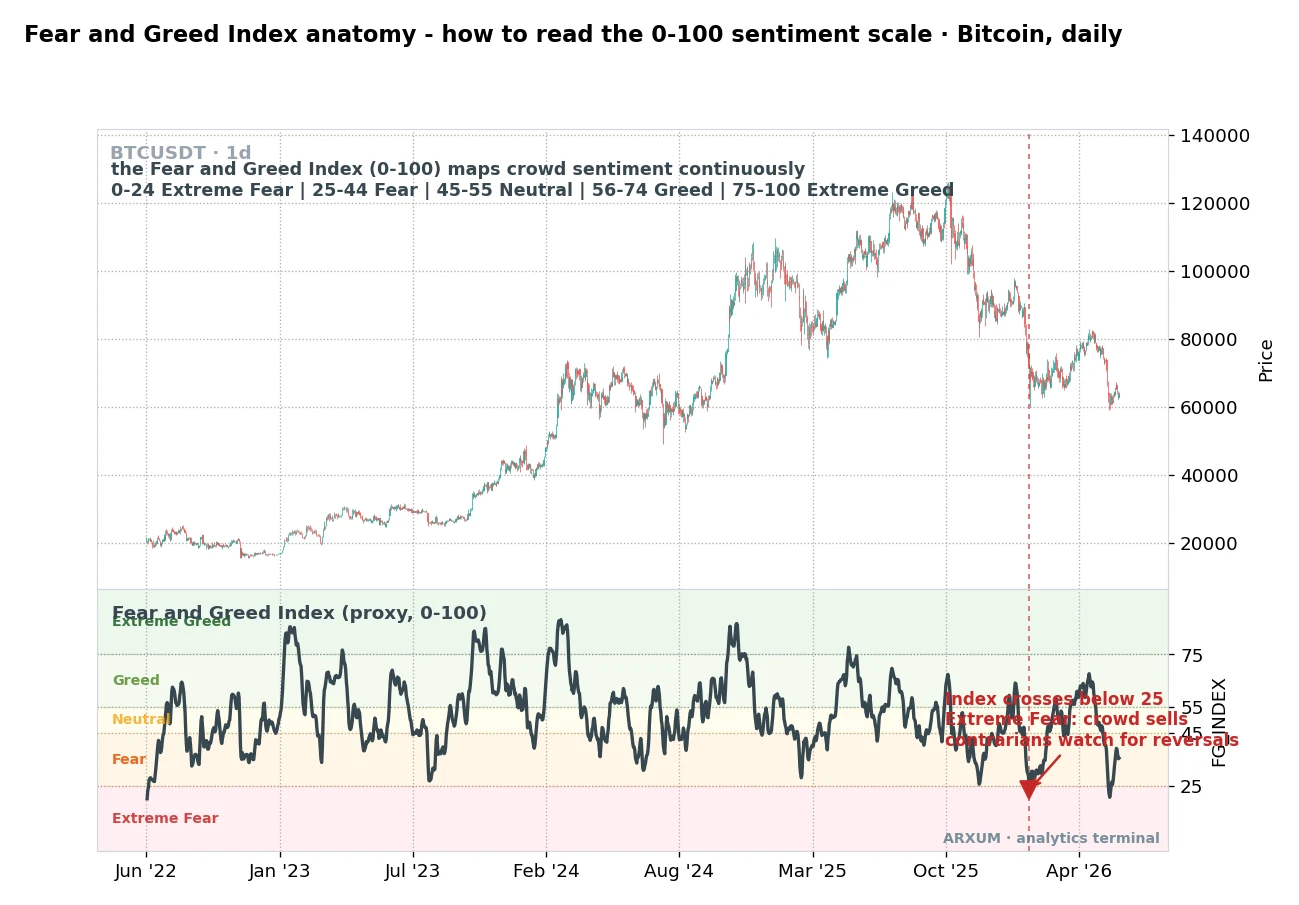
What that chart is showing:
- The top panel is Bitcoin’s price. The lower panel, FG_INDEX, is the sentiment score plotted over time, from 0 at the floor to 100 at the top.
- The coloured bands are the five moods. Red at the bottom is Extreme Fear, then Fear, a thin Neutral strip in the middle, Greed above it, and green Extreme Greed at the top.
- The dashed vertical line is a signal moment. Here it marks the index dropping under 25, the line into Extreme Fear.
- The number does not predict, it describes. It tells you which mood is priced in right now, so you can ask whether that mood has gone too far.
The scale splits into five plain zones. These are the exact bands the chart above uses.
| Reading | Zone | What the crowd is doing |
|---|---|---|
| 0 to 24 | Extreme Fear | Panic selling, capitulation |
| 25 to 44 | Fear | Nervous, selling into weakness |
| 45 to 55 | Neutral | No strong lean either way |
| 56 to 74 | Greed | Buying, chasing strength |
| 75 to 100 | Extreme Greed | Euphoria, FOMO, leverage stacking up |
The core idea is simple. Price tells you what a market is doing, and the index tells you how the crowd feels about it.
When those two disagree, you get the best reads.
The two versions: crypto vs stock market
There is not one Fear and Greed Index, there are two that traders quote, and they cover different markets. Knowing which one someone means saves a lot of confusion.
The original is CNN’s stock-market gauge. It blends seven equally weighted inputs into one daily score.
| Component | What it measures |
|---|---|
| Market momentum | The S&P 500 versus its 125-day average |
| Stock price strength | 52-week highs versus 52-week lows |
| Stock price breadth | Volume in rising versus falling shares |
| Put/call ratio | Options bets on down versus up |
| Market volatility | The VIX, Wall Street's fear gauge |
| Safe haven demand | Stock returns versus bond returns |
| Junk bond demand | Appetite for risky corporate debt |
The crypto Fear and Greed Index, run by alternative.me, is the one most traders mean online. It weights its inputs and updates through the day rather than once at the close.
| Input | Weight | What it measures |
|---|---|---|
| Volatility | 25% | Current swings versus the recent norm |
| Momentum and volume | 25% | Buying pressure versus the average |
| Social media | 15% | Chatter and engagement pace |
| Bitcoin dominance | 10% | Money hiding in Bitcoin versus altcoins |
| Search trends | 10% | Google interest in crypto terms |
| Surveys | paused | Direct polls of trader sentiment |
The differences that actually matter to a trader:
- The stock version prints once a day. The crypto version moves continuously, so it reads faster.
- Crypto hits the extremes far more often, because the asset class swings harder than equities.
- Bitcoin dominance is a crypto-only input. Money crowding into Bitcoin instead of alts registers as fear in the smaller coins.
- Both share the same 0 to 100 frame, so once you can read one, you can read the other. Volatility and momentum sit in both, just measured on different markets.
One habit to keep straight: the CNN gauge and the crypto gauge can disagree on the same day, because stocks and crypto are not always afraid of the same thing. Read the one that matches the market you trade.
How traders actually use it
The index earns its keep as a lens on the crowd, not a signal on its own. It has more jobs than most people give it, and entries are only the first one.
| Role | How you use it | Best read |
|---|---|---|
| Contrarian entry | Look to buy when Extreme Fear is deep and stops falling | Daily, after a flush |
| Trend / regime read | Sustained Greed is risk-on, sustained Fear is risk-off | Daily / weekly |
| Confirming gauge | Line it up with price and RSI before you act | Any timeframe |
| Filter | Skip fresh longs in Extreme Greed, fresh shorts in Extreme Fear | Daily |
| Exit cue | Take profit into Extreme Greed euphoria | Daily / 4-hour |
The headline use is contrarian, and it rests on one plain truth about crowds.
- When almost everyone has already sold, there is little selling left to do. That is why deep fear so often sits near a low.
- When almost everyone has already bought, there is little buying fuel left. That is why extreme greed so often sits near a top.
- This is the same logic behind mean reversion: a stretched market tends to snap back toward the middle. The index just measures the stretch in sentiment instead of in price.
The crowd’s mood swings are the raw material here, and there is a whole psychology of fear and greed behind why the same mistakes repeat every cycle. The index is a way to see that psychology as a number.
Reading it on a fast chart
Drop to a 4-hour chart and the same index whips back and forth much faster. The extremes come and go within days instead of months, which suits short-term traders.
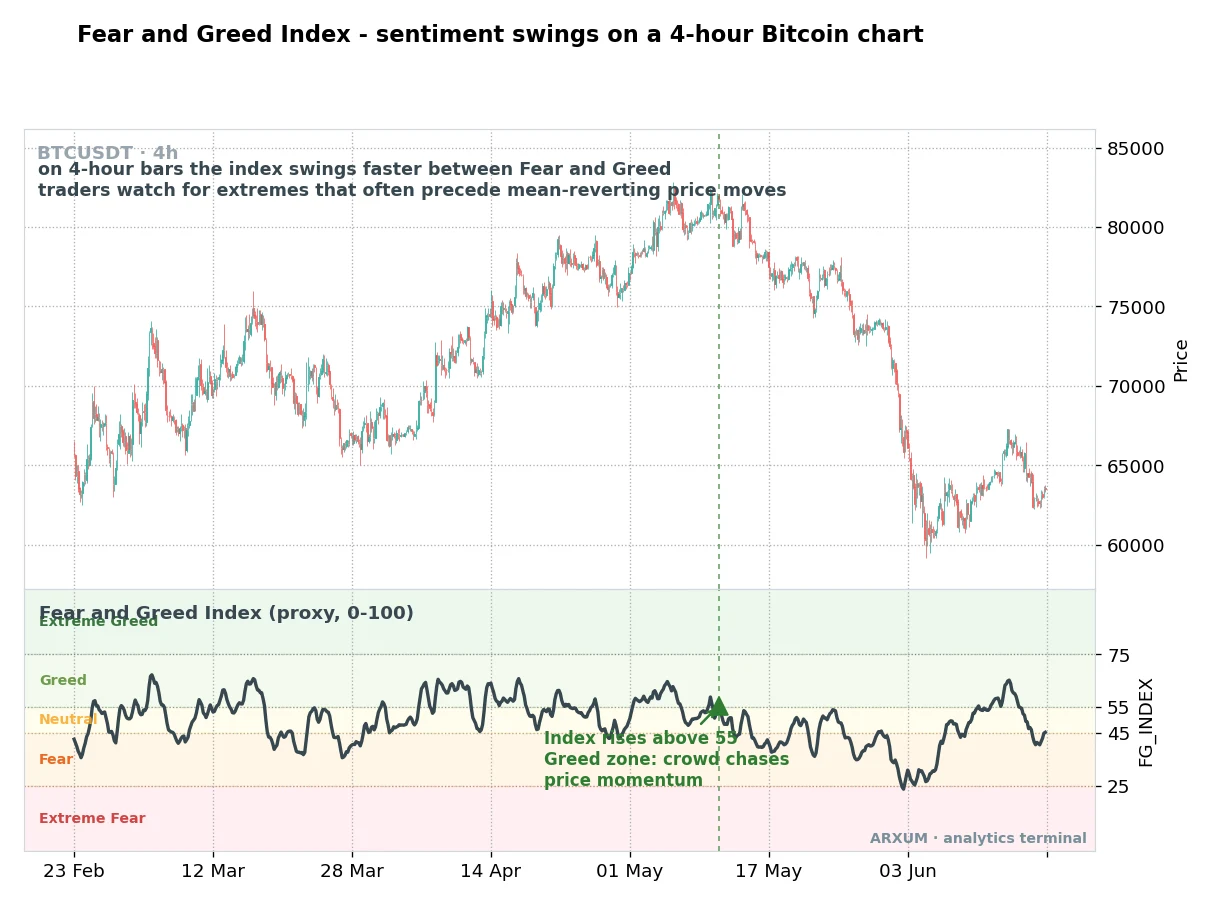
How to read that fast-timeframe picture:
- The green dashed vertical line is the moment the index pushes above 55, out of Neutral and into Greed.
- The green arrow points at that crossing. Green is used here because greed rising is the crowd turning risk-on, not a warning.
- On 4-hour bars a jump into Greed usually means traders are already chasing the momentum. Late in a move, that is exactly where short-term reversals hide.
- The faster the timeframe, the more noise. Treat a 4-hour Greed print as a heads-up to tighten stops, not a standalone signal.
| Reading on 4h | What it usually means | Short-term play |
|---|---|---|
| Above 55, Greed | Crowd chasing a move | Trail stops, watch for a fade |
| Below 25, Extreme Fear | Flush or shakeout | Watch for a mean-reverting bounce |
| 45 to 55, Neutral | No crowd edge | Trade the chart, ignore the mood |
Reading it across instruments
The gauge does not read the same on every coin. Altcoins are more volatile than Bitcoin, so they push further into the extremes under the same market stress.
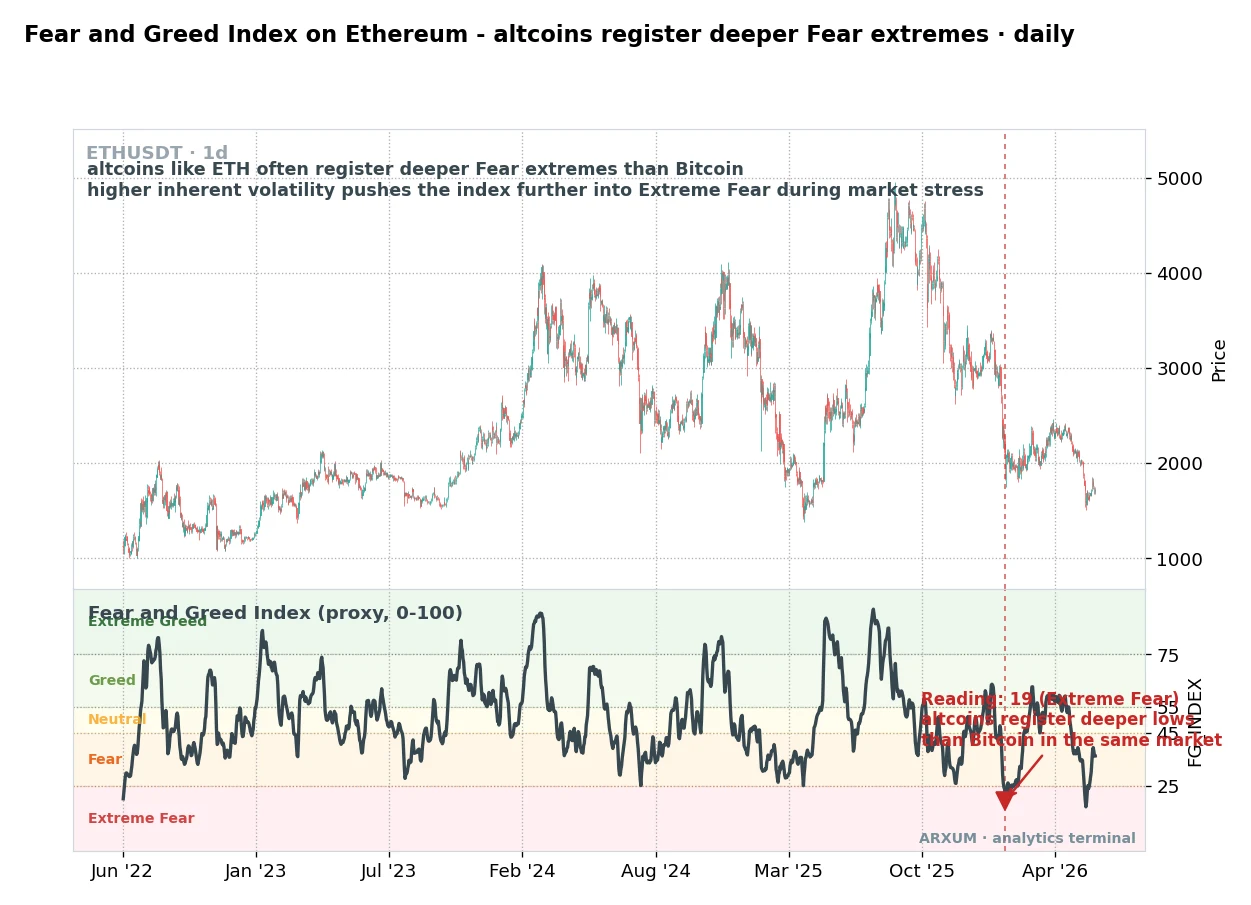
What the Ethereum read tells you:
- The red dashed vertical line marks a print of 19, well inside the Extreme Fear band. The red arrow points down at the low.
- Under the same market stress, alts like ETH tend to read more fearful than Bitcoin. Their bigger swings drag the index lower.
- That deeper fear can be an opportunity or a trap. In a healthy market it flags an oversold alt, and in a real bear market it just confirms the bleed.
- Read the alt’s own chart alongside the index. Deep fear plus a base building is different from deep fear plus lower lows.
| Instrument | Extreme habit | How to weigh it |
|---|---|---|
| Bitcoin | Reaches extremes less often | A Bitcoin extreme carries more weight |
| Ethereum and large alts | Deeper, more frequent Fear | Confirm with price before acting |
| Small alts | Most violent swings | Sentiment alone is unreliable, use the chart |
Sentiment also links to the wider rotation. When Bitcoin is greedy and calm while alts sit in fear, capital often has not spread out yet, which is the sort of setup altcoin season is built on.
Reading the extremes in practice
The index does its best work at the far ends of the scale. The middle is mostly noise, but the edges have a pattern worth knowing.
Extreme Fear has clustered at the crowd’s worst moments:
- Broad market crashes, when forced selling and margin calls feed on each other.
- The capitulation after a large exchange or lender blows up and drags confidence down with it.
- Leverage flush-outs, where over-borrowed longs get wiped and the index caves to single digits.
Buyers who stepped in near those readings, slowly and with a plan, tended to catch the turn. This is the same reason patient investors use dollar-cost averaging into deep fear rather than trying to nail the exact bottom.
Extreme Greed has clustered at the euphoric tops:
- Parabolic runs to fresh all-time highs, when price goes vertical.
- The peak of a mania, when people who never trade suddenly want in.
- Heavy leverage and giddy headlines, the classic late-cycle mix.
Sellers who trimmed into that greed, instead of waiting for the label to change, kept more of their gains.
The honest caveat: the index is not a timer. Fear can stay extreme for weeks in a genuine downtrend, and greed can run hot through a strong bull.
The tool tells you the odds are shifting, never the exact bar to click.
Which reading to trust, and what to do
Put it together and the index gives a different instruction depending on how you trade. A contrarian and a trend follower read the same number in opposite ways, and both can be right.
| Reading | If you fade the crowd | If you follow the trend |
|---|---|---|
| Extreme Fear | Hunt for a bottom, scale in slowly | Stay defensive, wait for the turn |
| Fear | Watch, no rush | Reduce risk |
| Neutral | No edge, sit out | Trade the chart, not the mood |
| Greed | Ride it but tighten stops | Trend is your friend |
| Extreme Greed | Take profit, fade strength | Trail stops, protect gains |
The single best practice is to never trade the index alone. Use it as one vote among several.
- Pair it with price structure. Extreme Fear plus a base forming is a real setup. Extreme Fear plus fresh lower lows is not.
- Pair it with a momentum gauge like RSI. Sentiment says the crowd is stretched, RSI says price is stretched, and agreement between them is stronger than either on its own.
- Cross-check with a positioning report. The commitment of traders data shows what large players are actually doing, which is a heavier tell than a mood score.
Where the index falls short
No sentiment gauge is a crystal ball, and this one has clear limits. Knowing them keeps you from over-trusting a single number.
- It can stay extreme. Deep fear in a bear market can hold for a long time. An early contrarian who ignores the trend gets run over.
- It lags the fastest moves. By the time the crowd is officially terrified, a chunk of the drop has already happened.
- It is a mood, not a mechanism. The index tells you how people feel, not why, and not what happens next.
- The crypto and stock versions can clash. They measure different markets, so a fearful stock reading tells you little about a greedy crypto tape.
- One gauge is never enough. On its own it will fool you at least as often as it helps. Its value is in agreement with price and momentum.
Managing the risk on a contrarian read
Buying into fear feels wrong by design, which is exactly why it needs tight discipline. A few plain rules keep a contrarian entry from turning into a falling-knife trade.
- Wait for fear to stop deepening. A deep reading that has flattened out is safer than one still dropping. Let the panic exhaust itself first.
- Scale in, do not all-in. Add in pieces as the read holds, so a further drop is a chance to average, not a disaster.
- Set the stop before you enter. Decide where the idea is wrong up front. The reward-to-risk ratio should be worth the trade before you click.
- Only commit money you can afford to lose. Extreme readings appear in the most violent markets, and those markets do not care about your average price.
The index shifts the odds in your favour when it lines up with the chart. It does not remove the risk, and the extremes are extreme for a reason.
What works, in three lines
- Read the extremes, ignore the middle. Deep fear and high greed carry information. Neutral does not.
- Use it as a lens, not a trigger. Confirm with price and momentum before acting on any reading.
- Match the version to your market. The crypto index for crypto, the CNN index for stocks, and never assume they agree.
Glossary
- Fear and Greed Index: a 0 to 100 score that turns market sentiment into a single number, from extreme fear to extreme greed.
- Extreme Fear: a reading of 24 or below, usually panic selling near a low.
- Extreme Greed: a reading of 75 or above, usually euphoria near a top.
- Contrarian: a trader who bets against the crowd’s mood, buying fear and selling greed.
- VIX: the stock market’s volatility index, a core input to the CNN gauge, often called Wall Street’s fear gauge.
- Bitcoin dominance: Bitcoin’s share of the total crypto market cap, a crypto-index input where a flight into Bitcoin reads as fear in alts.
- Mean reversion: the tendency of a stretched market to snap back toward its average.
- RSI: a momentum gauge from 0 to 100, where above 70 is overbought and below 30 is oversold.
FAQ
What is the Fear and Greed Index, in plain terms?
It is a single number, from 0 to 100, that measures how a market feels. A low number means the crowd is fearful and selling, a high number means the crowd is greedy and buying. It puts a mood you can usually only sense into one figure you can track.
What does the Fear and Greed Index mean when it is high or low?
A low reading, under 25, means Extreme Fear, so the crowd is panicking and mostly finished selling. A high reading, above 75, means Extreme Greed, so buyers are euphoric and mostly out of fuel. The tool is contrarian, which is why the extremes matter more than the middle.
How do you use the Fear and Greed Index in trading?
Use it as a lens, not a signal. Look to buy when Extreme Fear is deep and has stopped falling, look to take profit when Extreme Greed runs hot, and skip the middle of the scale where it has no edge. Always confirm the reading against price and a momentum gauge before acting.
When should I buy when fear is extreme?
Not the instant it hits Extreme Fear, because fear can keep deepening. Wait for the reading to flatten out and for price to stop making fresh lows, then scale in slowly with a stop set in advance. Buying into panic only works with a plan, not with your whole account at once.
What is the difference between the crypto and stock Fear and Greed Index?
The stock version, from CNN, blends seven equally weighted inputs like the VIX, momentum and safe-haven demand, and updates once a day. The crypto version, from alternative.me, reads Bitcoin volatility, volume, social media, dominance and search trends, and updates continuously. Crypto hits the extremes far more often because it swings harder.
Does the Fear and Greed Index actually work?
As a contrarian lens at the extremes, it has a decent record of flagging when a crowd is overdone. As a precise timing tool it does not work, because fear can stay extreme for weeks in a downtrend and greed can run hot through a bull. Treat it as odds shifting, not a promise.
Which timeframe should I read it on?
The daily and weekly charts are best for judging the overall regime and spotting real extremes. The 4-hour swings faster and suits short-term traders looking for mean-reverting bounces. The faster the timeframe, the more noise, so a fast reading is a heads-up rather than a standalone signal.
Does it read the same on Bitcoin and altcoins?
No. Altcoins like Ethereum are more volatile, so they push further into Extreme Fear than Bitcoin under the same stress. A Bitcoin extreme carries more weight, and on smaller alts the sentiment reading is unreliable on its own, so you have to lean on the coin's own chart.
Can I rely on the index alone?
No, and that is the most common mistake. On its own it will fool you as often as it helps. Its real value shows up when it agrees with price structure and a momentum gauge, or with a positioning report like the commitment of traders data.
Where can I find the Fear and Greed Index chart?
The crypto version is published free by alternative.me and mirrored across most crypto data sites. The stock-market version lives on CNN's markets pages. Both show the same 0 to 100 scale with the coloured fear-to-greed bands, so the reading habits carry across either one.
🌍 Our recommended brokers


Reader Reviews
Be the first to review this — tell other traders what actually helped, or where it fell short.
Leave a Review

Forex Analyst & Senior Trader
Former FX desk trader with 8 years in institutional forex. Works in multi-timeframe analysis and order flow, turning desk experience into systematic, testable rules across forex and metals.